Copyright
©The Author(s) 2024.
World J Gastrointest Oncol. Mar 15, 2024; 16(3): 919-932
Published online Mar 15, 2024. doi: 10.4251/wjgo.v16.i3.919
Published online Mar 15, 2024. doi: 10.4251/wjgo.v16.i3.919
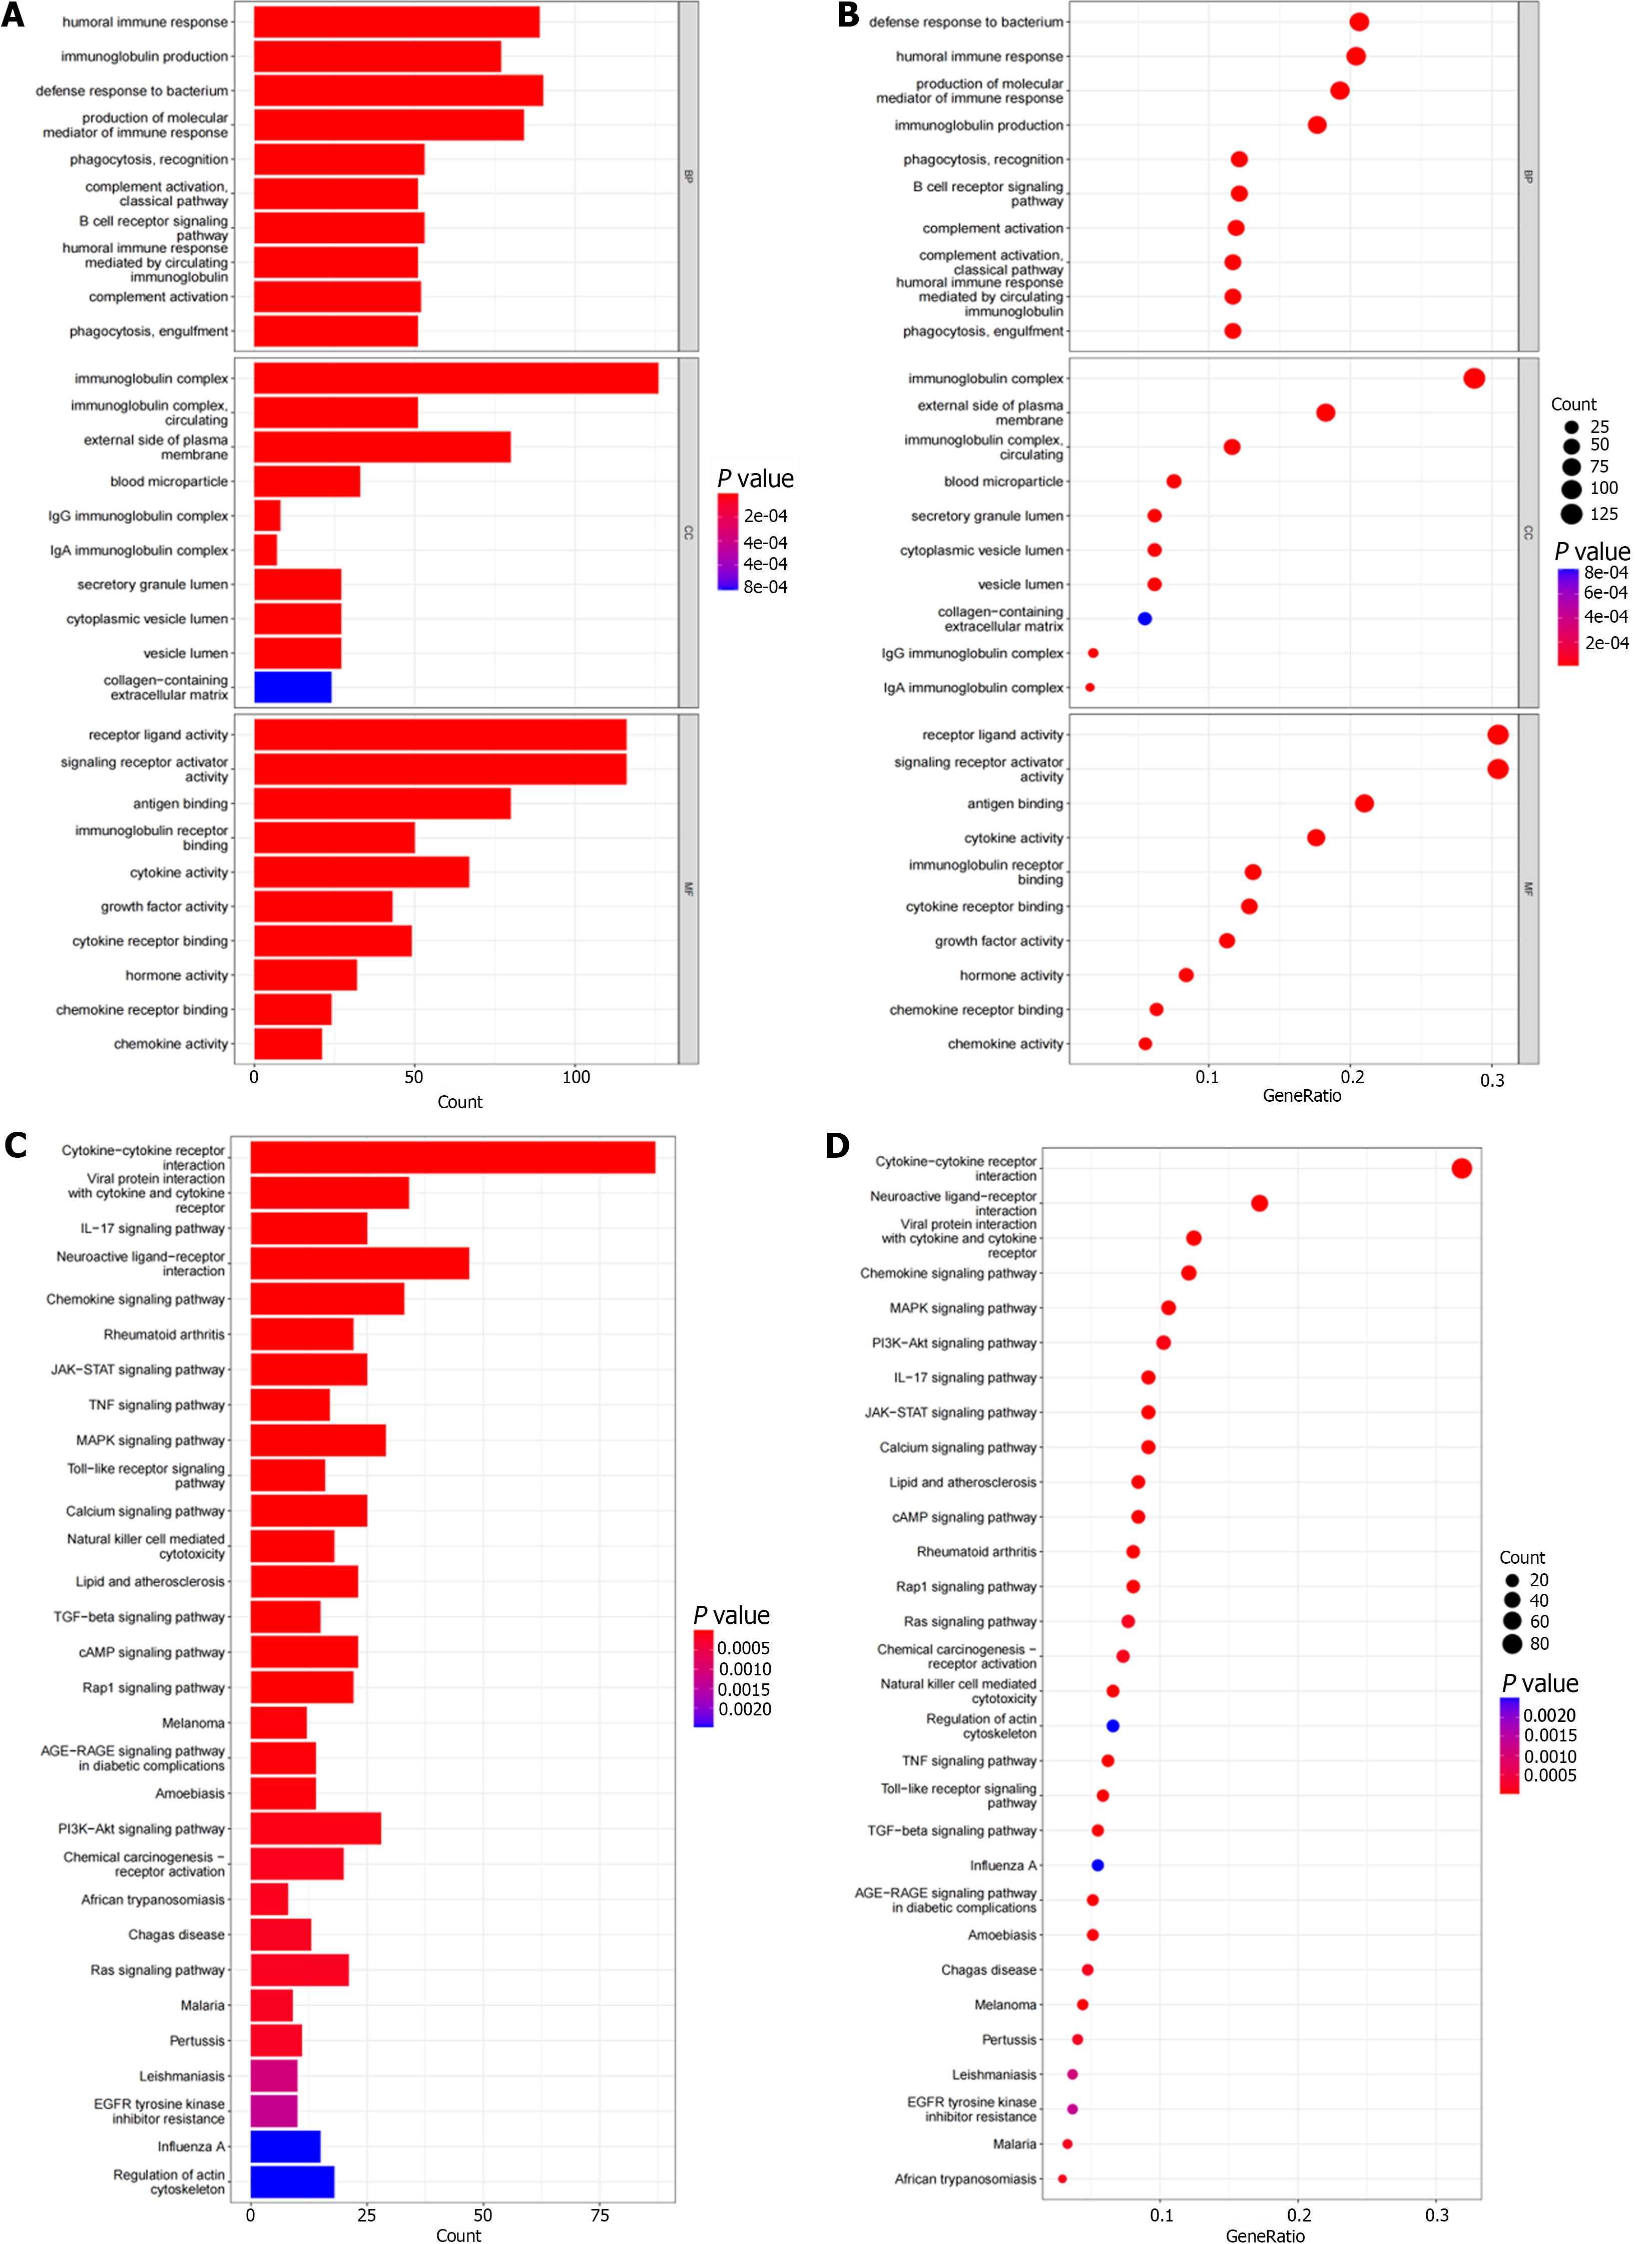
Figure 2 Functional enrichment pathways.
A: The bar chart shows the top 10 functional enrichment pathways in Gene Ontology (GO) analysis; B: The bubble chart showed the top 10 functional enrichment pathways in GO analysis; C: The bar chart showed the top 10 functional enrichment pathways in the Kyoto Encyclopedia of Genes and Genomes (KEGGs) analysis; D: The bubble chart showed the top 10 functional enrichment pathways in the KEGGs analysis.
- Citation: Ma XT, Liu X, Ou K, Yang L. Construction of an immune-related gene signature for overall survival prediction and immune infiltration in gastric cancer. World J Gastrointest Oncol 2024; 16(3): 919-932
- URL: https://www.wjgnet.com/1948-5204/full/v16/i3/919.htm
- DOI: https://dx.doi.org/10.4251/wjgo.v16.i3.919


