Copyright
©The Author(s) 2024.
World J Gastrointest Oncol. Mar 15, 2024; 16(3): 919-932
Published online Mar 15, 2024. doi: 10.4251/wjgo.v16.i3.919
Published online Mar 15, 2024. doi: 10.4251/wjgo.v16.i3.919
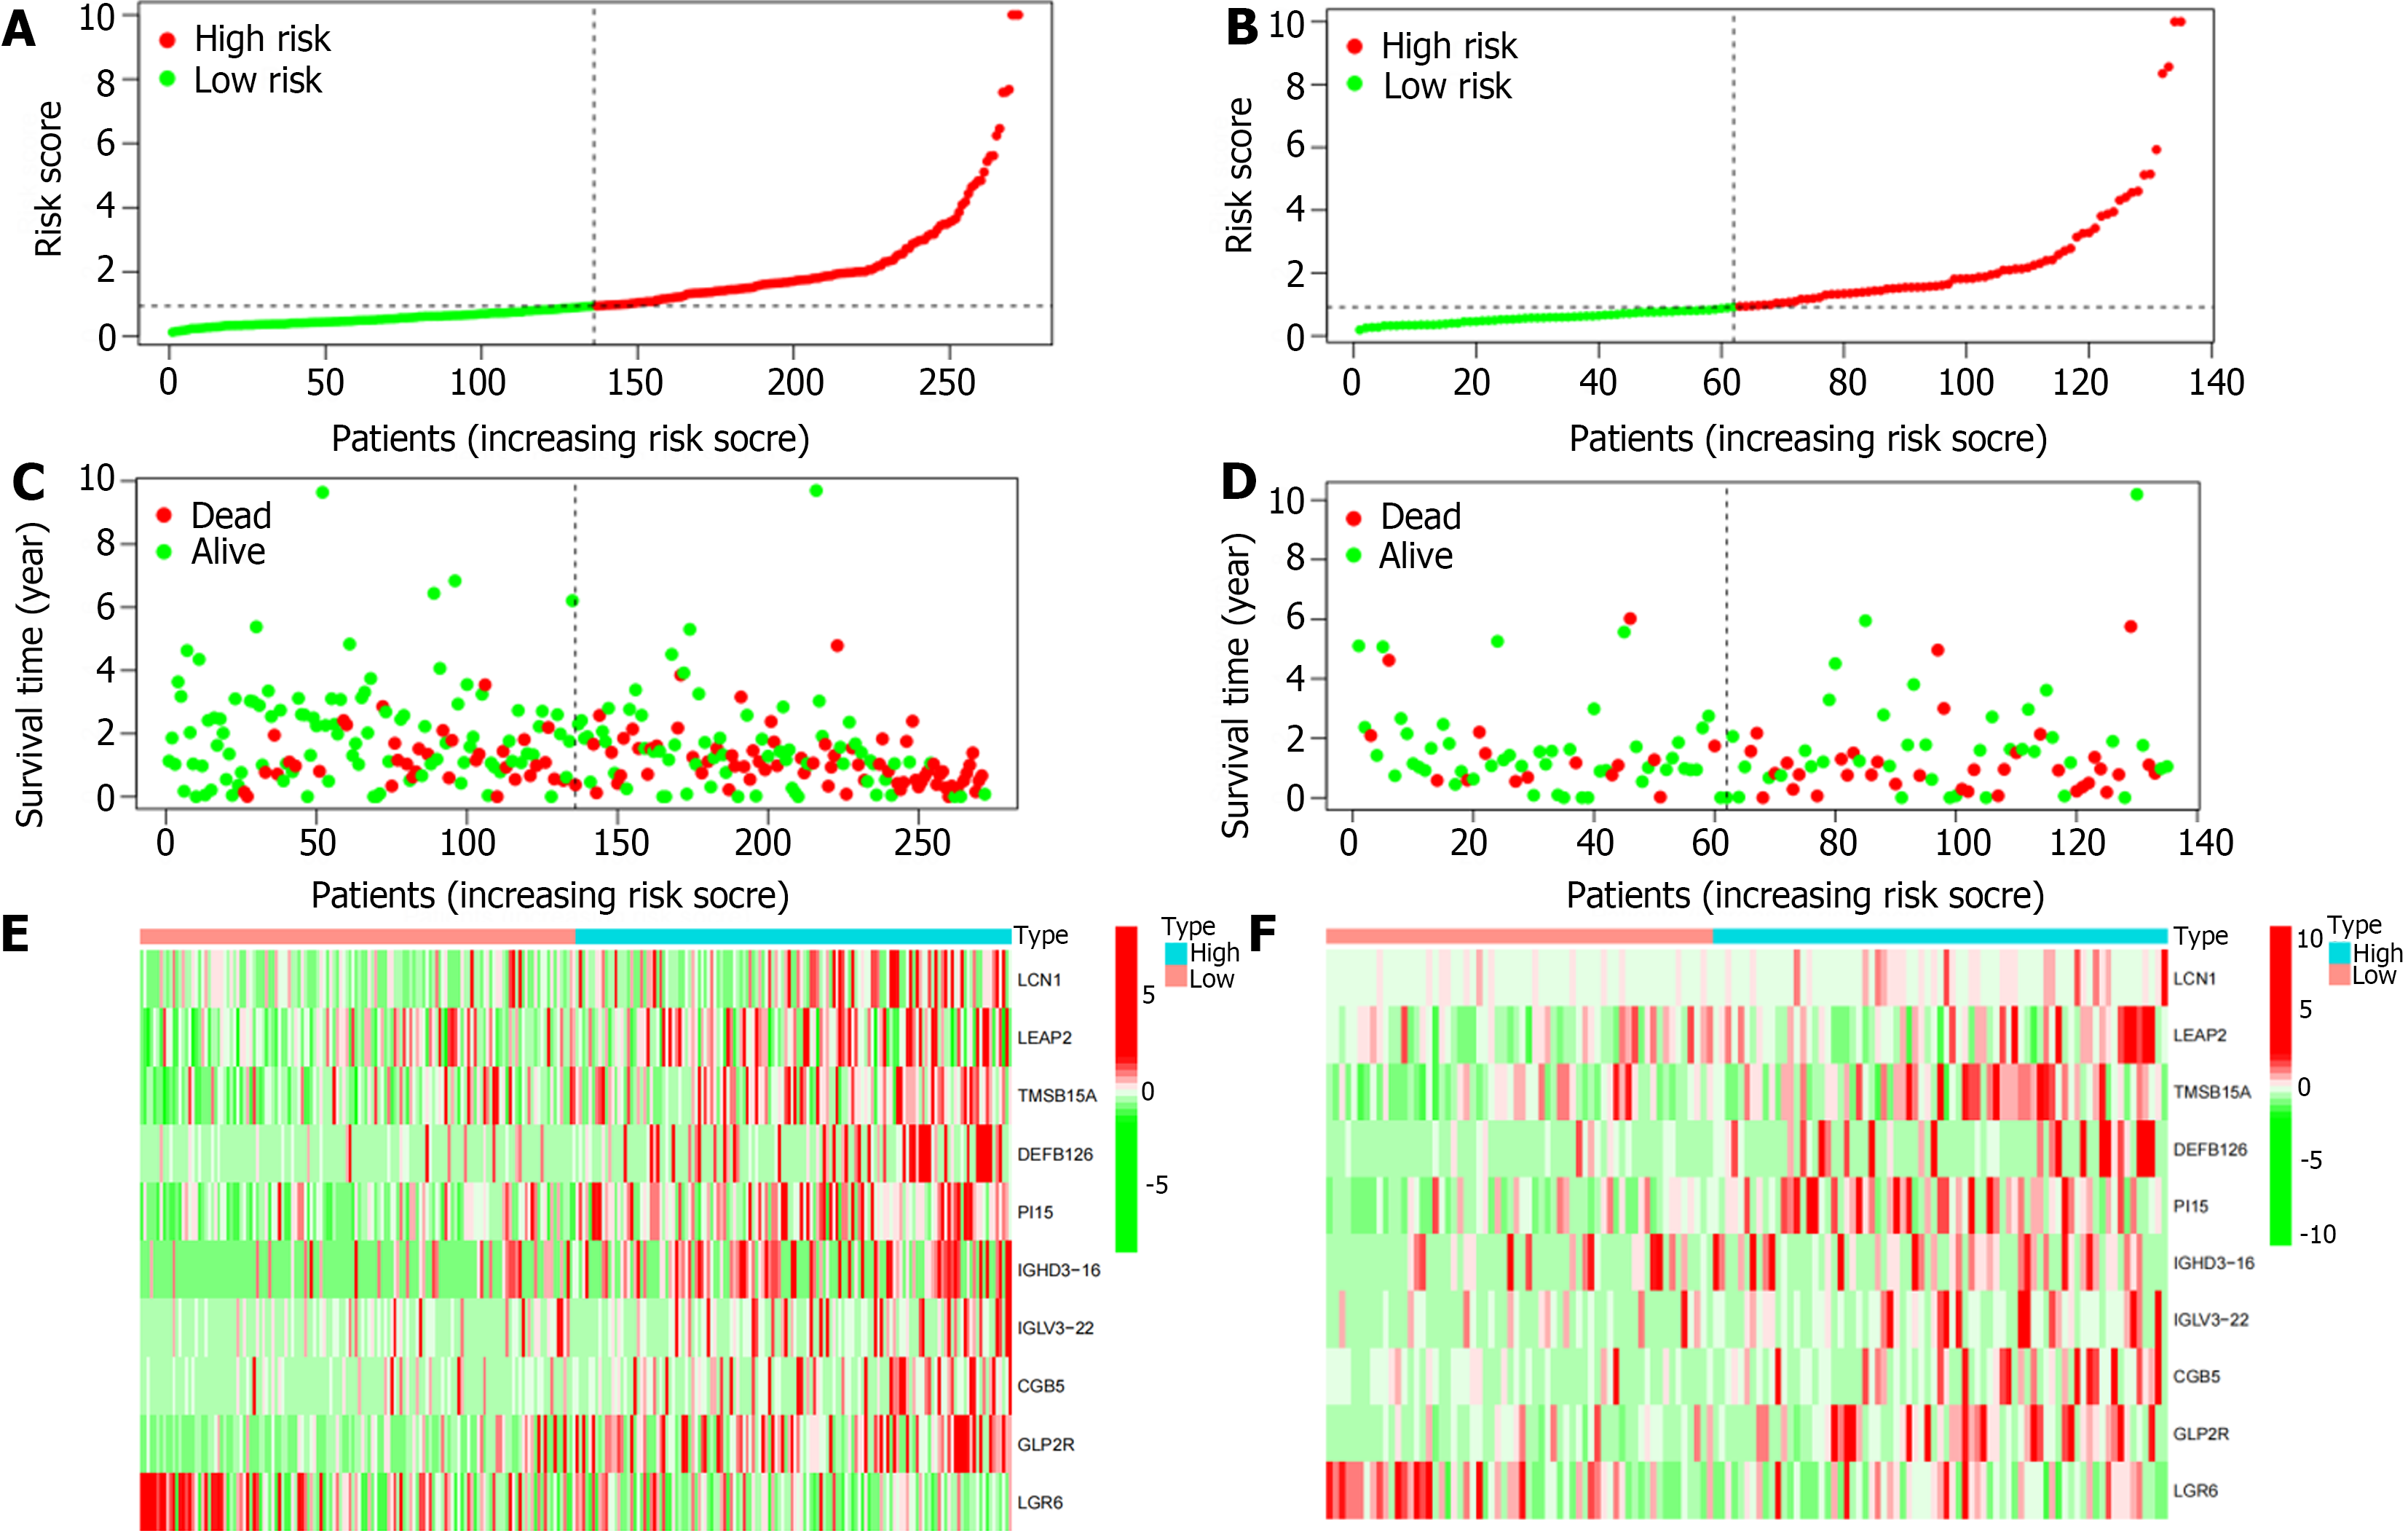
Figure 5 Correlation analysis of survival time and risk scores.
A: In the training cohort, there was a correlation between the patient’s risk score and gastric cancer (GC) mortality, with a higher score indicating a greater risk; B: In the test cohort, there was a correlation between the patient’s risk score and GC mortality, with a higher score indicating a greater risk; C: The scatter plot shows the correlation between survival time and risk score in GC patients in training cohort; D: The scatter plot shows the correlation between survival time and risk score in GC patients in training cohort; E: The heatmap showed that in the training cohort, LCN1, LEAP2, TMSB15A, DEFB126, PI15, IGHD3-16, IGLV3-22, CGB5, and GLP2R were highly expressed in the high-risk group, while LGR6 was highly expressed in the low-risk; F: The heatmap showed that in the test cohort, LCN1, LEAP2, TMSB15A, DEFB126, PI15, IGHD3-16, IGLV3-22, CGB5, and GLP2R were highly expressed in the high-risk group, while LGR6 was highly expressed in the low-risk.
- Citation: Ma XT, Liu X, Ou K, Yang L. Construction of an immune-related gene signature for overall survival prediction and immune infiltration in gastric cancer. World J Gastrointest Oncol 2024; 16(3): 919-932
- URL: https://www.wjgnet.com/1948-5204/full/v16/i3/919.htm
- DOI: https://dx.doi.org/10.4251/wjgo.v16.i3.919


