Copyright
©The Author(s) 2024.
World J Gastrointest Oncol. Mar 15, 2024; 16(3): 919-932
Published online Mar 15, 2024. doi: 10.4251/wjgo.v16.i3.919
Published online Mar 15, 2024. doi: 10.4251/wjgo.v16.i3.919
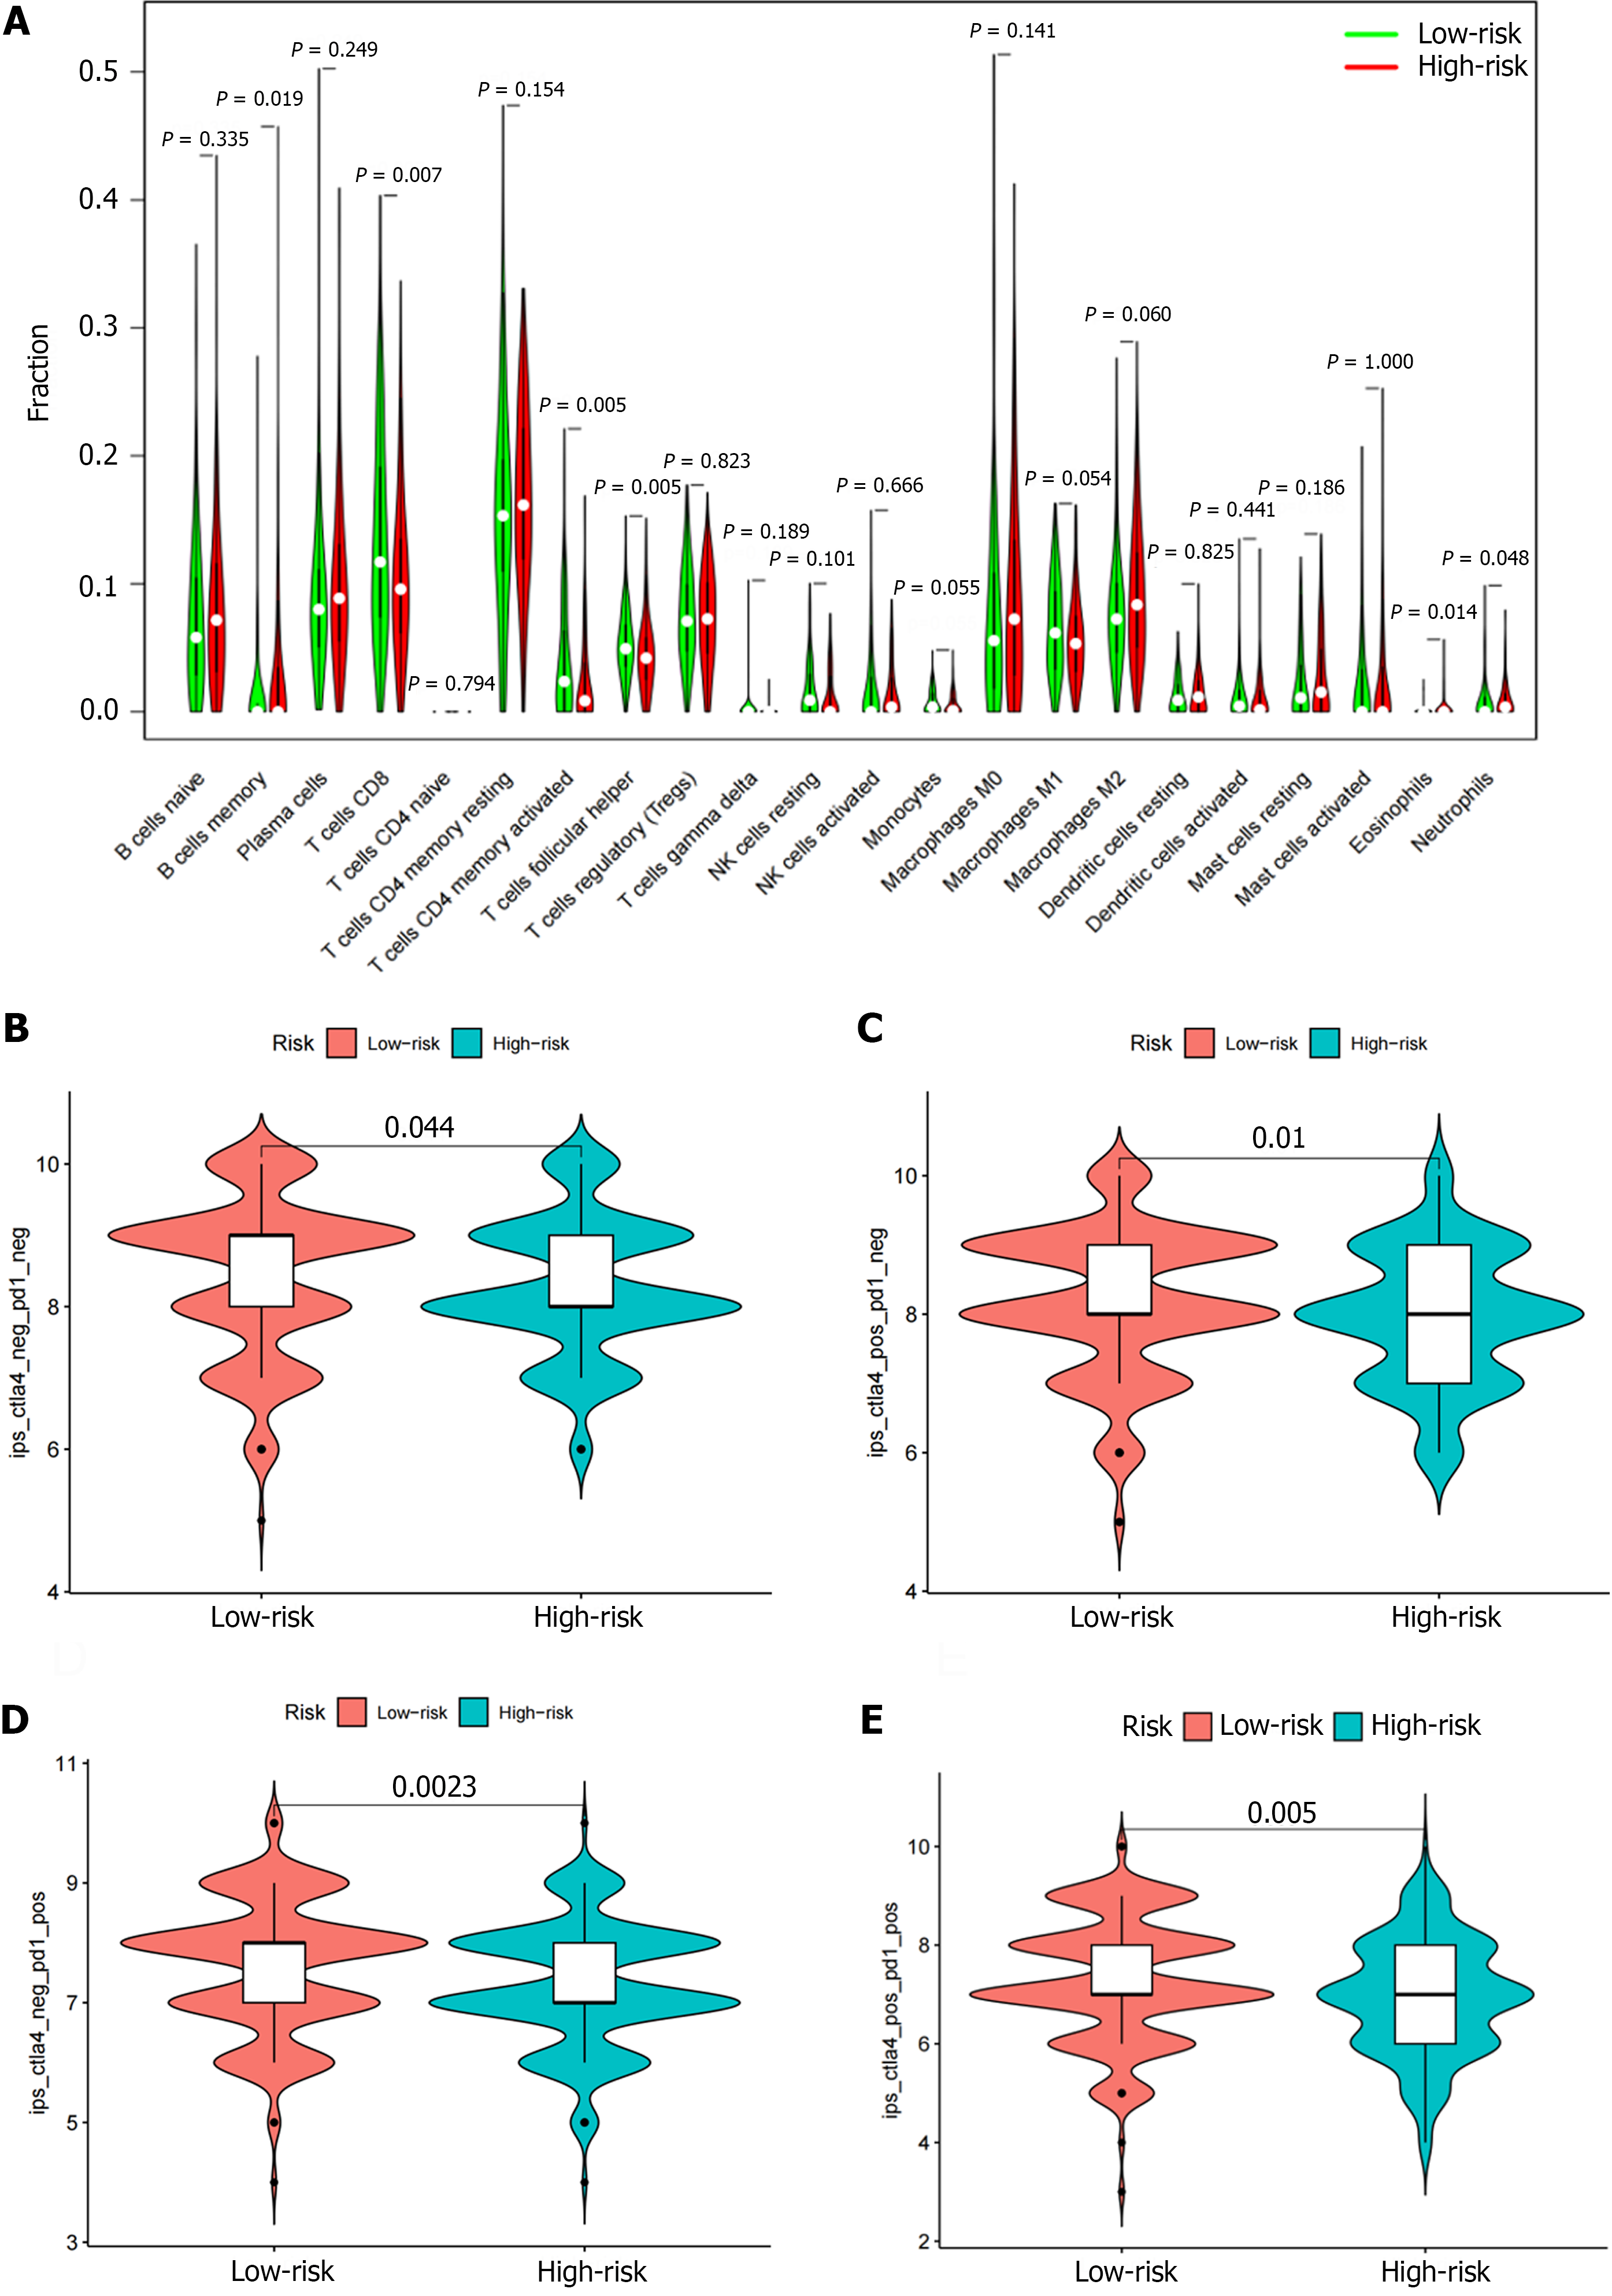
Figure 9 Correlation analysis of different types of immune cells and risk scores.
A: The percentages of CD8 T cells, activated CD4 memory T cells, follicular helper T cells, and neutrophils in the low-risk group were higher than the high-risk group. The proportion of memory B cells and eosinophils in the high-risk group was higher than the low-risk group; B-E: Patients with low-risk scores had higher immunophenotype scores independent of cytotoxic T lymphocyte antigen 4 + or programmed death 1+.
- Citation: Ma XT, Liu X, Ou K, Yang L. Construction of an immune-related gene signature for overall survival prediction and immune infiltration in gastric cancer. World J Gastrointest Oncol 2024; 16(3): 919-932
- URL: https://www.wjgnet.com/1948-5204/full/v16/i3/919.htm
- DOI: https://dx.doi.org/10.4251/wjgo.v16.i3.919


