Copyright
©The Author(s) 2024.
World J Gastrointest Oncol. Mar 15, 2024; 16(3): 919-932
Published online Mar 15, 2024. doi: 10.4251/wjgo.v16.i3.919
Published online Mar 15, 2024. doi: 10.4251/wjgo.v16.i3.919
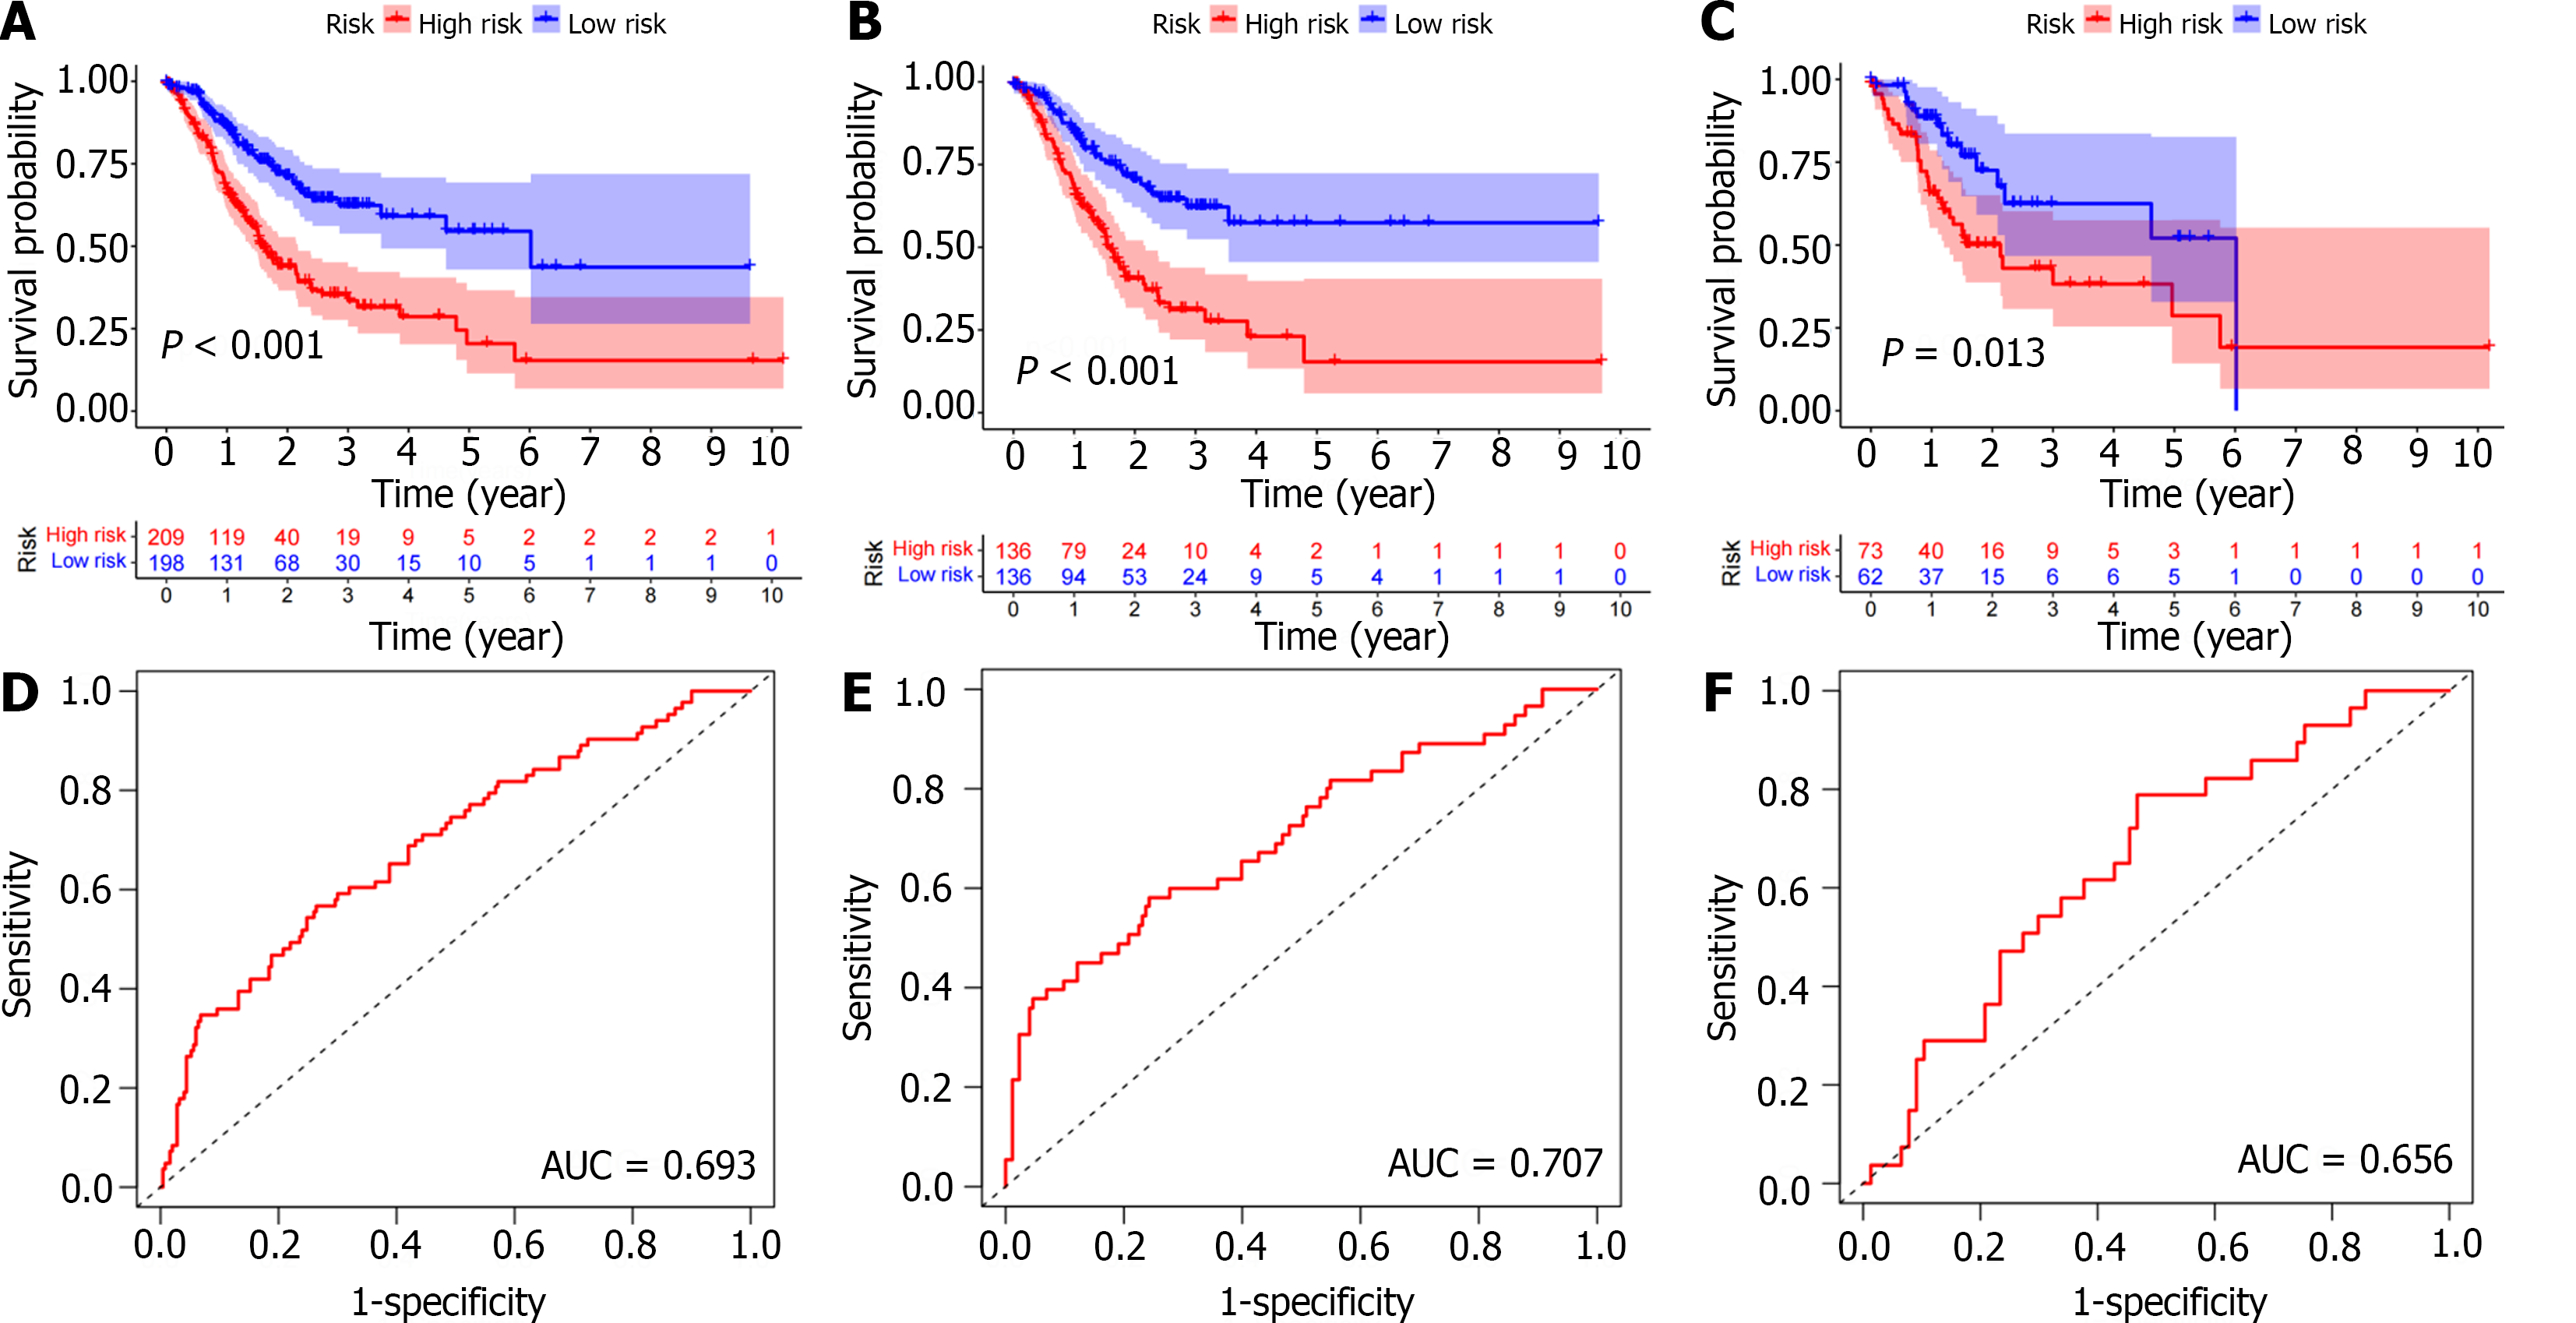
Figure 4 Survival analysis.
A-C: Kaplan Meier survival analysis showed that the overall survival of the low-risk group was significantly longer in the entire population, training cohort, and test cohort; D-F: The area under curve of the total population, training cohort, and test cohort were 0.693, 0.707, and 0.656, respectively. AUC: Area under the receiver operating characteristic curve.
- Citation: Ma XT, Liu X, Ou K, Yang L. Construction of an immune-related gene signature for overall survival prediction and immune infiltration in gastric cancer. World J Gastrointest Oncol 2024; 16(3): 919-932
- URL: https://www.wjgnet.com/1948-5204/full/v16/i3/919.htm
- DOI: https://dx.doi.org/10.4251/wjgo.v16.i3.919


