
















Copyright: ©Author(s) 2026.
World J Gastrointest Oncol. Sep 15, 2026; 18(9): 123745
Published online Sep 15, 2026. doi: 10.4251/wjgo.123745
Published online Sep 15, 2026. doi: 10.4251/wjgo.123745
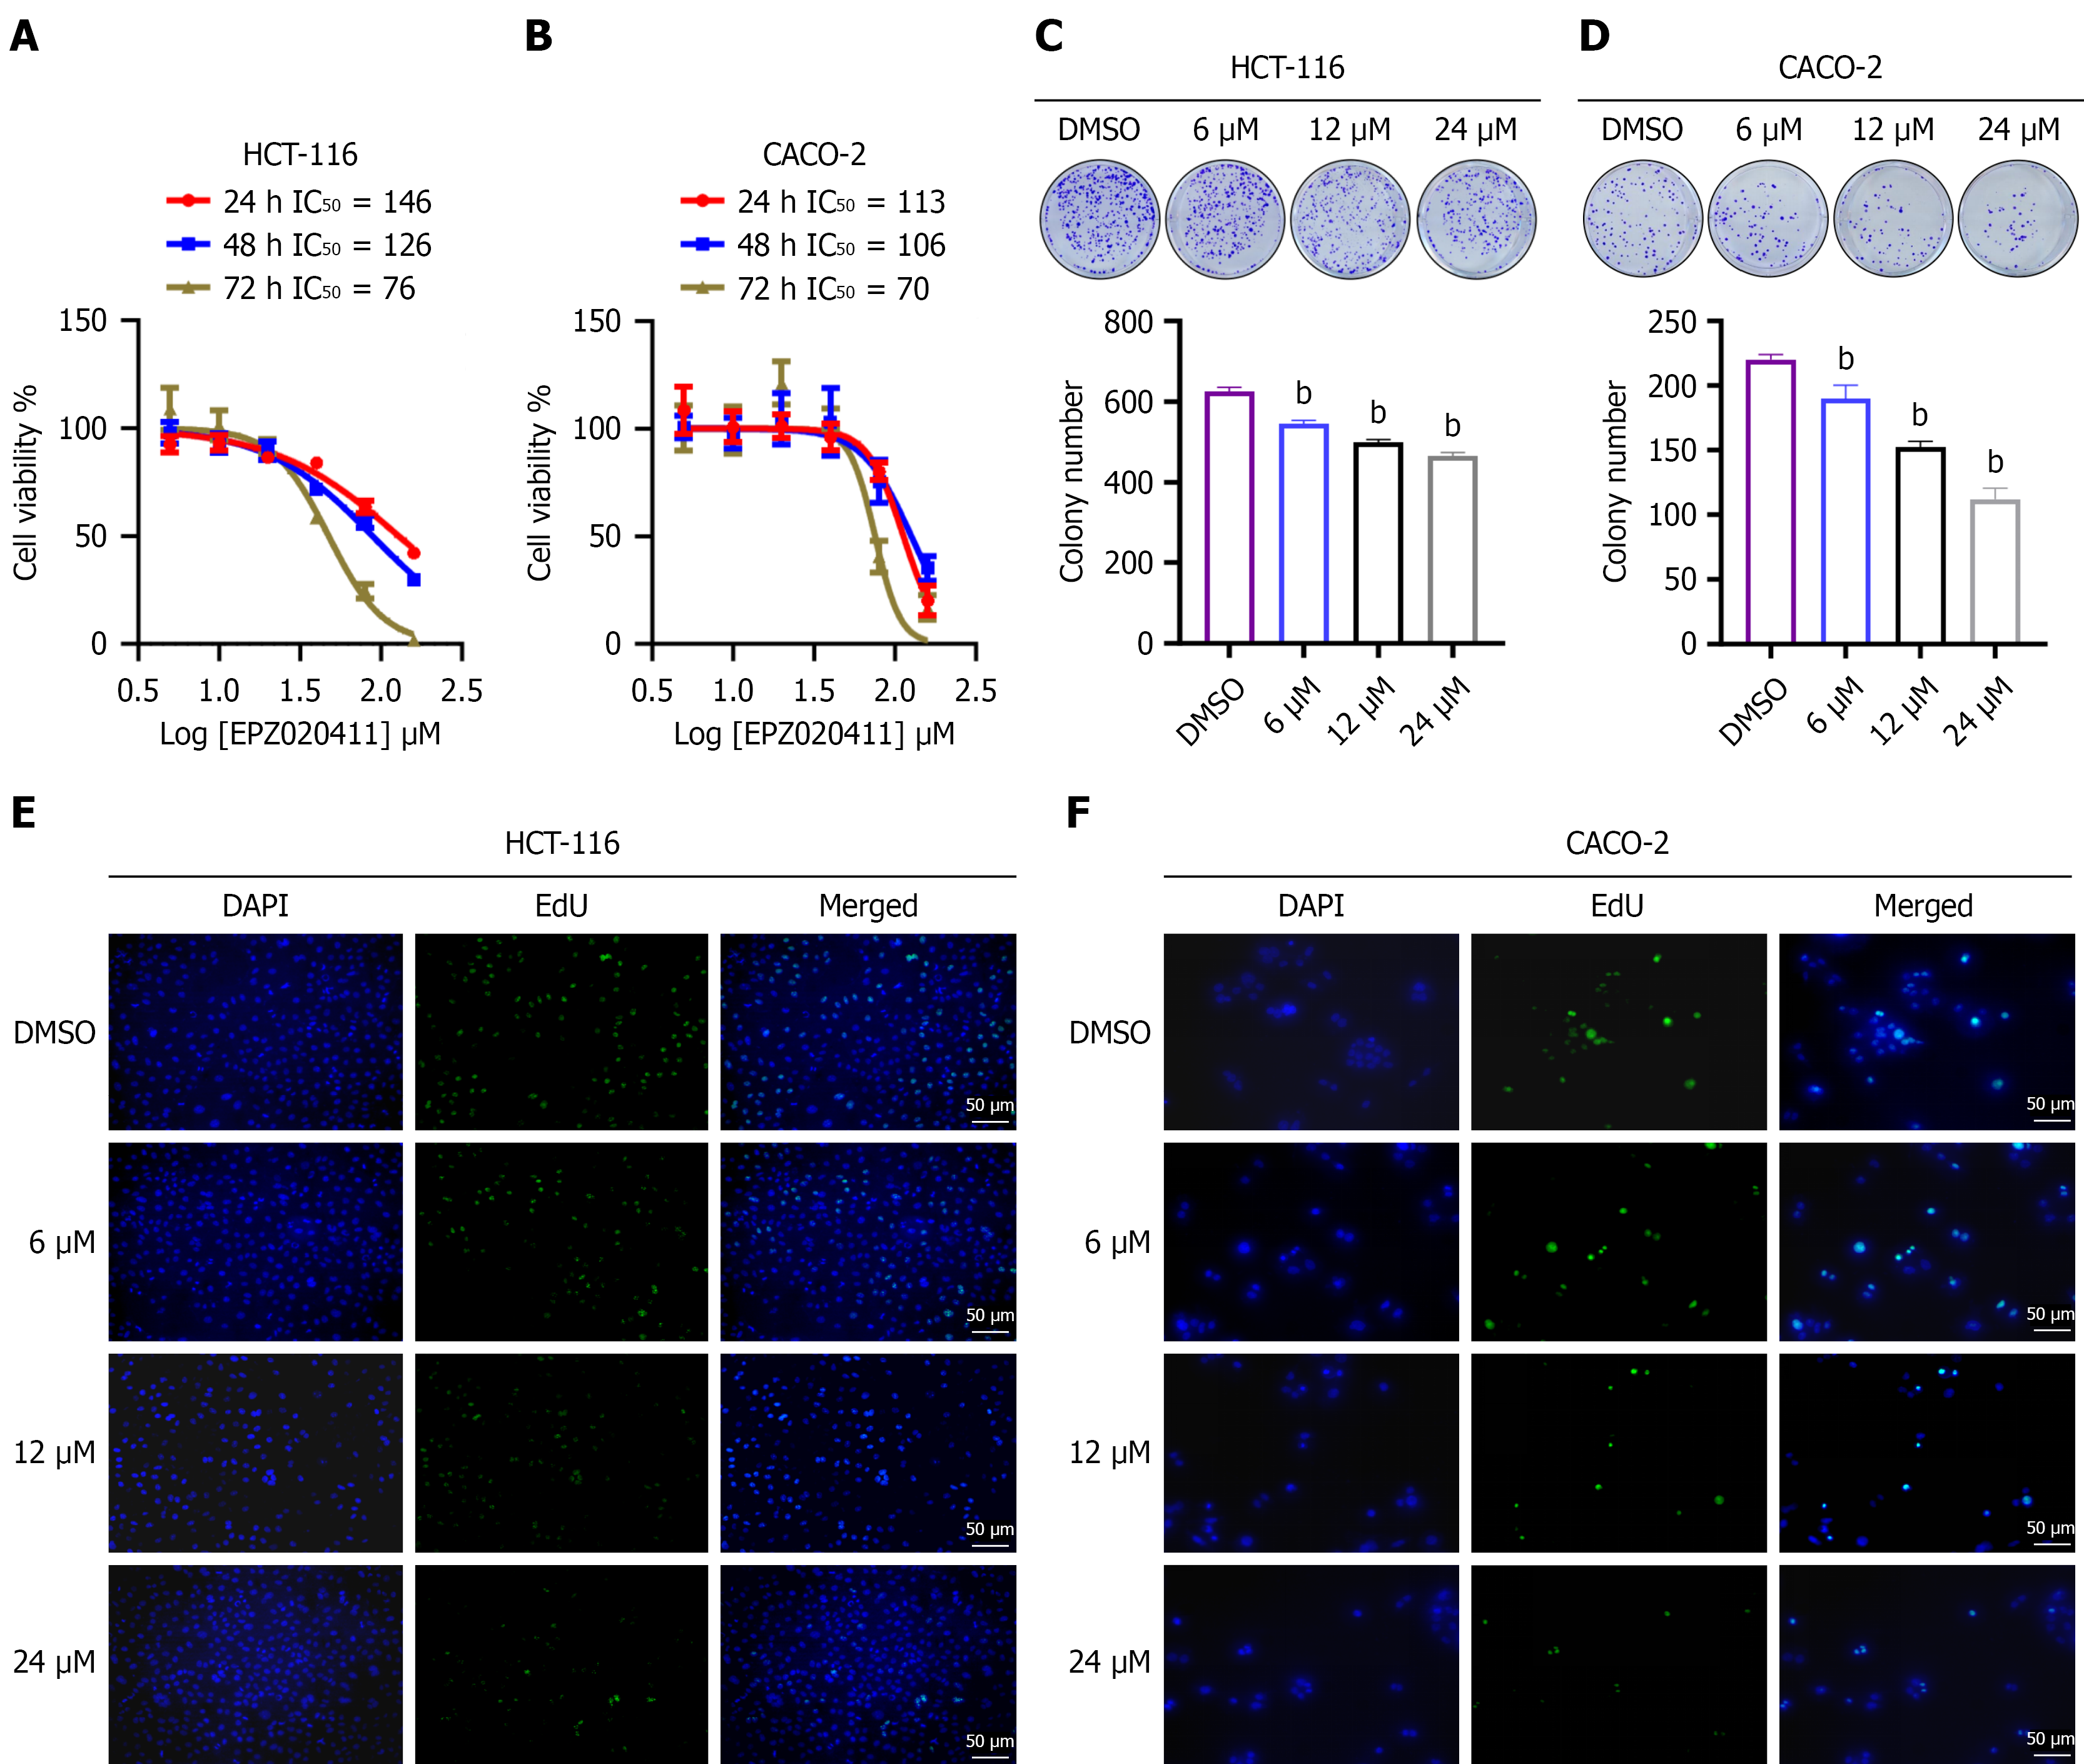
Figure 1 Effects of EPZ020411 at varying concentrations on the proliferation of colorectal cancer cells.
A and B: IC50 values were calculated by nonlinear regression analysis; C and D: Representative images of colony formation assays of HCT116 (C) and CACO-2 (D) cells treated with increasing concentrations of EPZ020411; E and F: EdU staining was performed to detect the proliferation of HCT116 (E) and CACO-2 (F) cells treated with increasing concentrations of EPZ020411 (scale bar: 50 μm). Error bars represented the mean ± SEM. bP < 0.001.
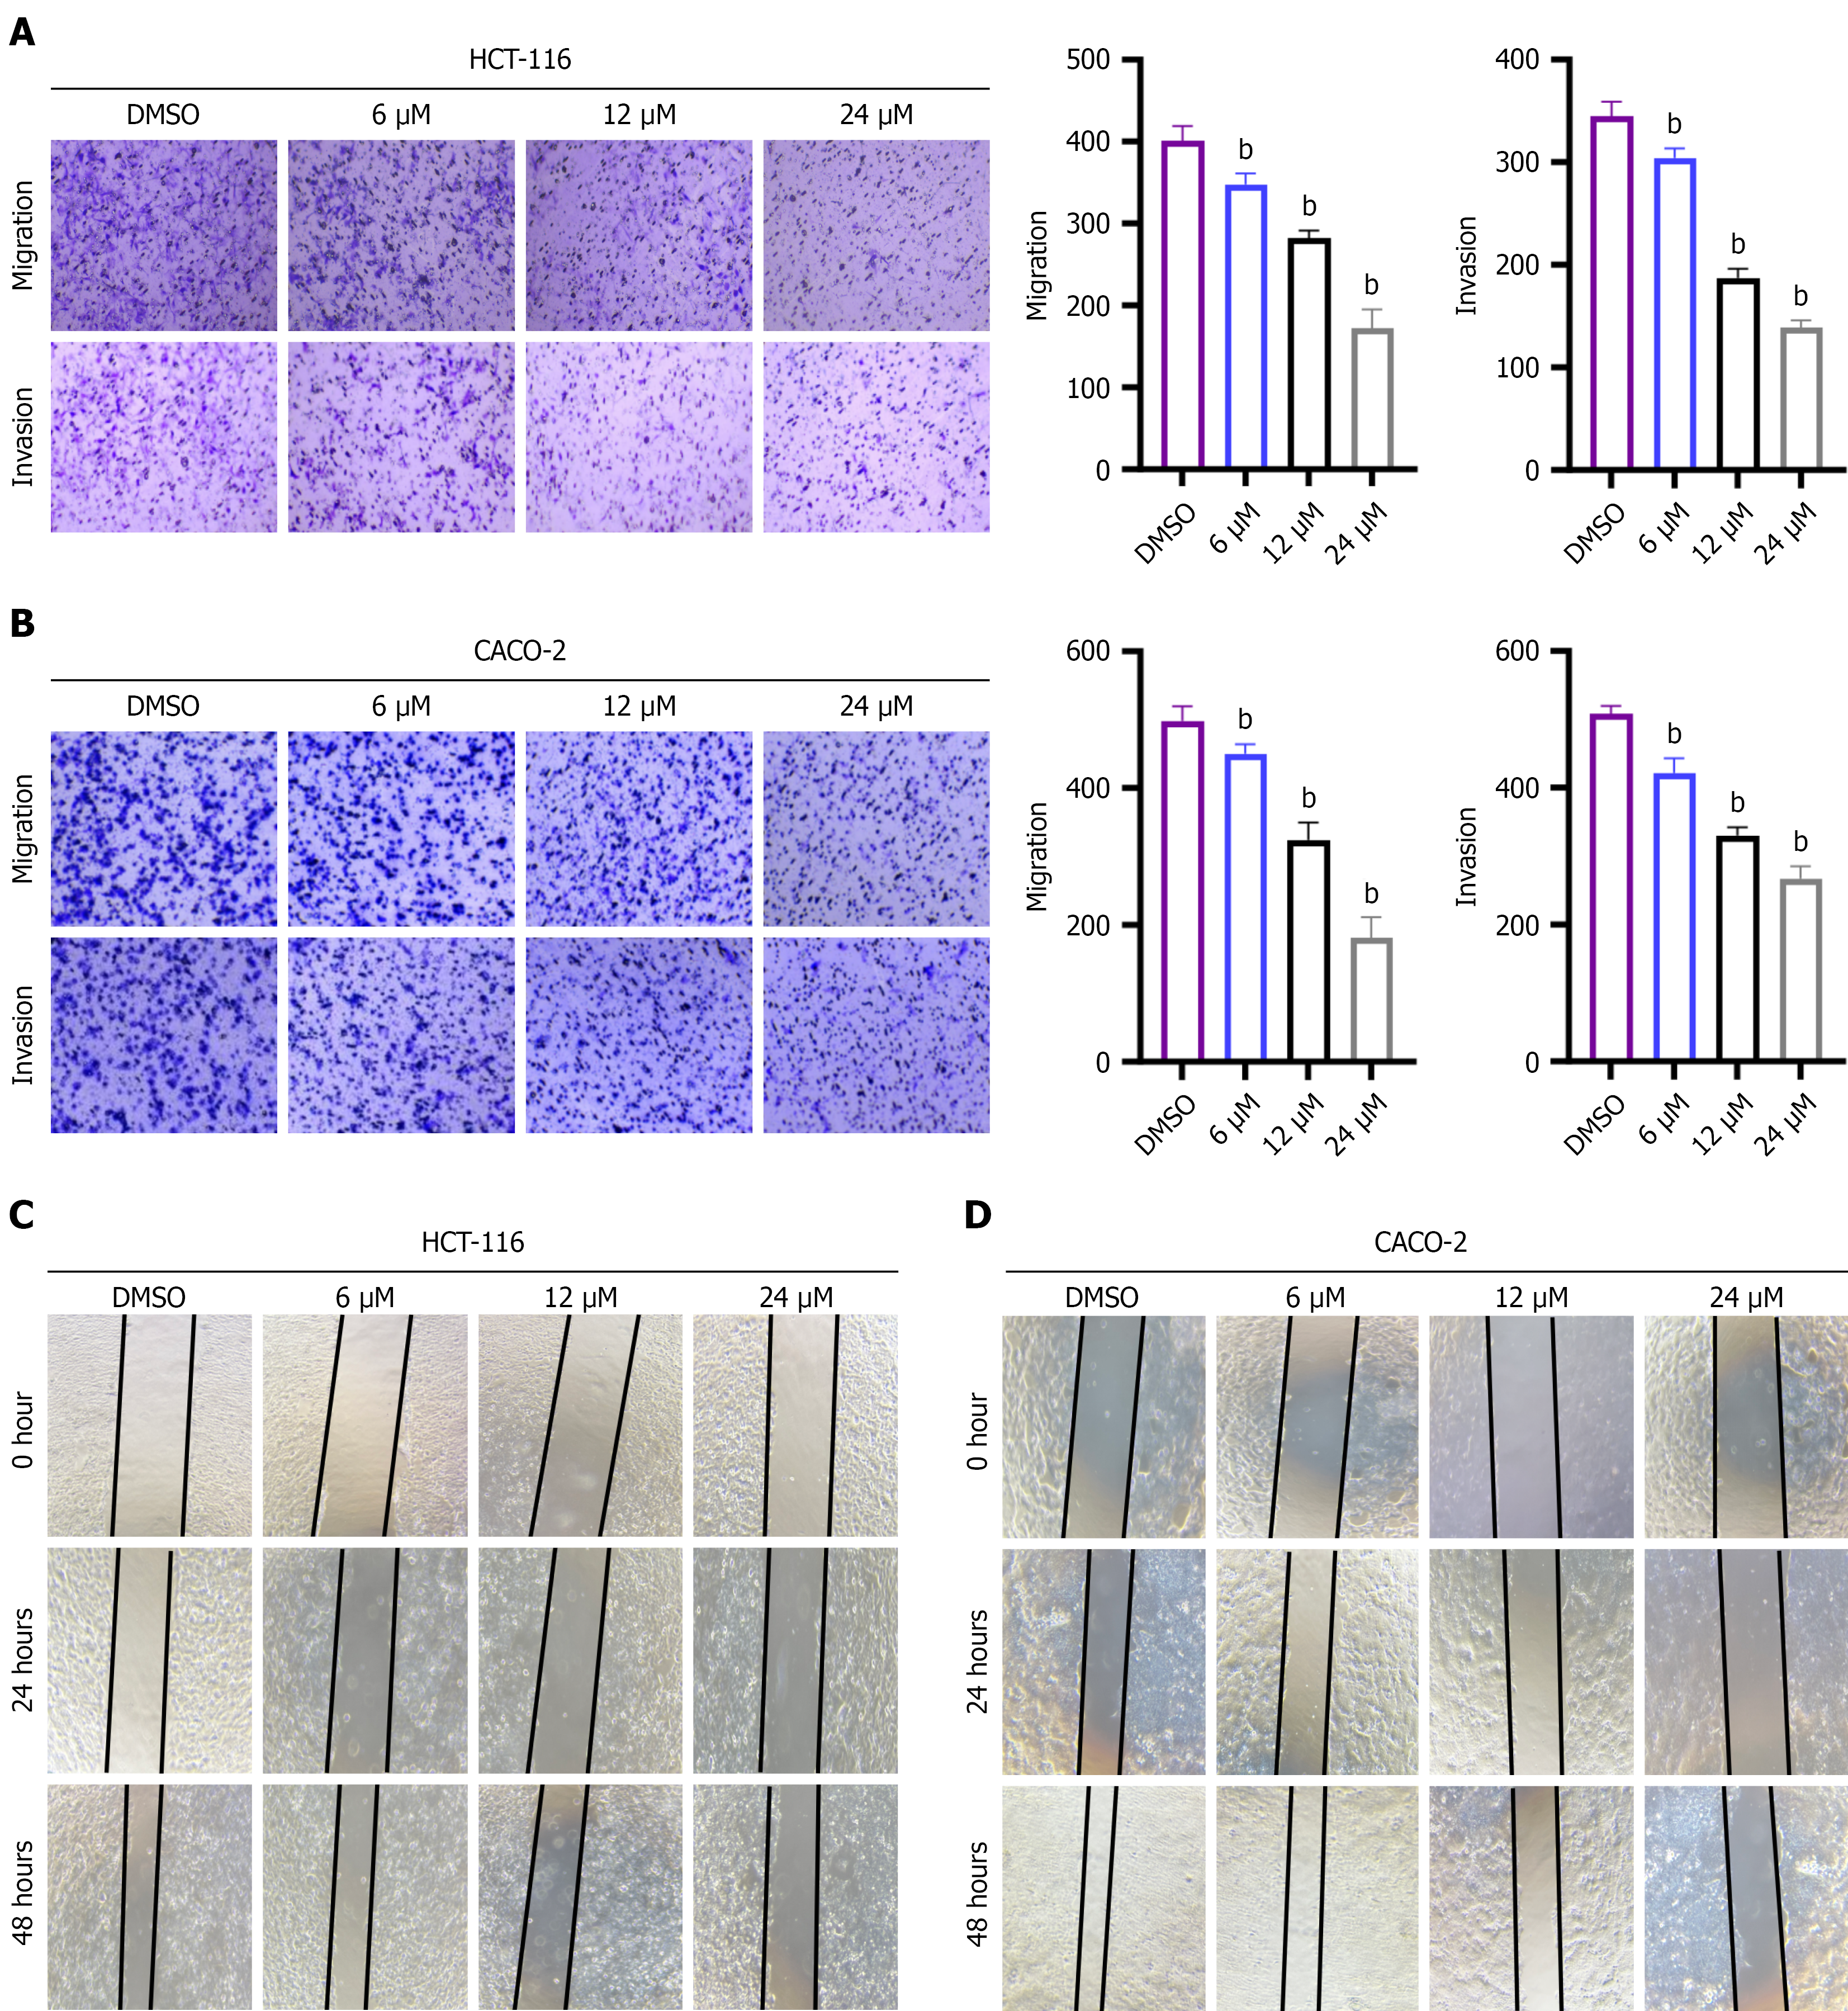
Figure 2 EPZ020411 inhibits the migration and invasion of colorectal cancer cells in a concentration-dependent manner.
A and B: Transwell assays showing the effects of increasing concentrations of EPZ020411 on the migration and invasion of HCT116 (A) and CACO-2 (B) cells; C and D: Wound healing assays assessing the migratory ability of HCT116 (C) and CACO-2 (D) cells after EPZ020411 treatment. Data are presented as mean ± SD from three independent experiments (n = 3). Error bars represented the mean ± SEM. bP < 0.001.
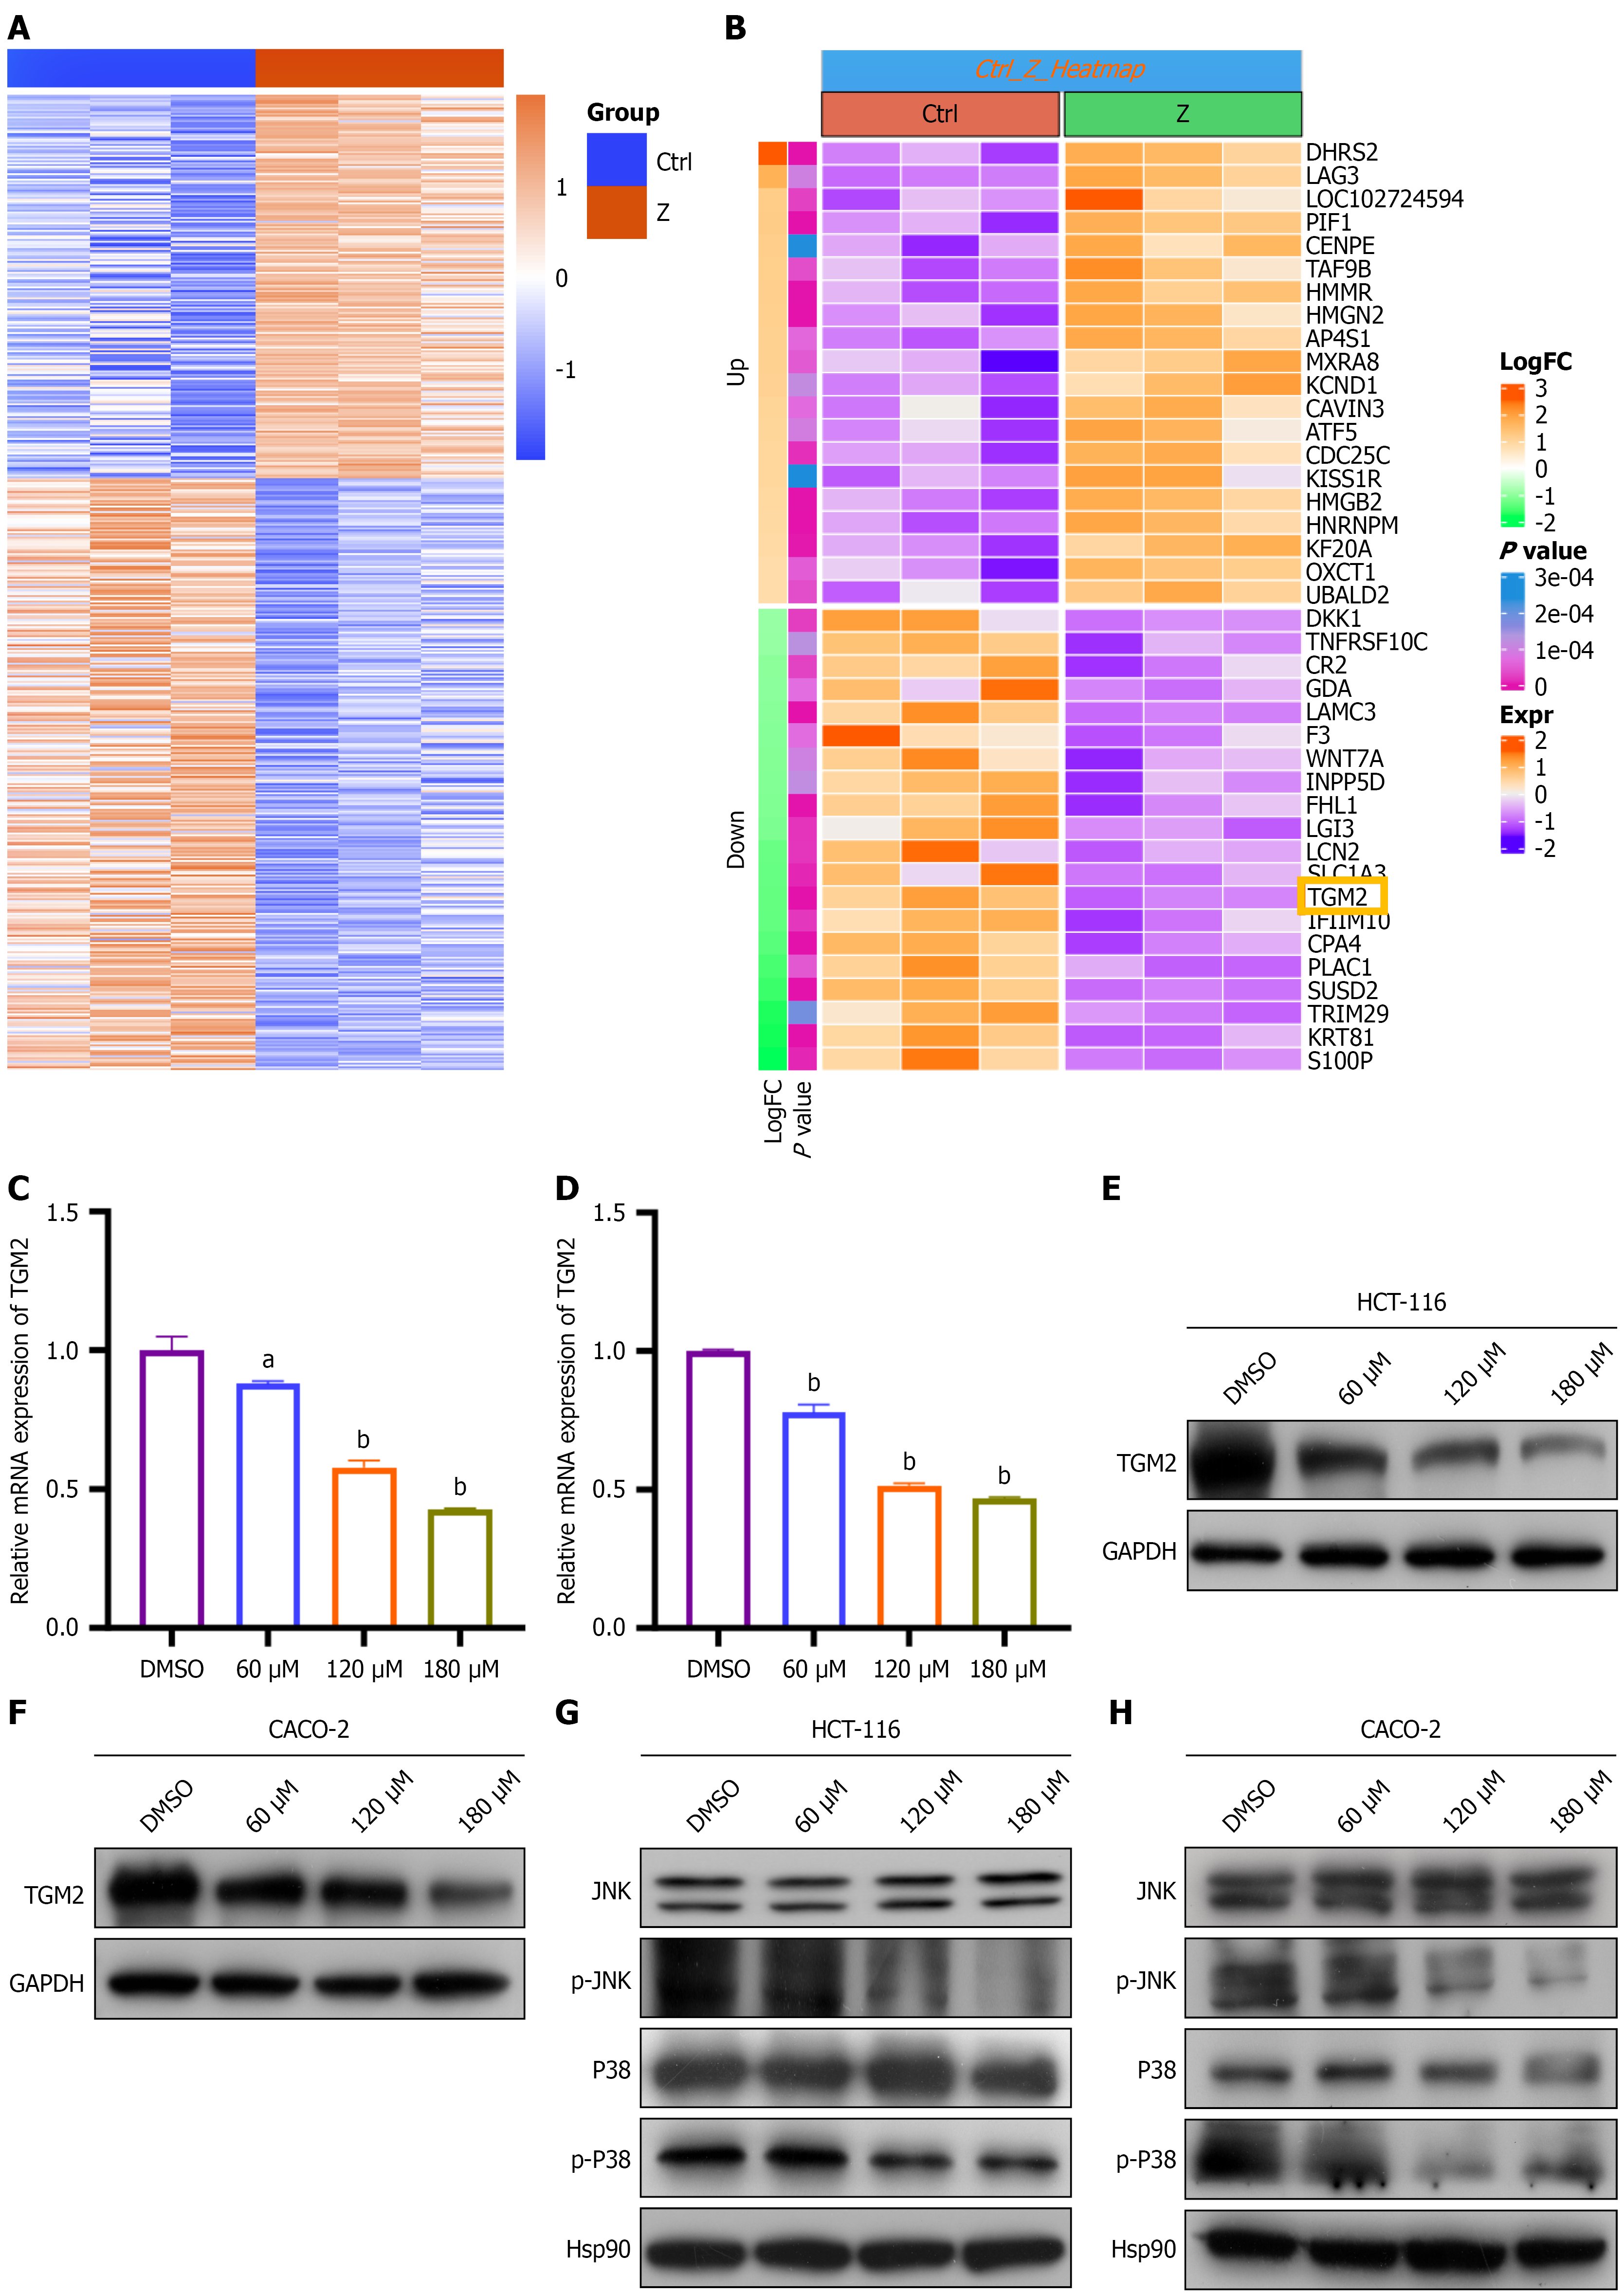
Figure 3 EPZ020411 inhibits transglutaminase 2 gene expression and suppresses the JNK and p38 signaling pathways.
A and B: The heatmap of RNA sequencing displays the differentially expressed genes in HCT116 cells treated with EPZ020411; C and D: Reverse transcription-quantitative polymerase chain reaction was used to detect the expression levels of transglutaminase 2 (TGM2) mRNA in EPZ020411-treated HCT116 and CACO-2 cells; E and F: Western blot was used to detect the expression levels of TGM2 protein in EPZ020411-treated HCT116 and CACO-2 cells; G and H: Western blot analysis of JNK, p-JNK, p38 and p-p38 protein levels in HCT116 and CACO-2 cells treated with varying concentrations of EPZ020411. Data are presented as mean ± SD from three independent experiments (n = 3). Error bars represented the mean ± SEM. aP < 0.01, bP < 0.001. TGM2: Transglutaminase 2.
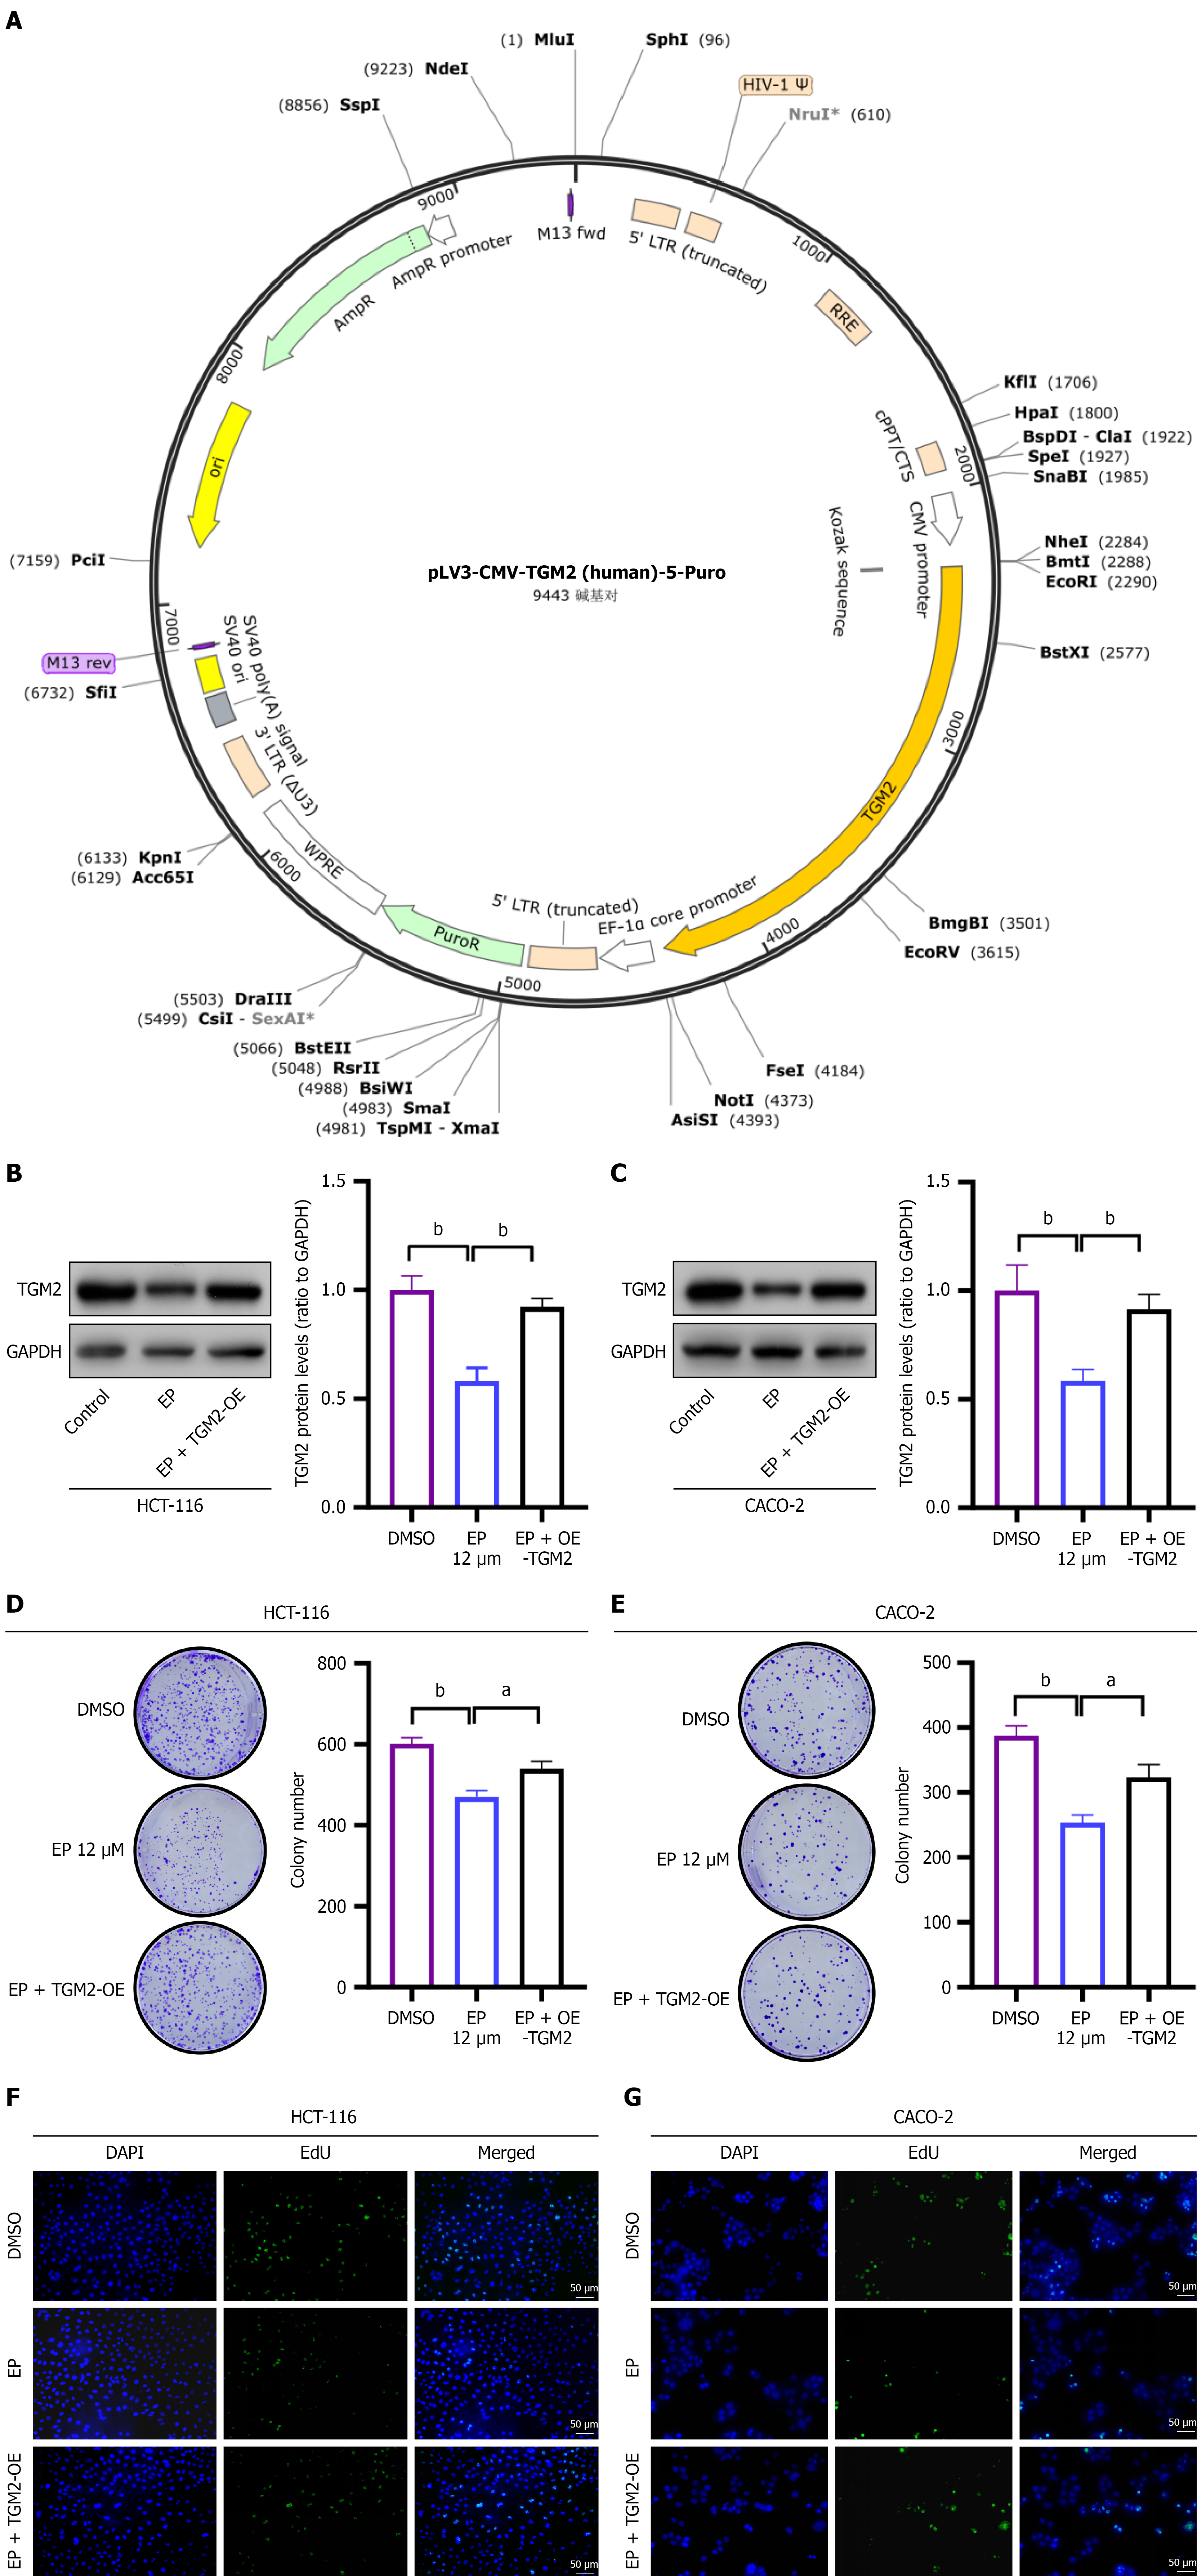
Figure 4 Transglutaminase 2 overexpression enhances colorectal cancer cell proliferation.
A: Circular plasmid map of lentiviral vector pLV3-CMV-TGM2 (human)-5-Puro; B and C: Western blot was used to detect the expression levels of transglutaminase 2 protein levels in HCT116 (B) and CACO-2 (C) cells; D and E: Representative image of colony formation assays of HCT116 (D) and CACO-2 (E) cells; F and G: EdU staining was performed to detect the proliferation of HCT116 (F) and CACO-2 (G) cells (scale bar: 50 μm). Error bars represented the mean ± SEM. aP < 0.01, bP < 0.001. TGM2: Transglutaminase 2.
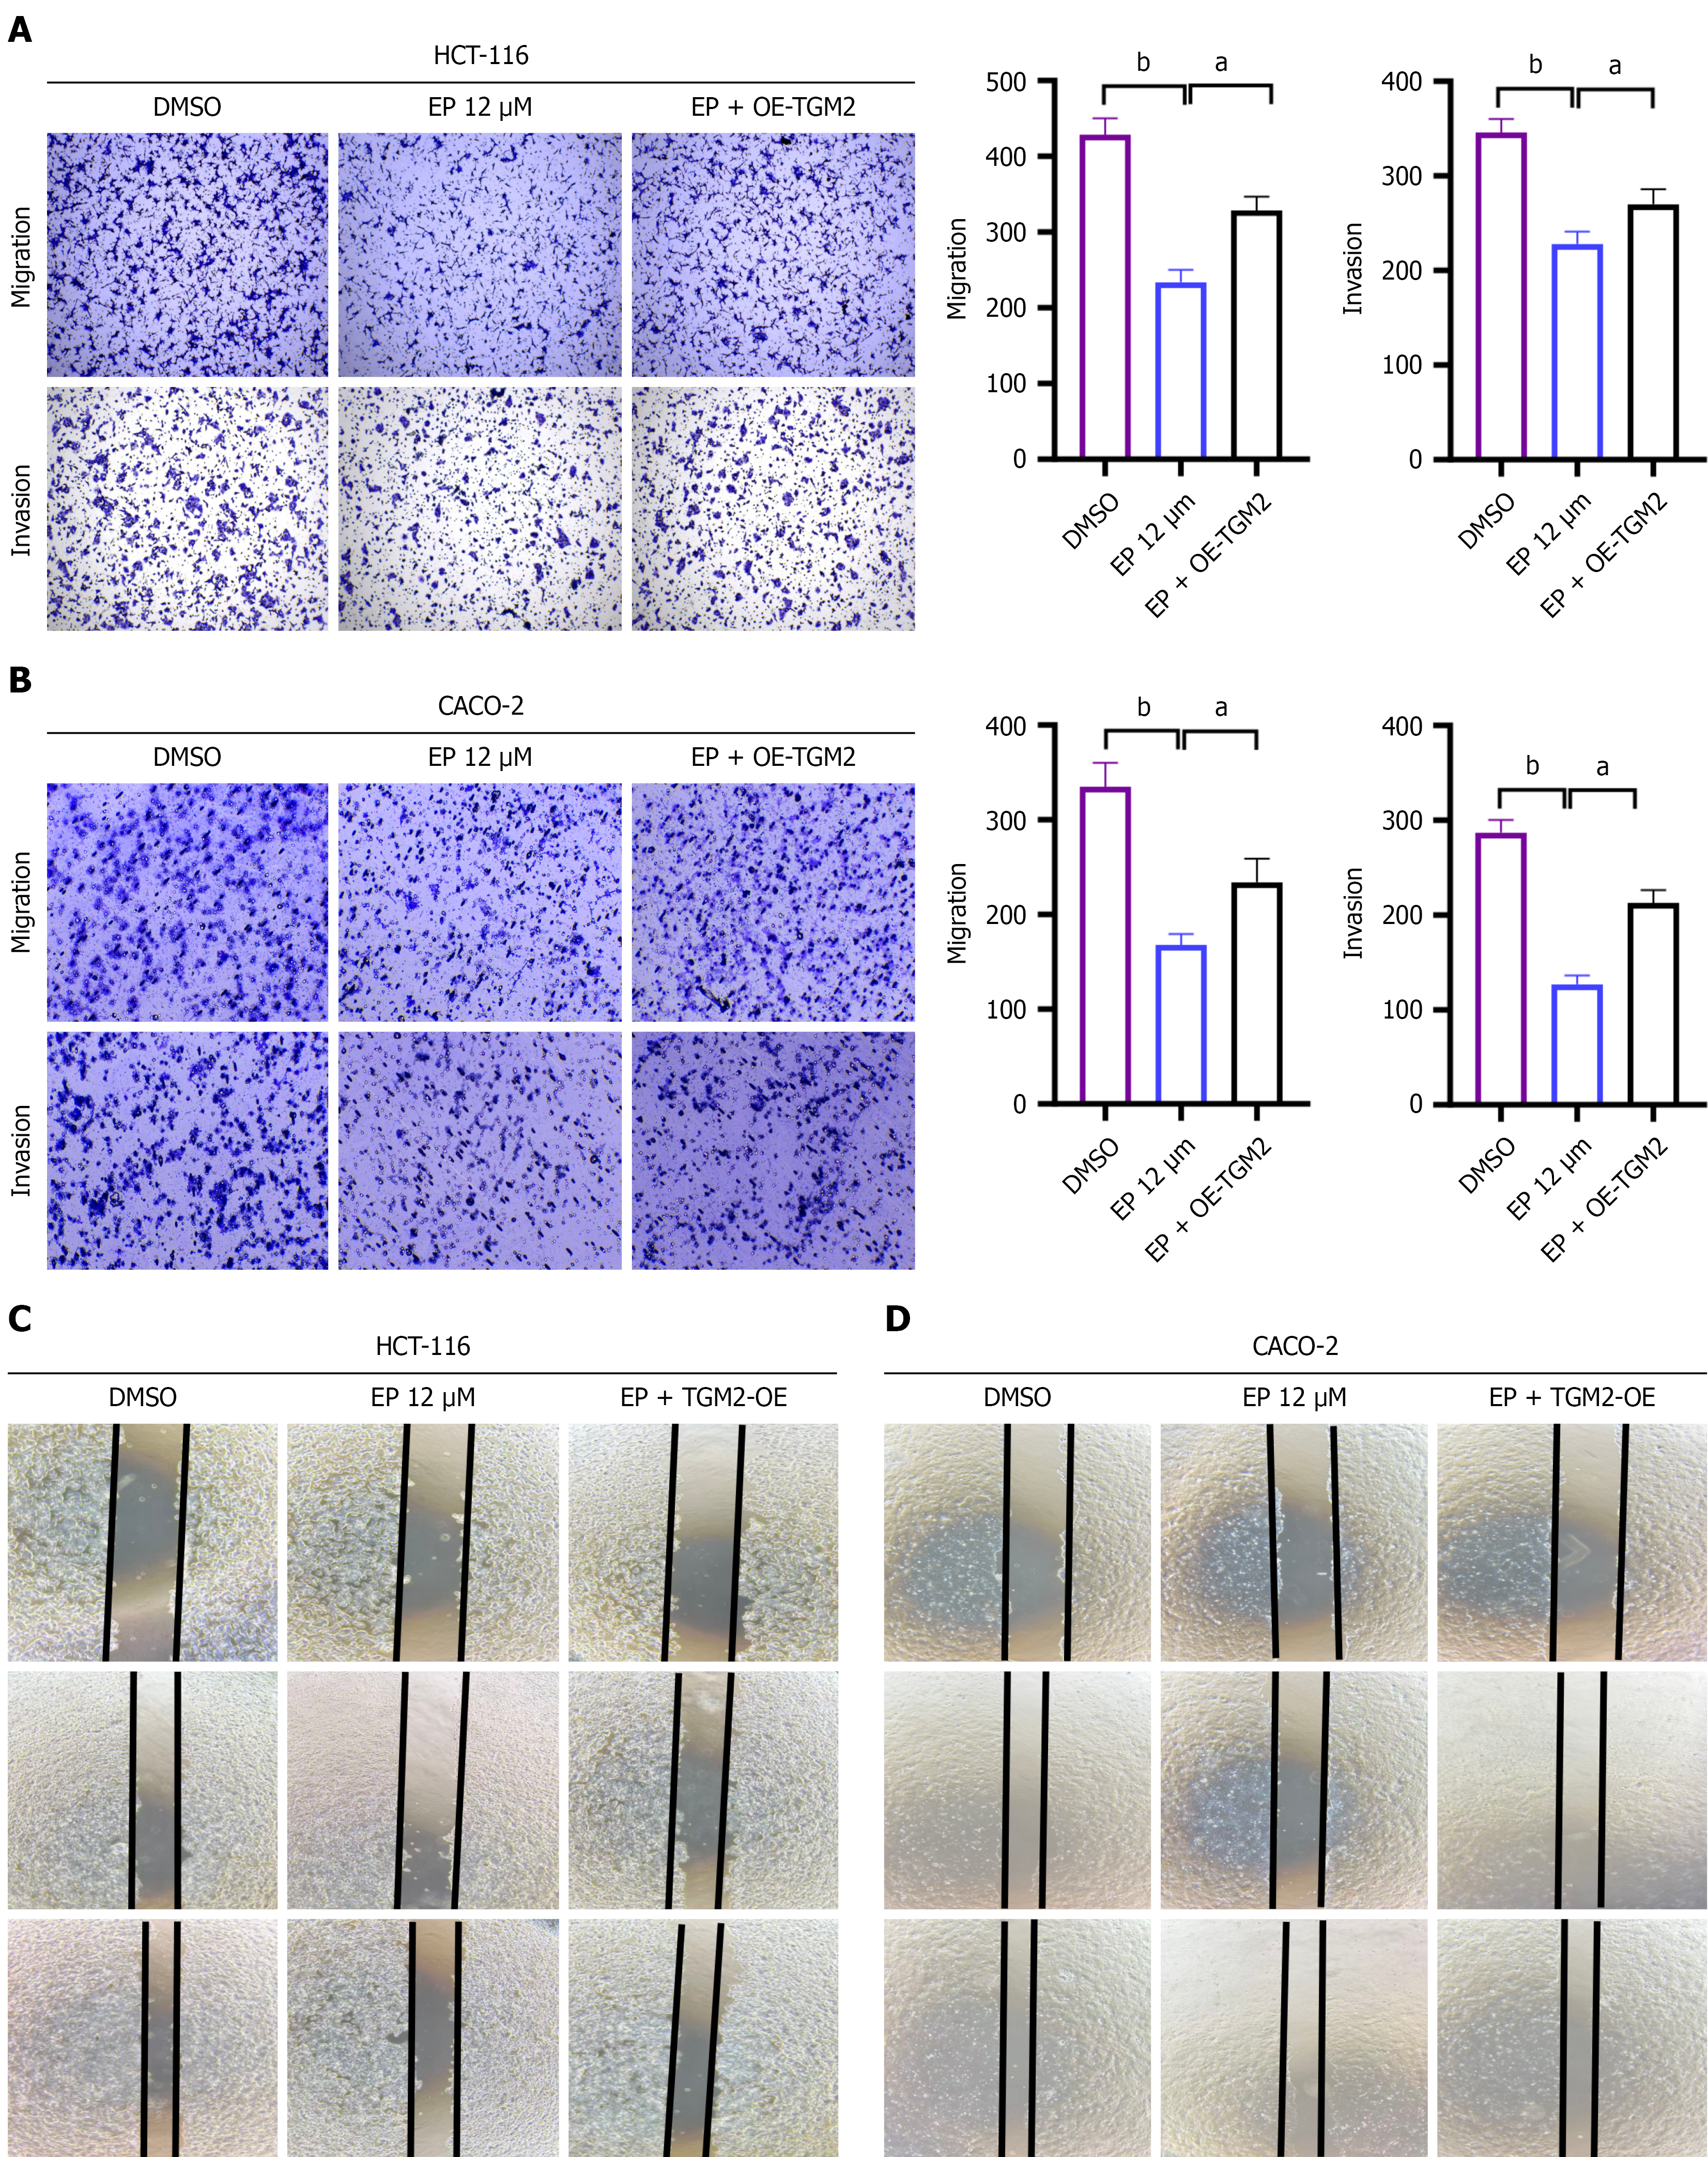
Figure 5 Transglutaminase 2 overexpression rescues EPZ020411-inhibited migration and invasion in colorectal cancer cells.
A and B: Transwell assays showing the migration and invasion of HCT116 (A) and CACO-2 (B) cells under the indicated treatments (control, EPZ020411, and EPZ020411 + transglutaminase 2 overexpression); C and D: Wound healing assays assessing the migratory ability of HCT116 (C) and CACO-2 (D) cells under the same treatment conditions. Data are presented as mean ± SD from three independent experiments (n = 3). Error bars represented the mean ± SEM. aP < 0.01, bP < 0.001. TGM2: Transglutaminase 2.
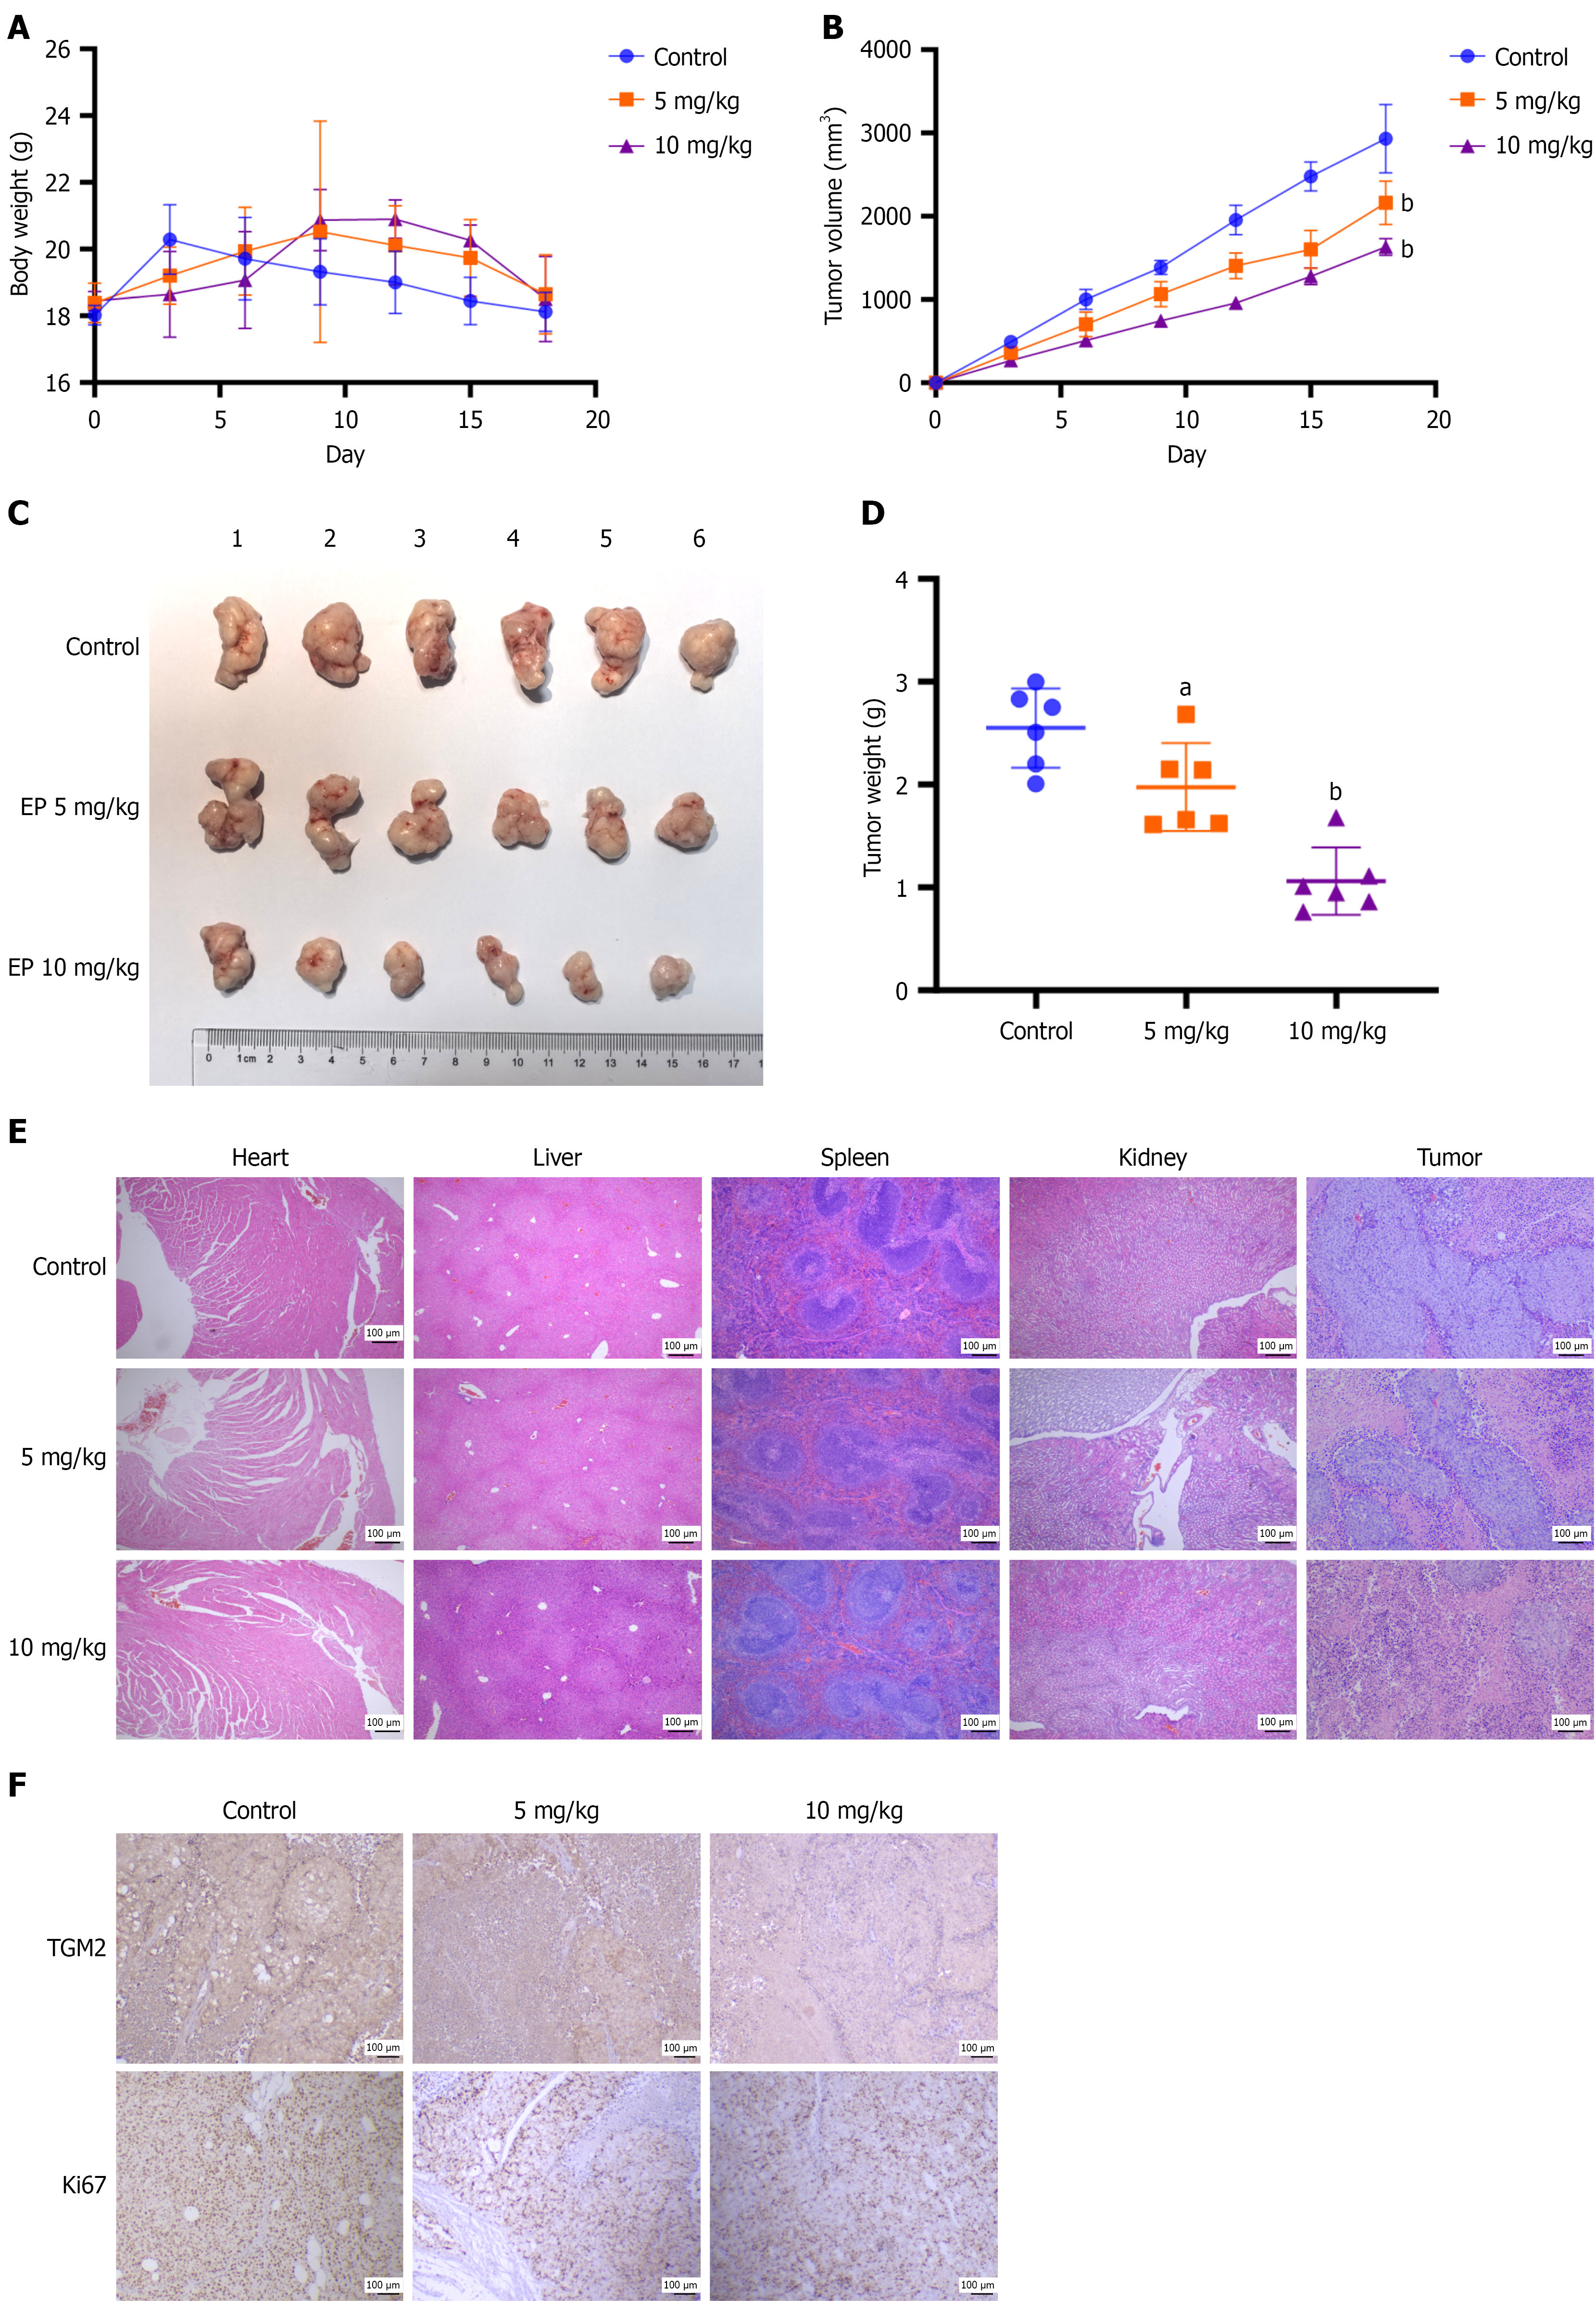
Figure 6 EPZ020411 inhibits the growth of colorectal cancer subcutaneous tumors and affects transglutaminase 2 expression.
A: Mice body weights; B-D: Tumor growth curves (B), representative images of excised tumors (C), and tumor weights (D); E: Representative hematoxylin and eosin staining images of organs. Original magnification (scale bar: 100 μm); F: Representative immunohistochemistry staining of transglutaminase 2 in subcutaneous tumors from EPZ020411-treated mice. Original magnification (scale bar: 100 μm). Error bars represented the mean ± SEM. aP < 0.01, bP < 0.001. TGM2: Transglutaminase 2.
- Citation: Chen YZ, Liu J, Wang YP, Du J, Ma JC, Jin GS. EPZ020411, a PRMT6 inhibitor, suppresses colorectal cancer cell proliferation, migration, and invasion through targeting the TGM2/MAPK axis. World J Gastrointest Oncol 2026; 18(9): 123745
- URL: https://www.wjgnet.com/1948-5204/full/v18/i9/123745.htm
- DOI: https://dx.doi.org/10.4251/wjgo.123745