
















Copyright: ©Author(s) 2026.
World J Gastrointest Oncol. Oct 15, 2026; 18(10): 121827
Published online Oct 15, 2026. doi: 10.4251/wjgo.121827
Published online Oct 15, 2026. doi: 10.4251/wjgo.121827
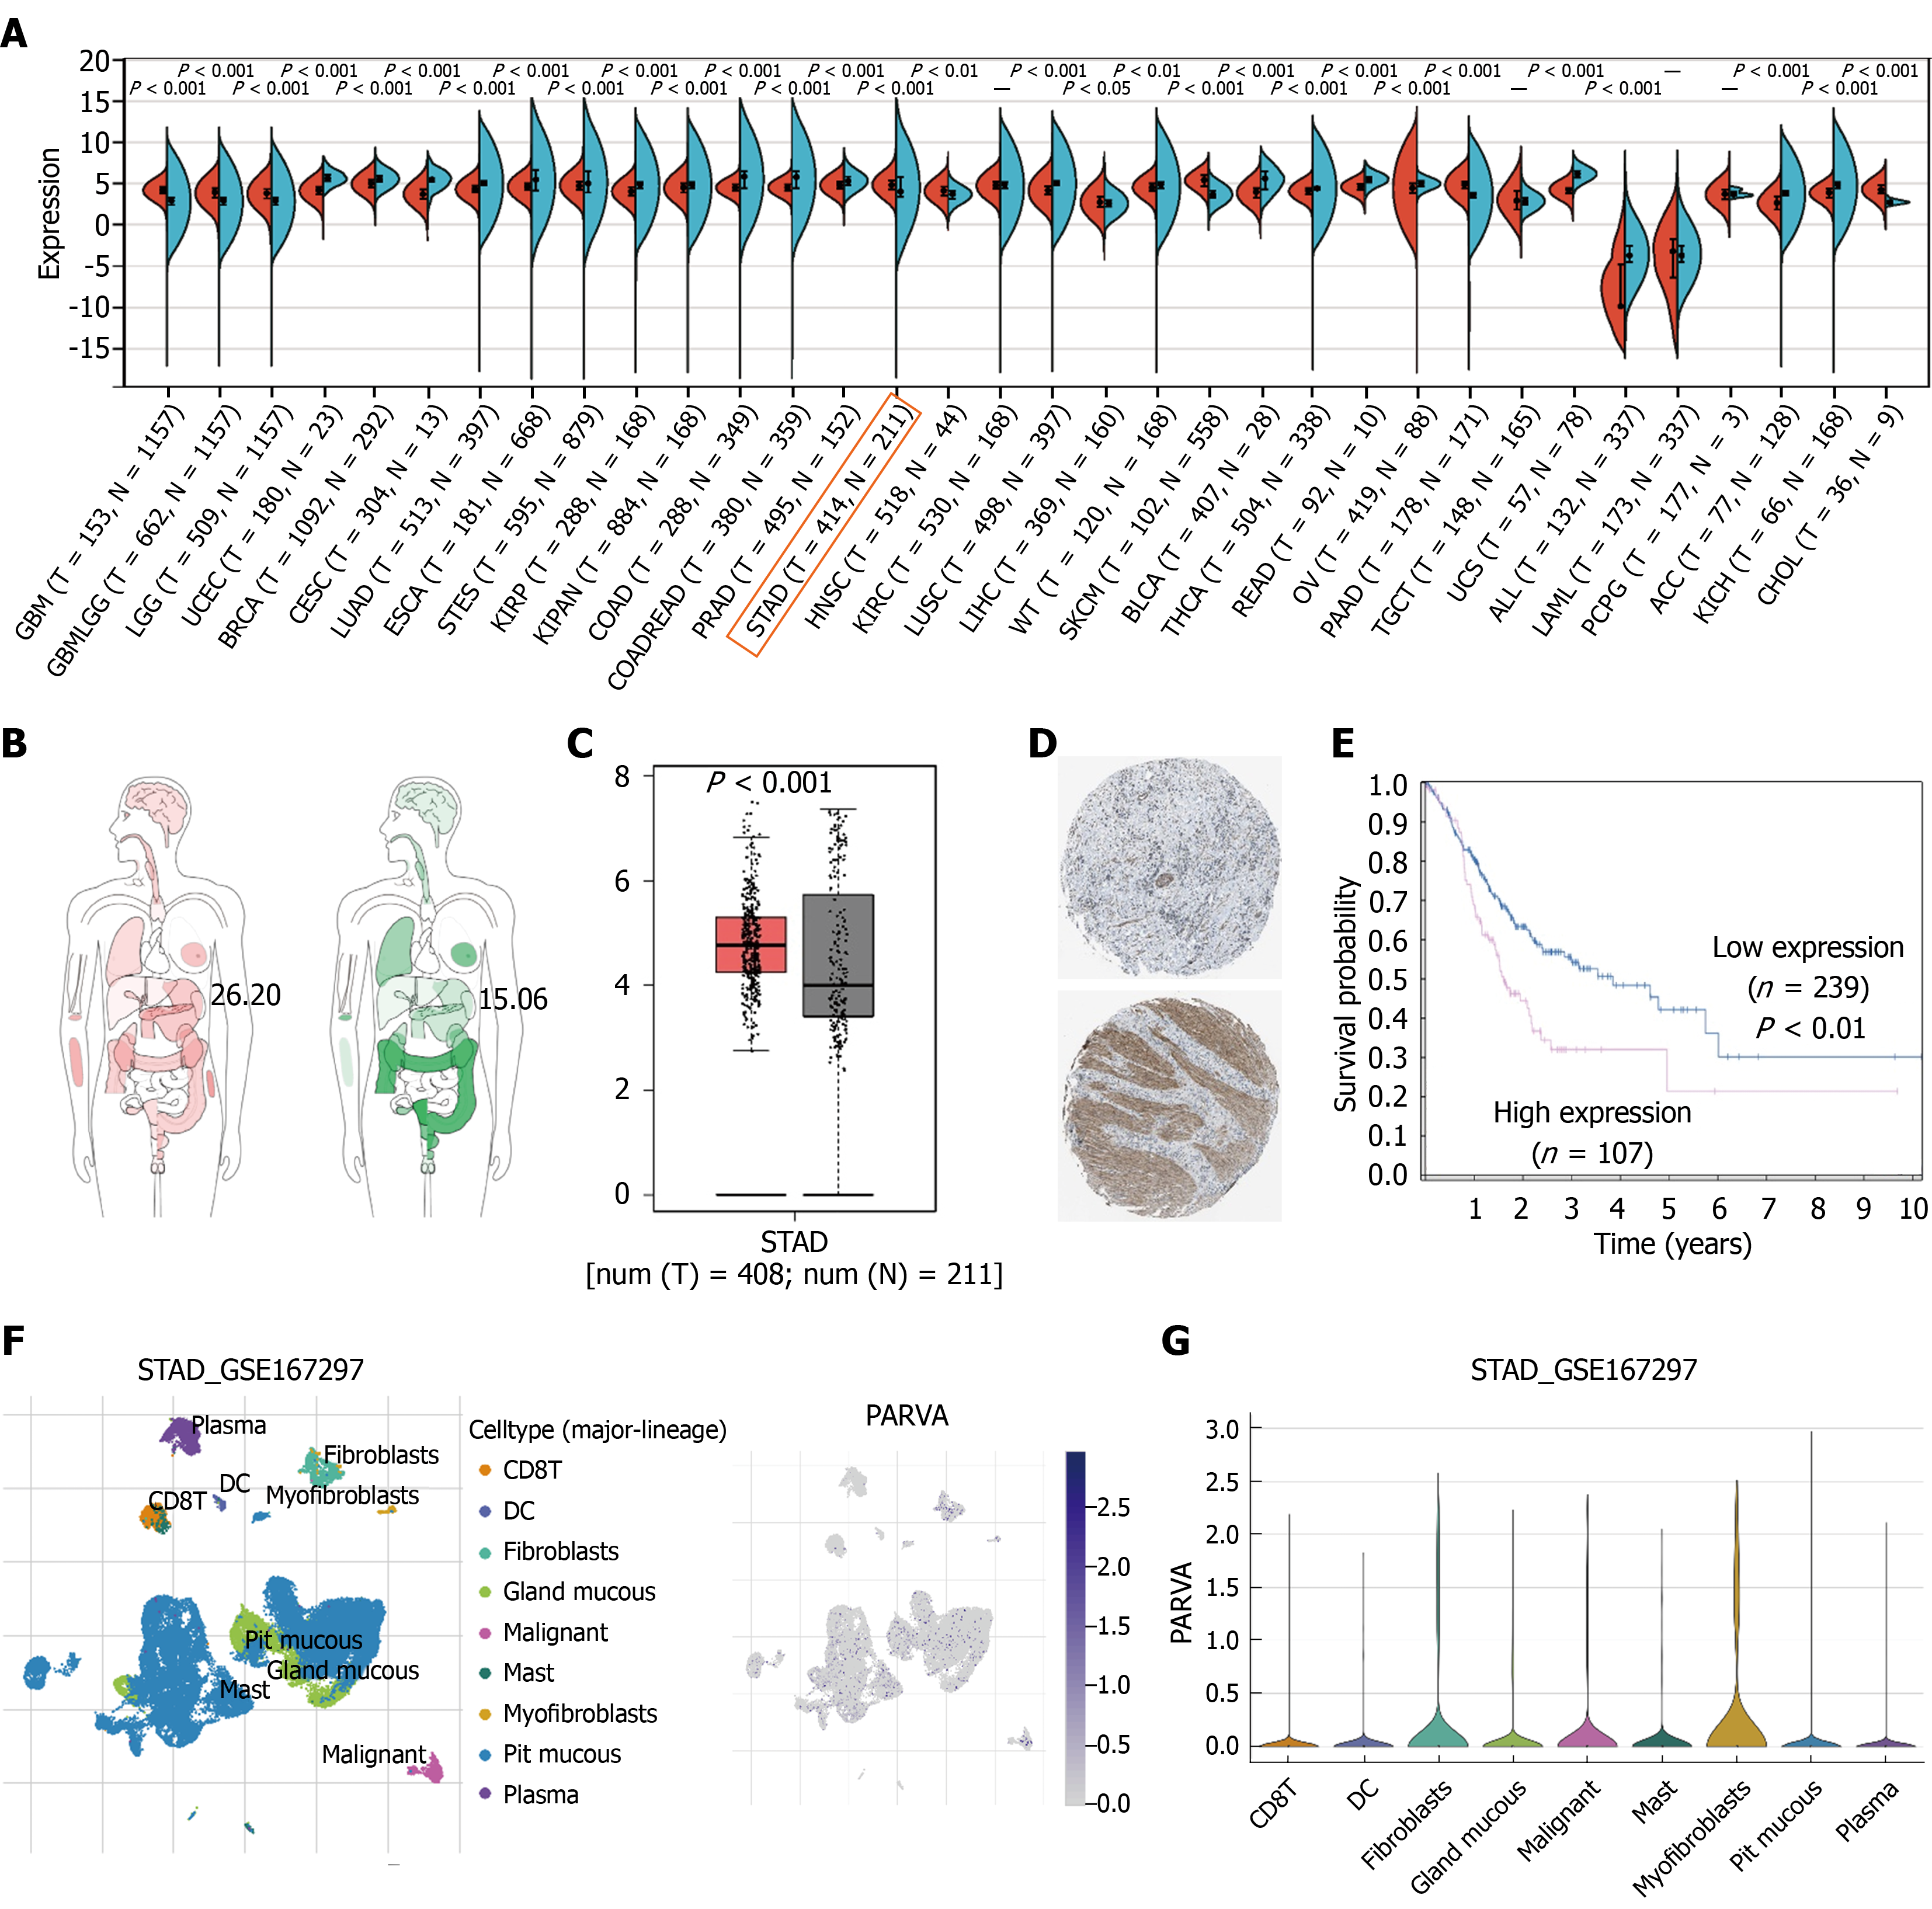
Figure 1 Public database and single-cell transcriptomic analyses of PARVA in gastric cancer.
A: Pan-cancer differential expression analysis in Sangerbox 3.0; B: Overall distribution of PARVA expression in normal and tumor tissues; C: PARVA expression in gastric cancer and normal gastric tissues in GEPIA; D: Representative immunohistochemical staining of PARVA in gastric cancer tissues from THPA; E: Survival analysis of PARVA in gastric cancer from THPA; F: Single-cell transcriptomic analysis of the STAD_GSE134520 dataset from TISCH, showing cell-type annotation and PARVA feature plot; G: Distribution of PARVA expression across different cell types in STAD_GSE134520. CD8T: Cytotoxic T lymphocyte; DC: Dendritic cells.
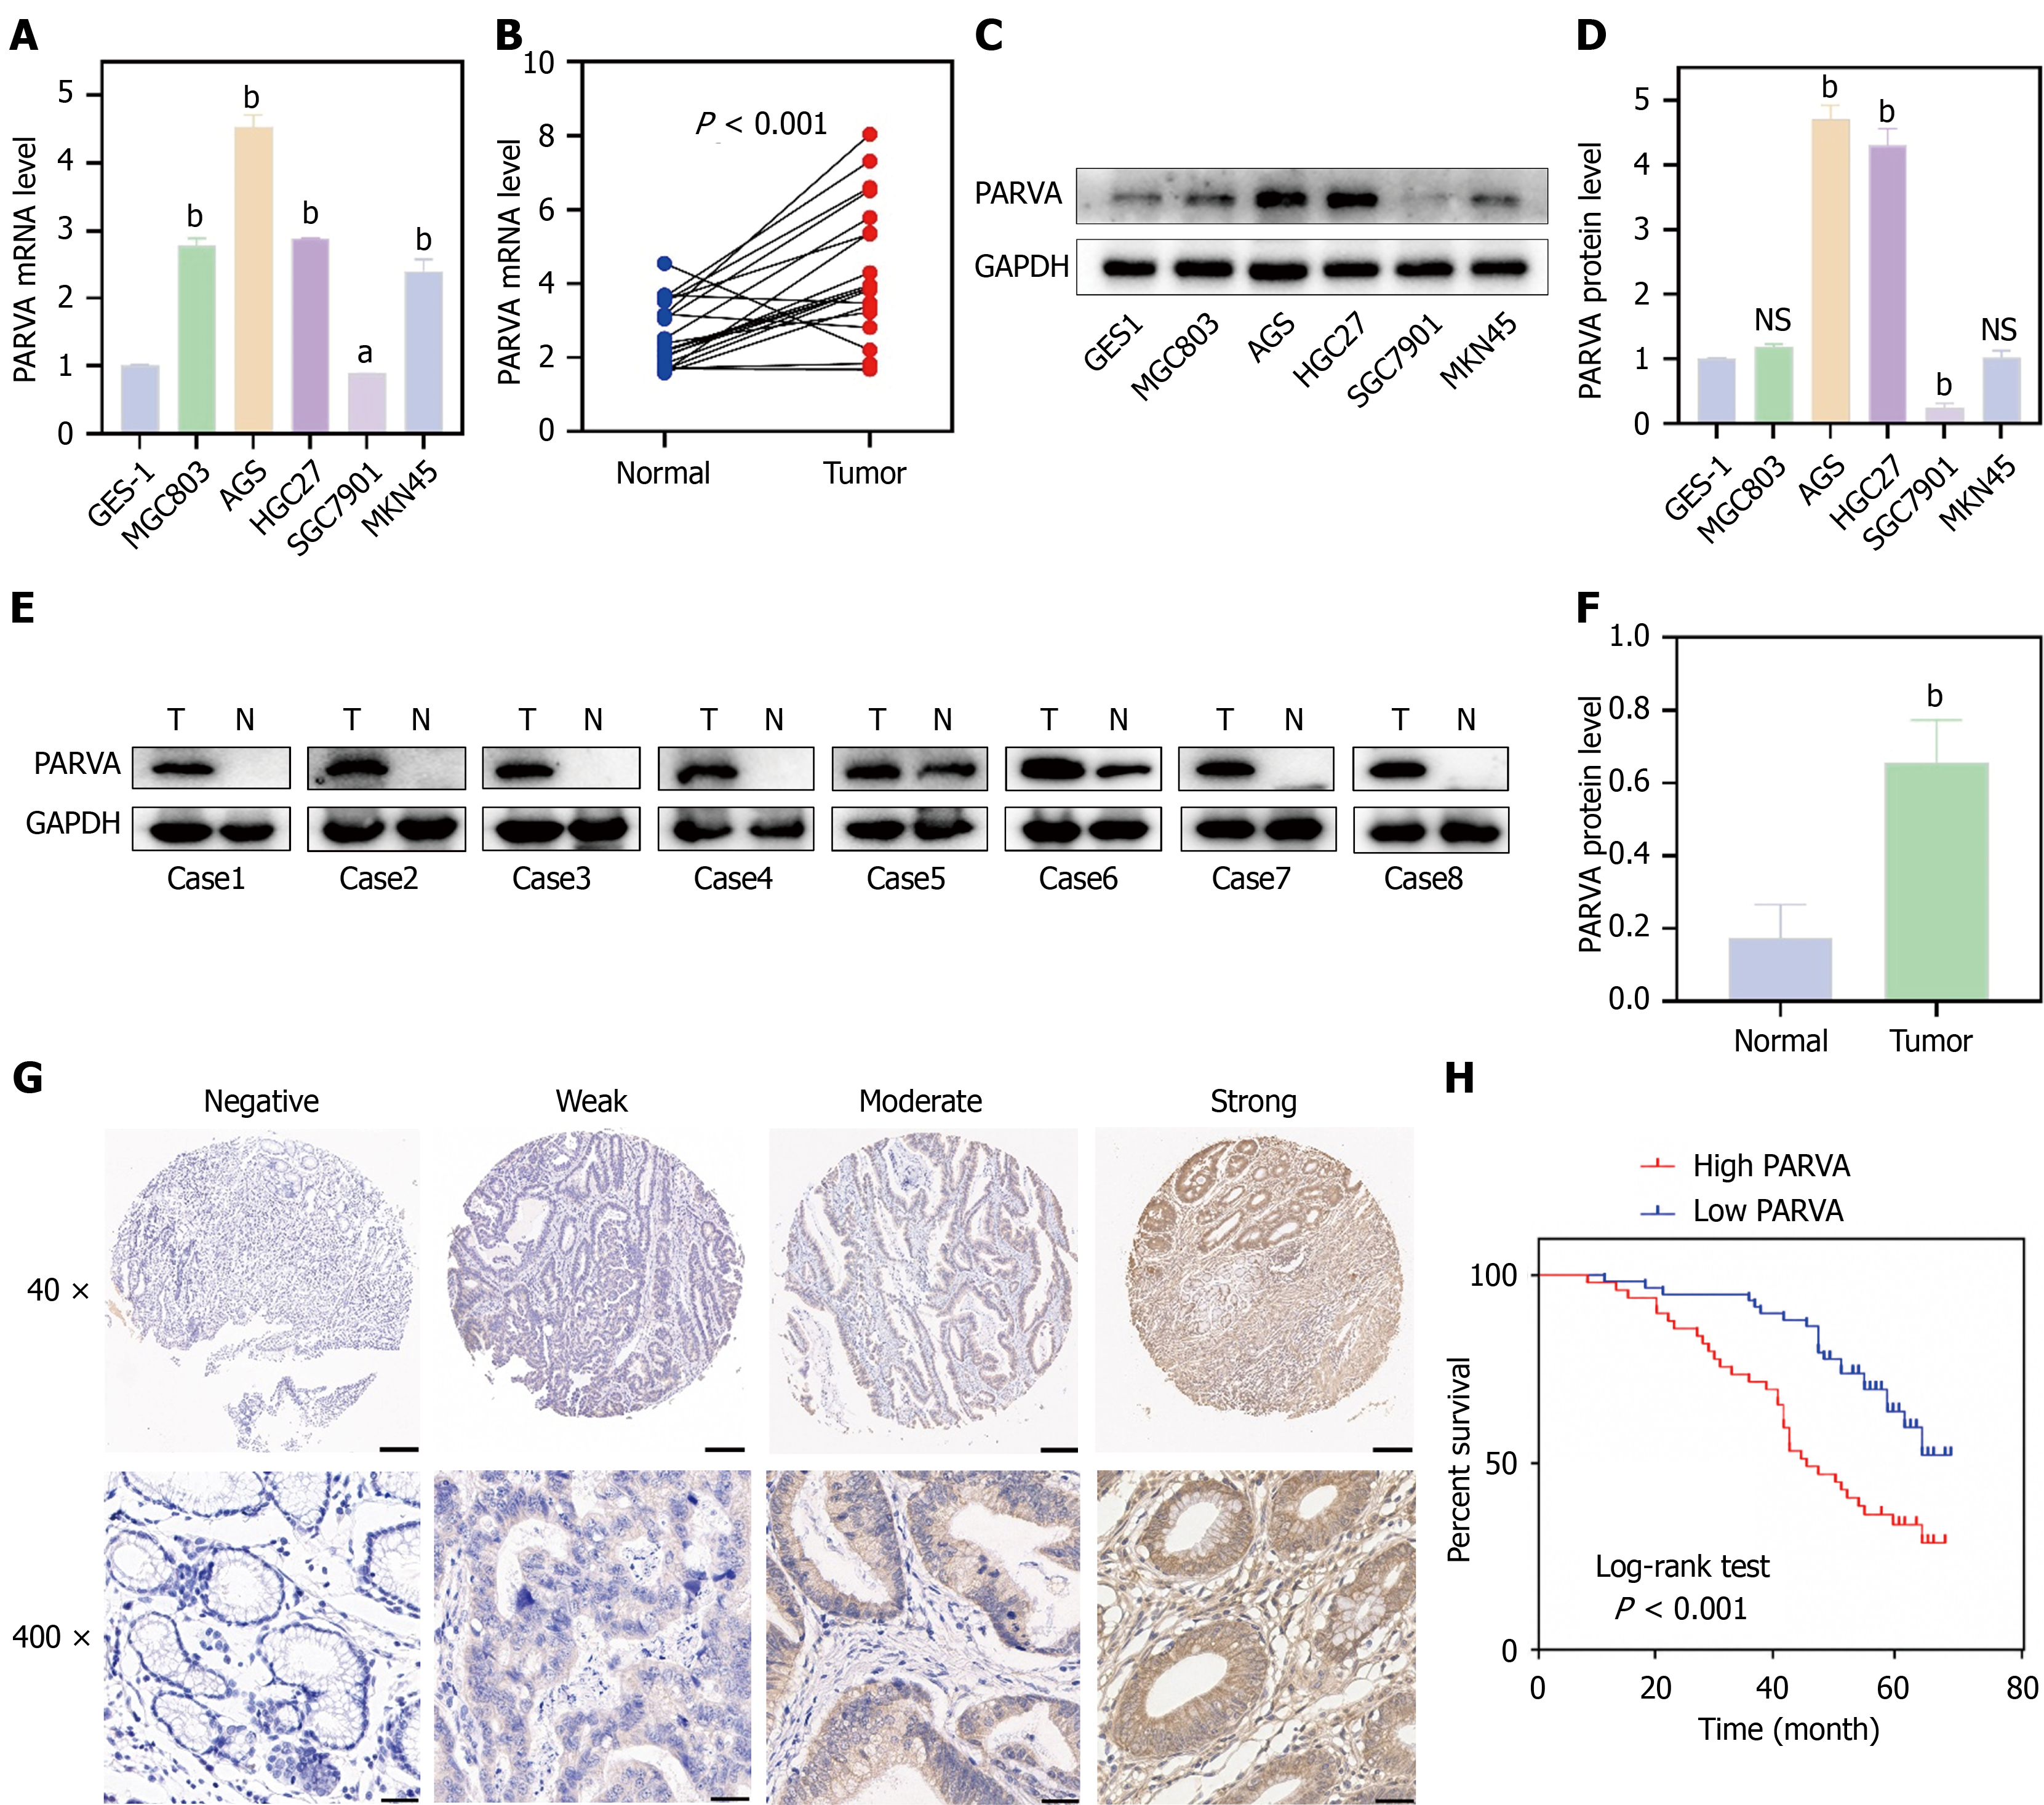
Figure 2 Expression pattern of PARVA in gastric cancer cell lines and tissues and its prognostic significance.
A: The quantitative real-time PCR (qRT-PCR) analysis of PARVA mRNA expression in GES-1 and gastric cancer cell lines; B: The qRT-PCR analysis of PARVA mRNA expression in gastric cancer tissues and paired adjacent tissues; C: Western blot analysis of PARVA protein expression in GES-1 and gastric cancer cell lines; D: Densitometric analysis of the Western blot bands shown in panel C; E: Western blot analysis of PARVA protein expression in gastric cancer tissues and paired adjacent tissues; F: Densitometric analysis of the Western blot bands shown in panel E; G: Representative immunohistochemical staining showing negative, weak, moderate, and strong PARVA expression in gastric cancer tissues; H: Kaplan-Meier survival analysis according to PARVA expression. Statistical comparisons were made against GES-1 or normal tissues, as indicated. Scale bars: 200 μm for 40 × images and 50 μm for 400 × images in panel G. aP < 0.05; bP < 0.001. NS: Not significant.
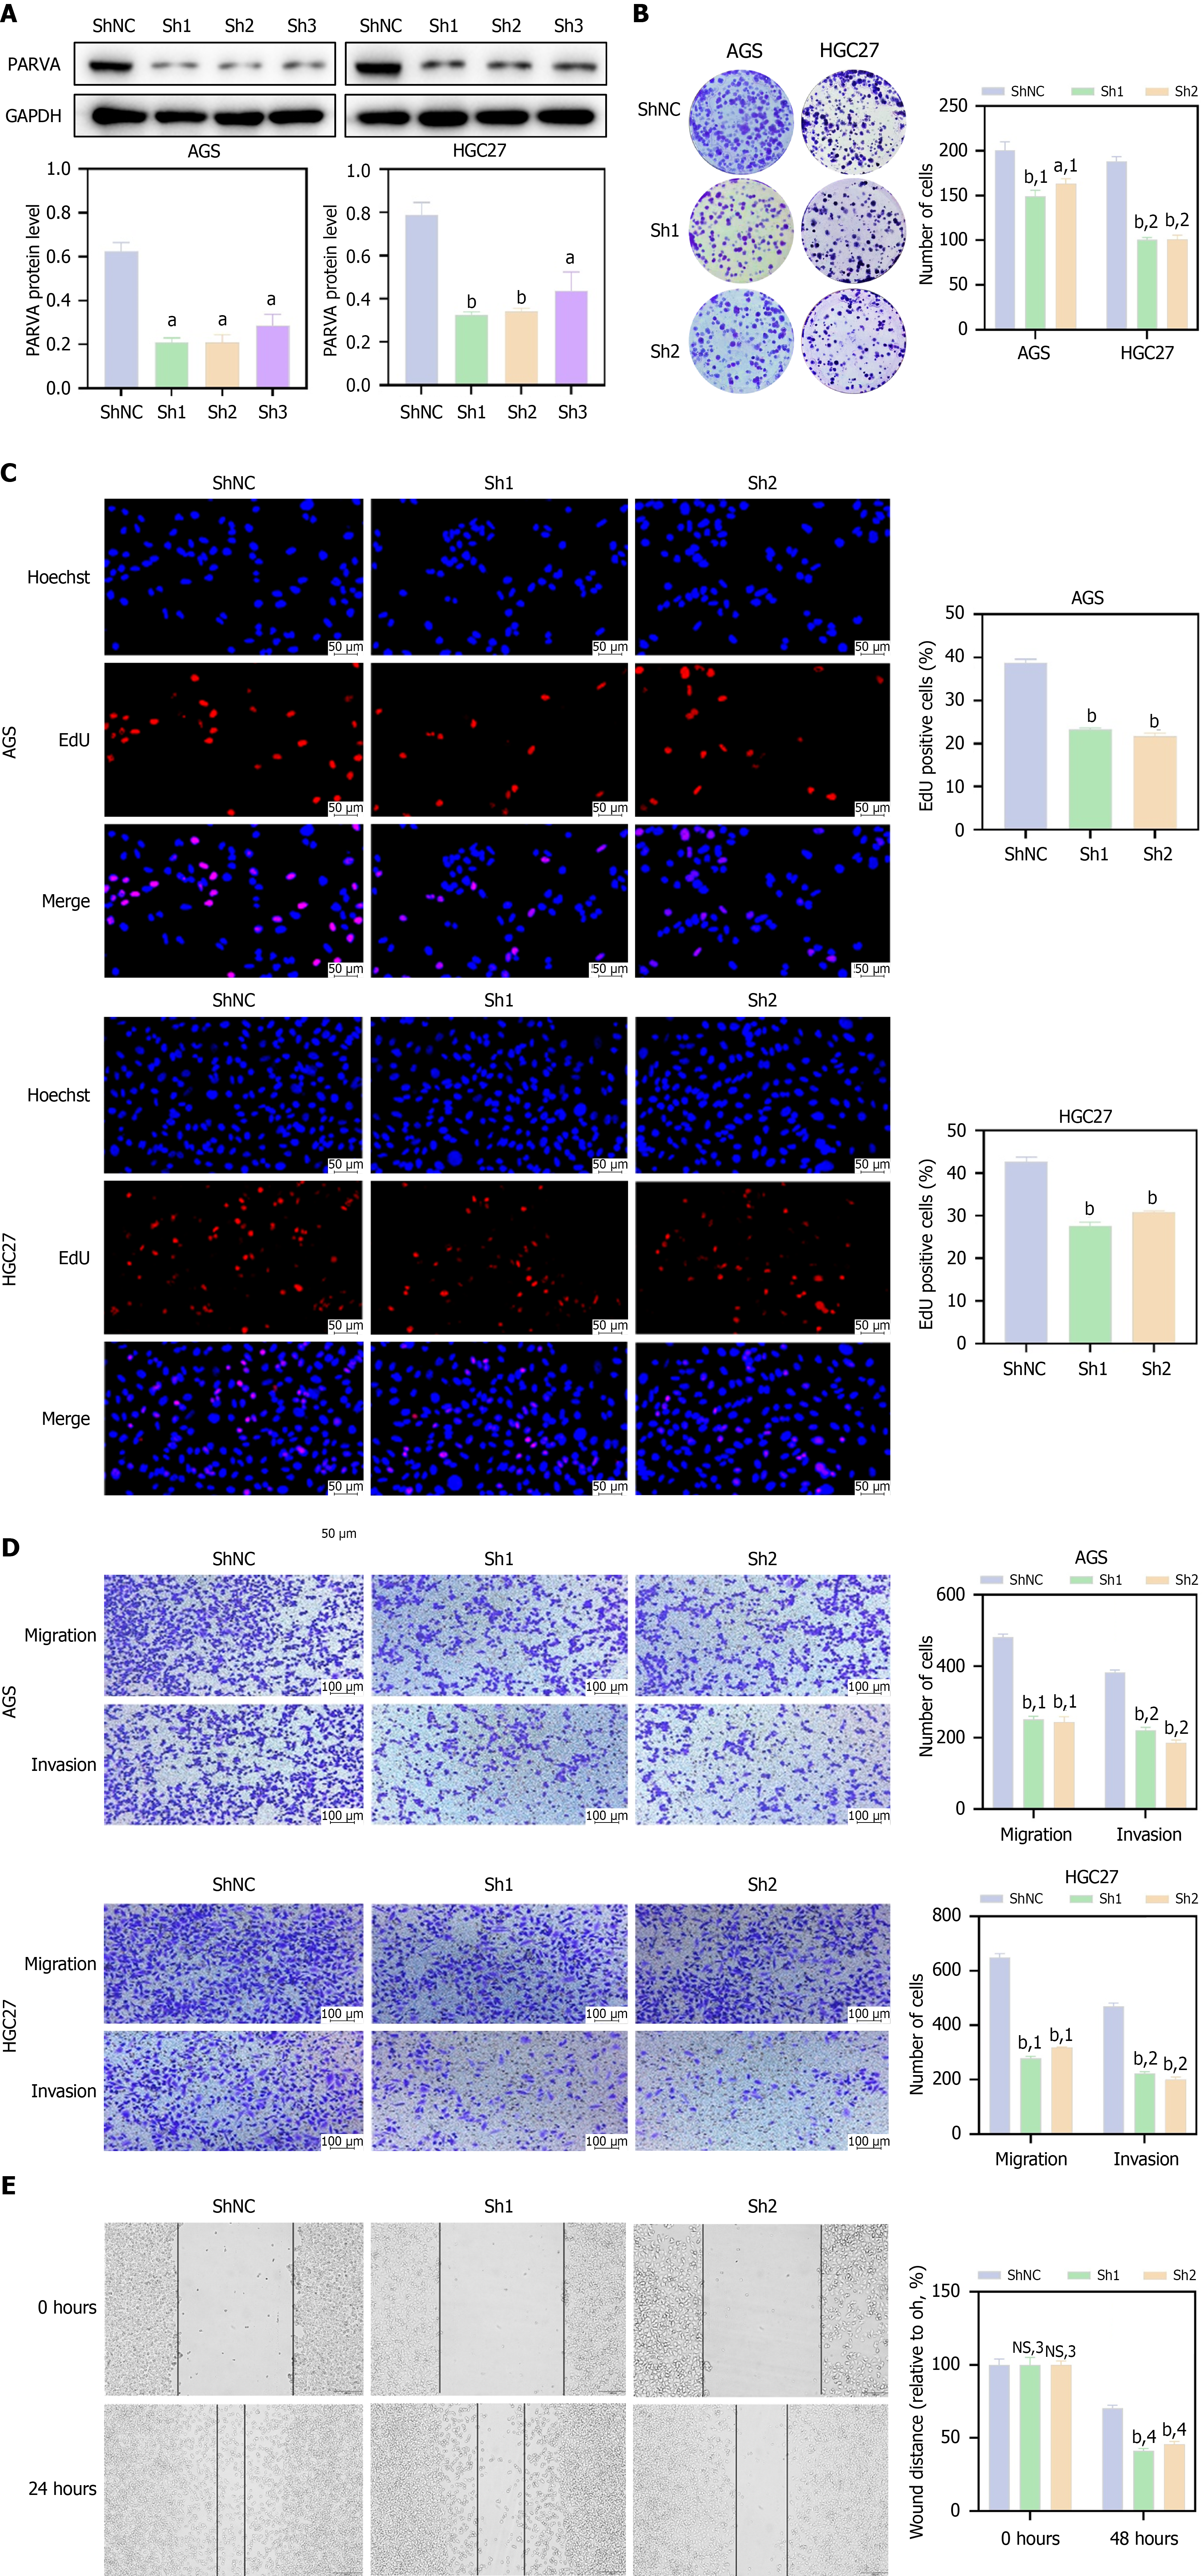
Figure 3 PARVA knockdown suppressed the proliferation, migration, and invasion of gastric cancer cells.
A: Western blot analysis of PARVA knockdown efficiency in AGS and HGC27 cells, with densitometric analysis; B: Colony formation assays with quantification of colony numbers; C: EdU assays with quantification of EdU-positive cells; D: Transwell migration and invasion assays with quantification; E: Wound-healing assays with quantification of wound closure. When followed by a numeral, the comparison refers to the corresponding control within the indicated subgroup. aP < 0.01; bP < 0.001; 1Comparison within the migration subgroup; 2Comparison within the invasion subgroup; 3Comparison within the 0 hours subgroup; 4Comparison within the 48 hours subgroup. NS: Not significant; NC: Negative control.
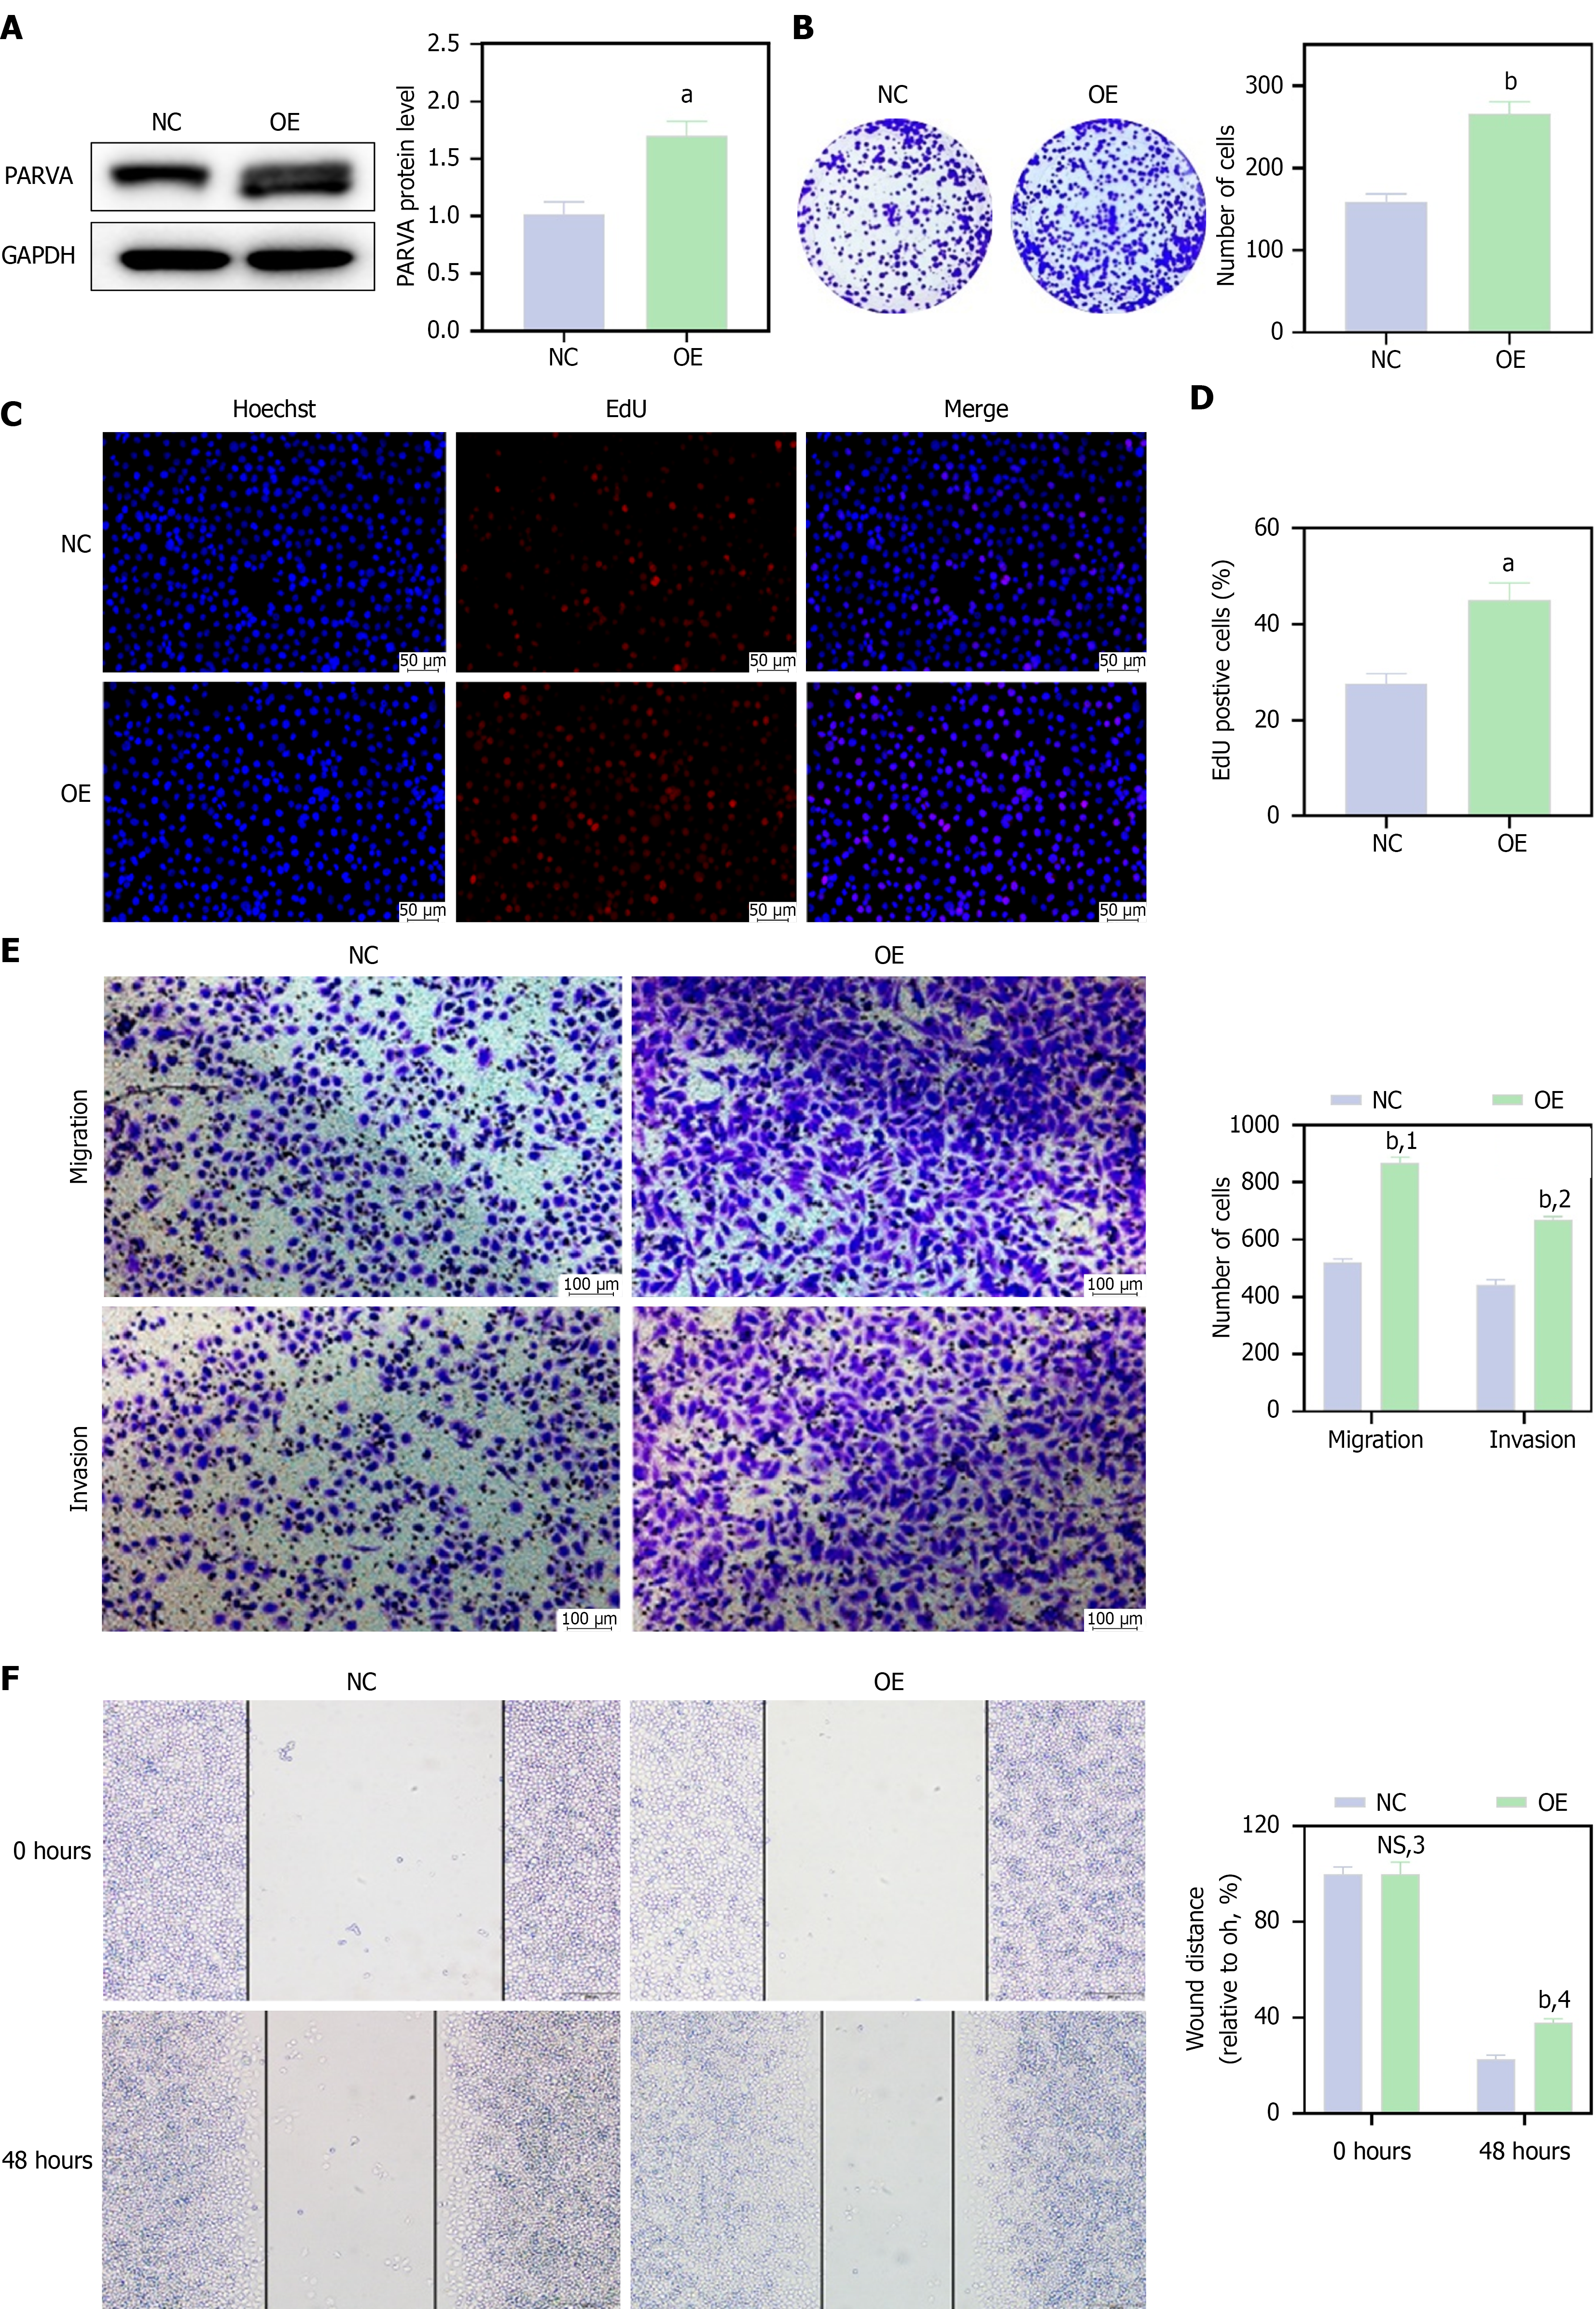
Figure 4 PARVA overexpression promoted the proliferation, migration, and invasion of gastric cancer cells.
A: Western blot analysis of PARVA overexpression efficiency in SGC7901 cells, with densitometric analysis; B: Colony formation assays with quantification of colony numbers; C: EdU assays; D: Quantification of EdU-positive cells; E: Transwell migration and invasion assays with quantification; F: Wound-healing assays with quantification of wound closure. When followed by a numeral, the comparison refers to the corresponding control within the indicated subgroup. respectively. aP < 0.01. bP < 0.001; 1Comparison within the migration subgroup; 2Comparison within the invasion subgroup; 3Comparison within the 0 hour subgroup; 4Comparison within the 48 hours subgroup. NS: Not significant; NC: Negative control; OE: Overexpression.
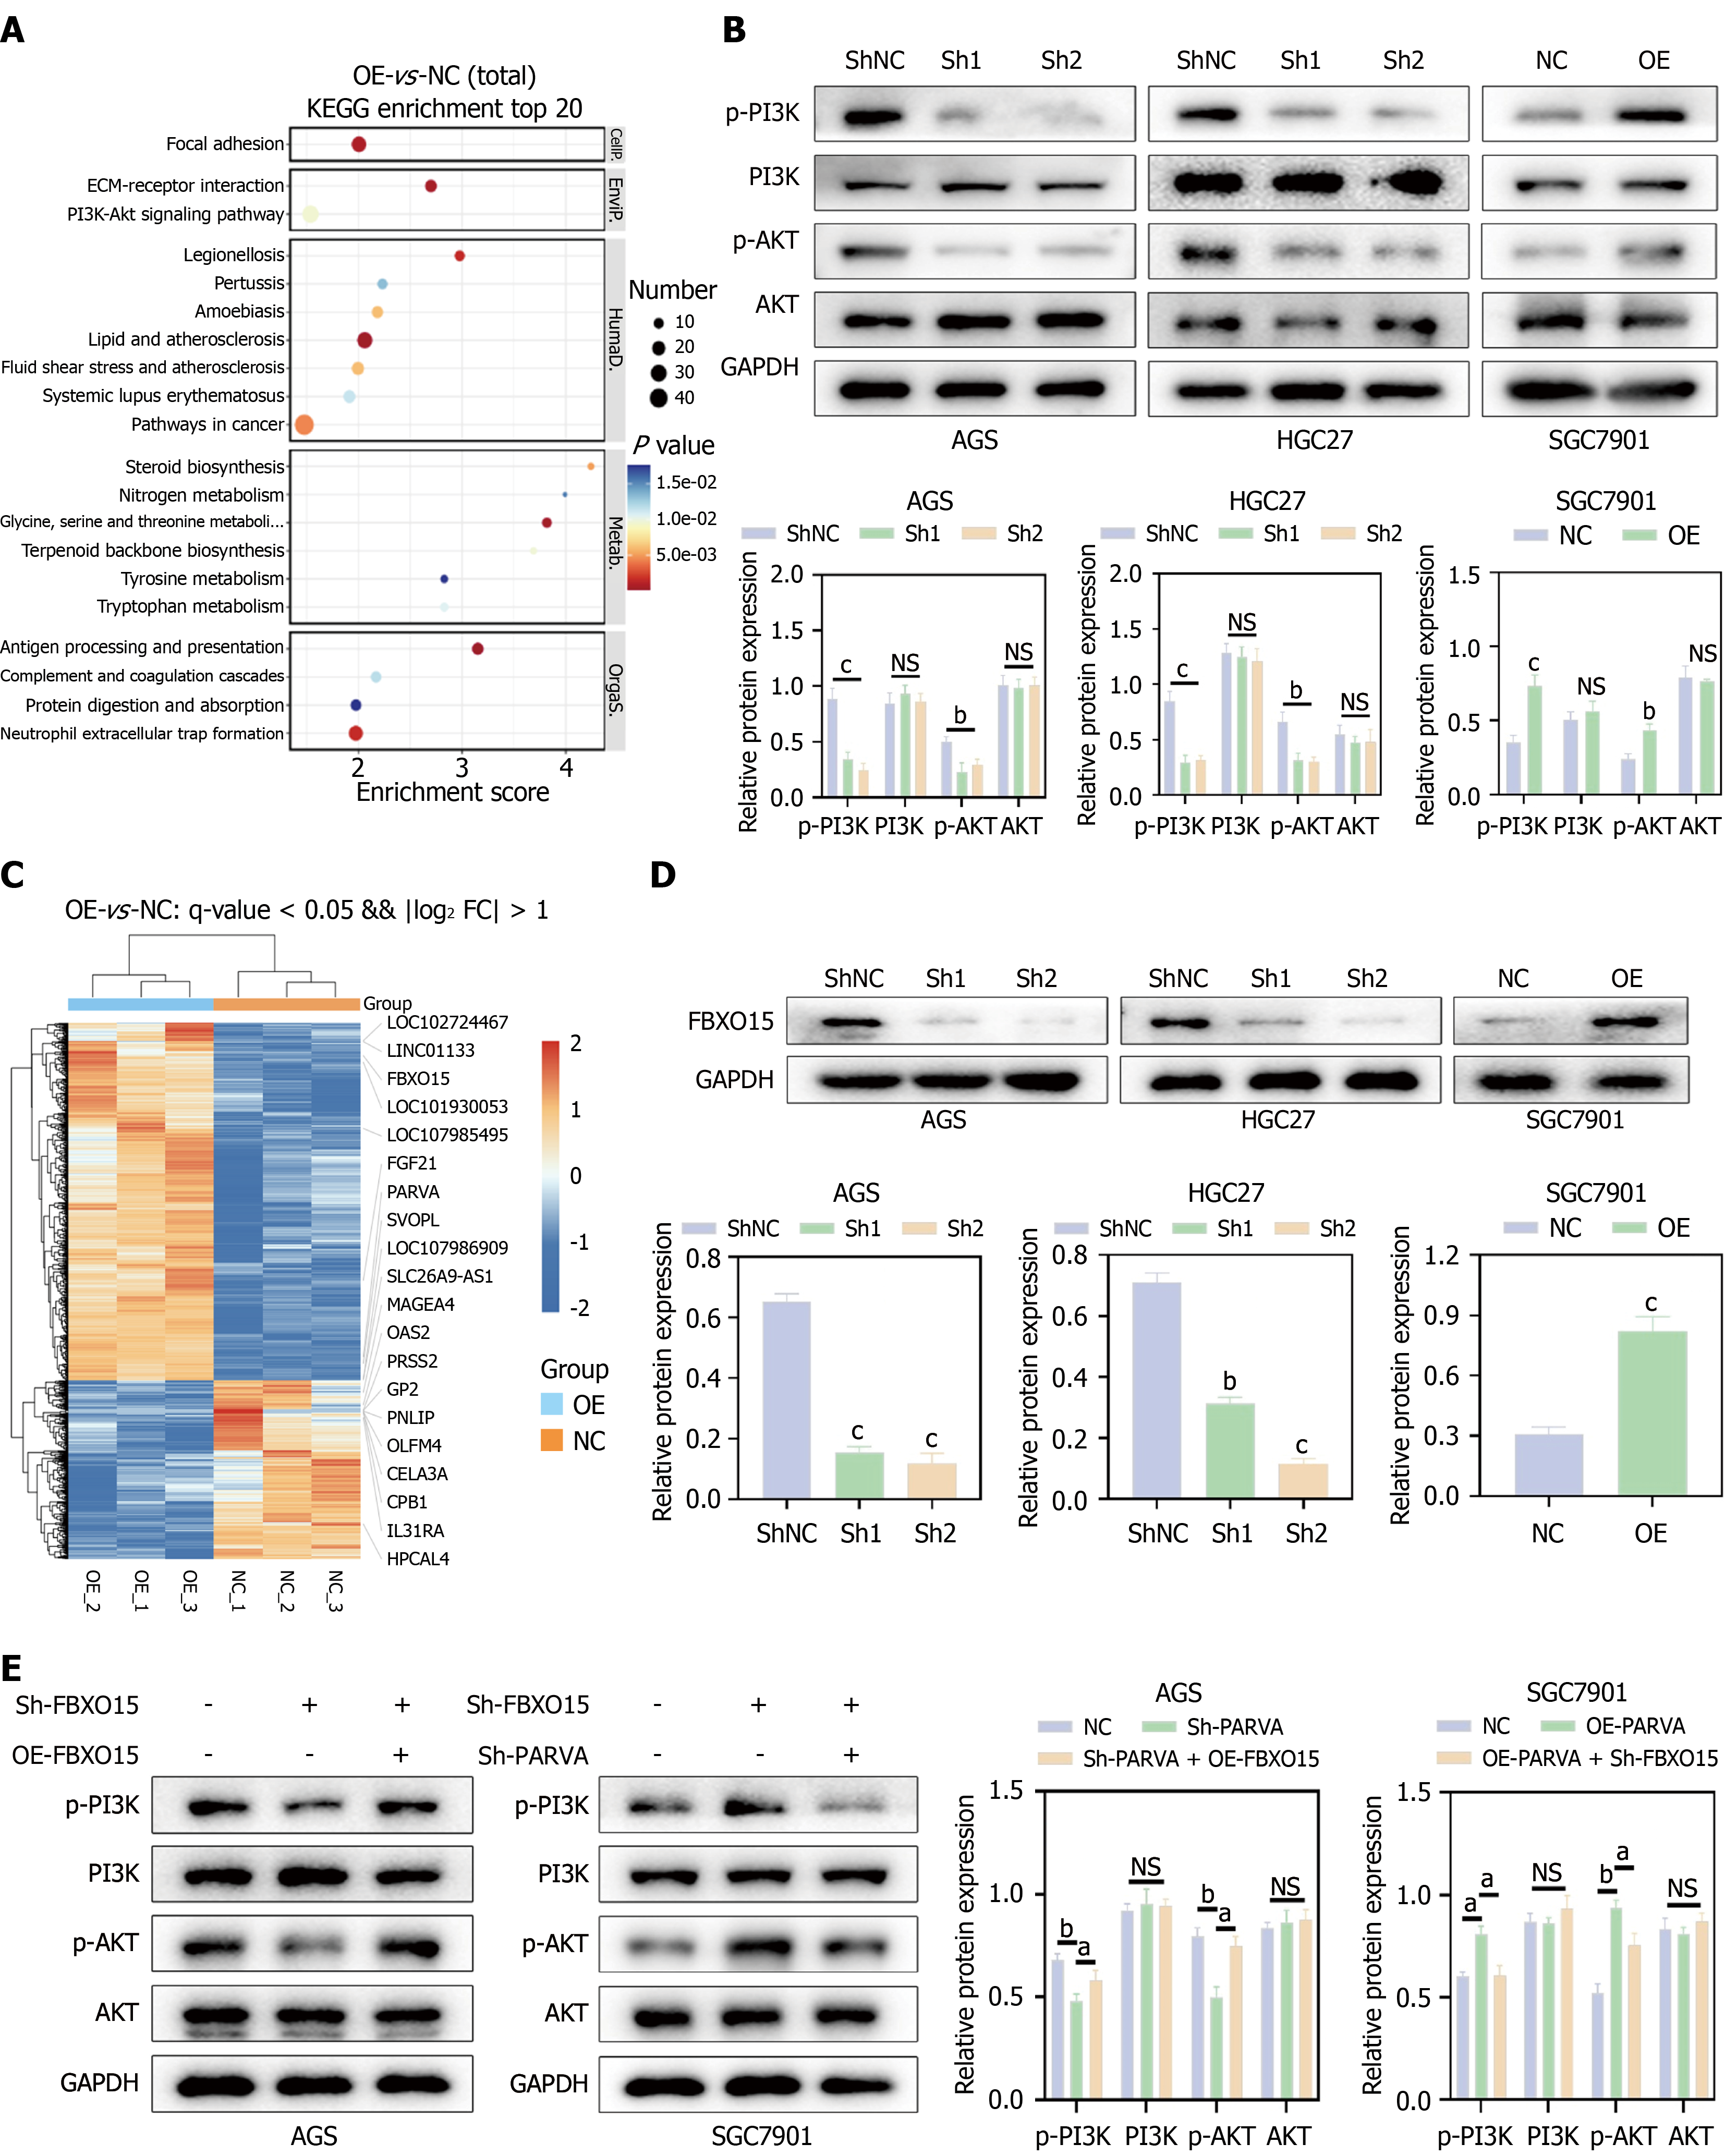
Figure 5 PARVA was associated with FBXO15 expression and PI3K/AKT signaling in gastric cancer cells.
A: Kyoto Encyclopedia of Genes and Genomes enrichment analysis of differentially expressed genes after PARVA knockdown; B: Western blot analysis of PI3K, p-PI3K, AKT, and p-AKT expression after PARVA knockdown or overexpression, with densitometric analysis; C: Heatmap of representative differentially expressed genes; D: Western blot analysis of FBXO15 expression after PARVA knockdown or overexpression, with quantification; E: Rescue experiments showing the involvement of FBXO15 in PARVA-mediated regulation of PI3K/AKT signaling. aP < 0.05; bP < 0.01; cP < 0.001. NS: Not significant; NC: Negative control; OE: Overexpression.
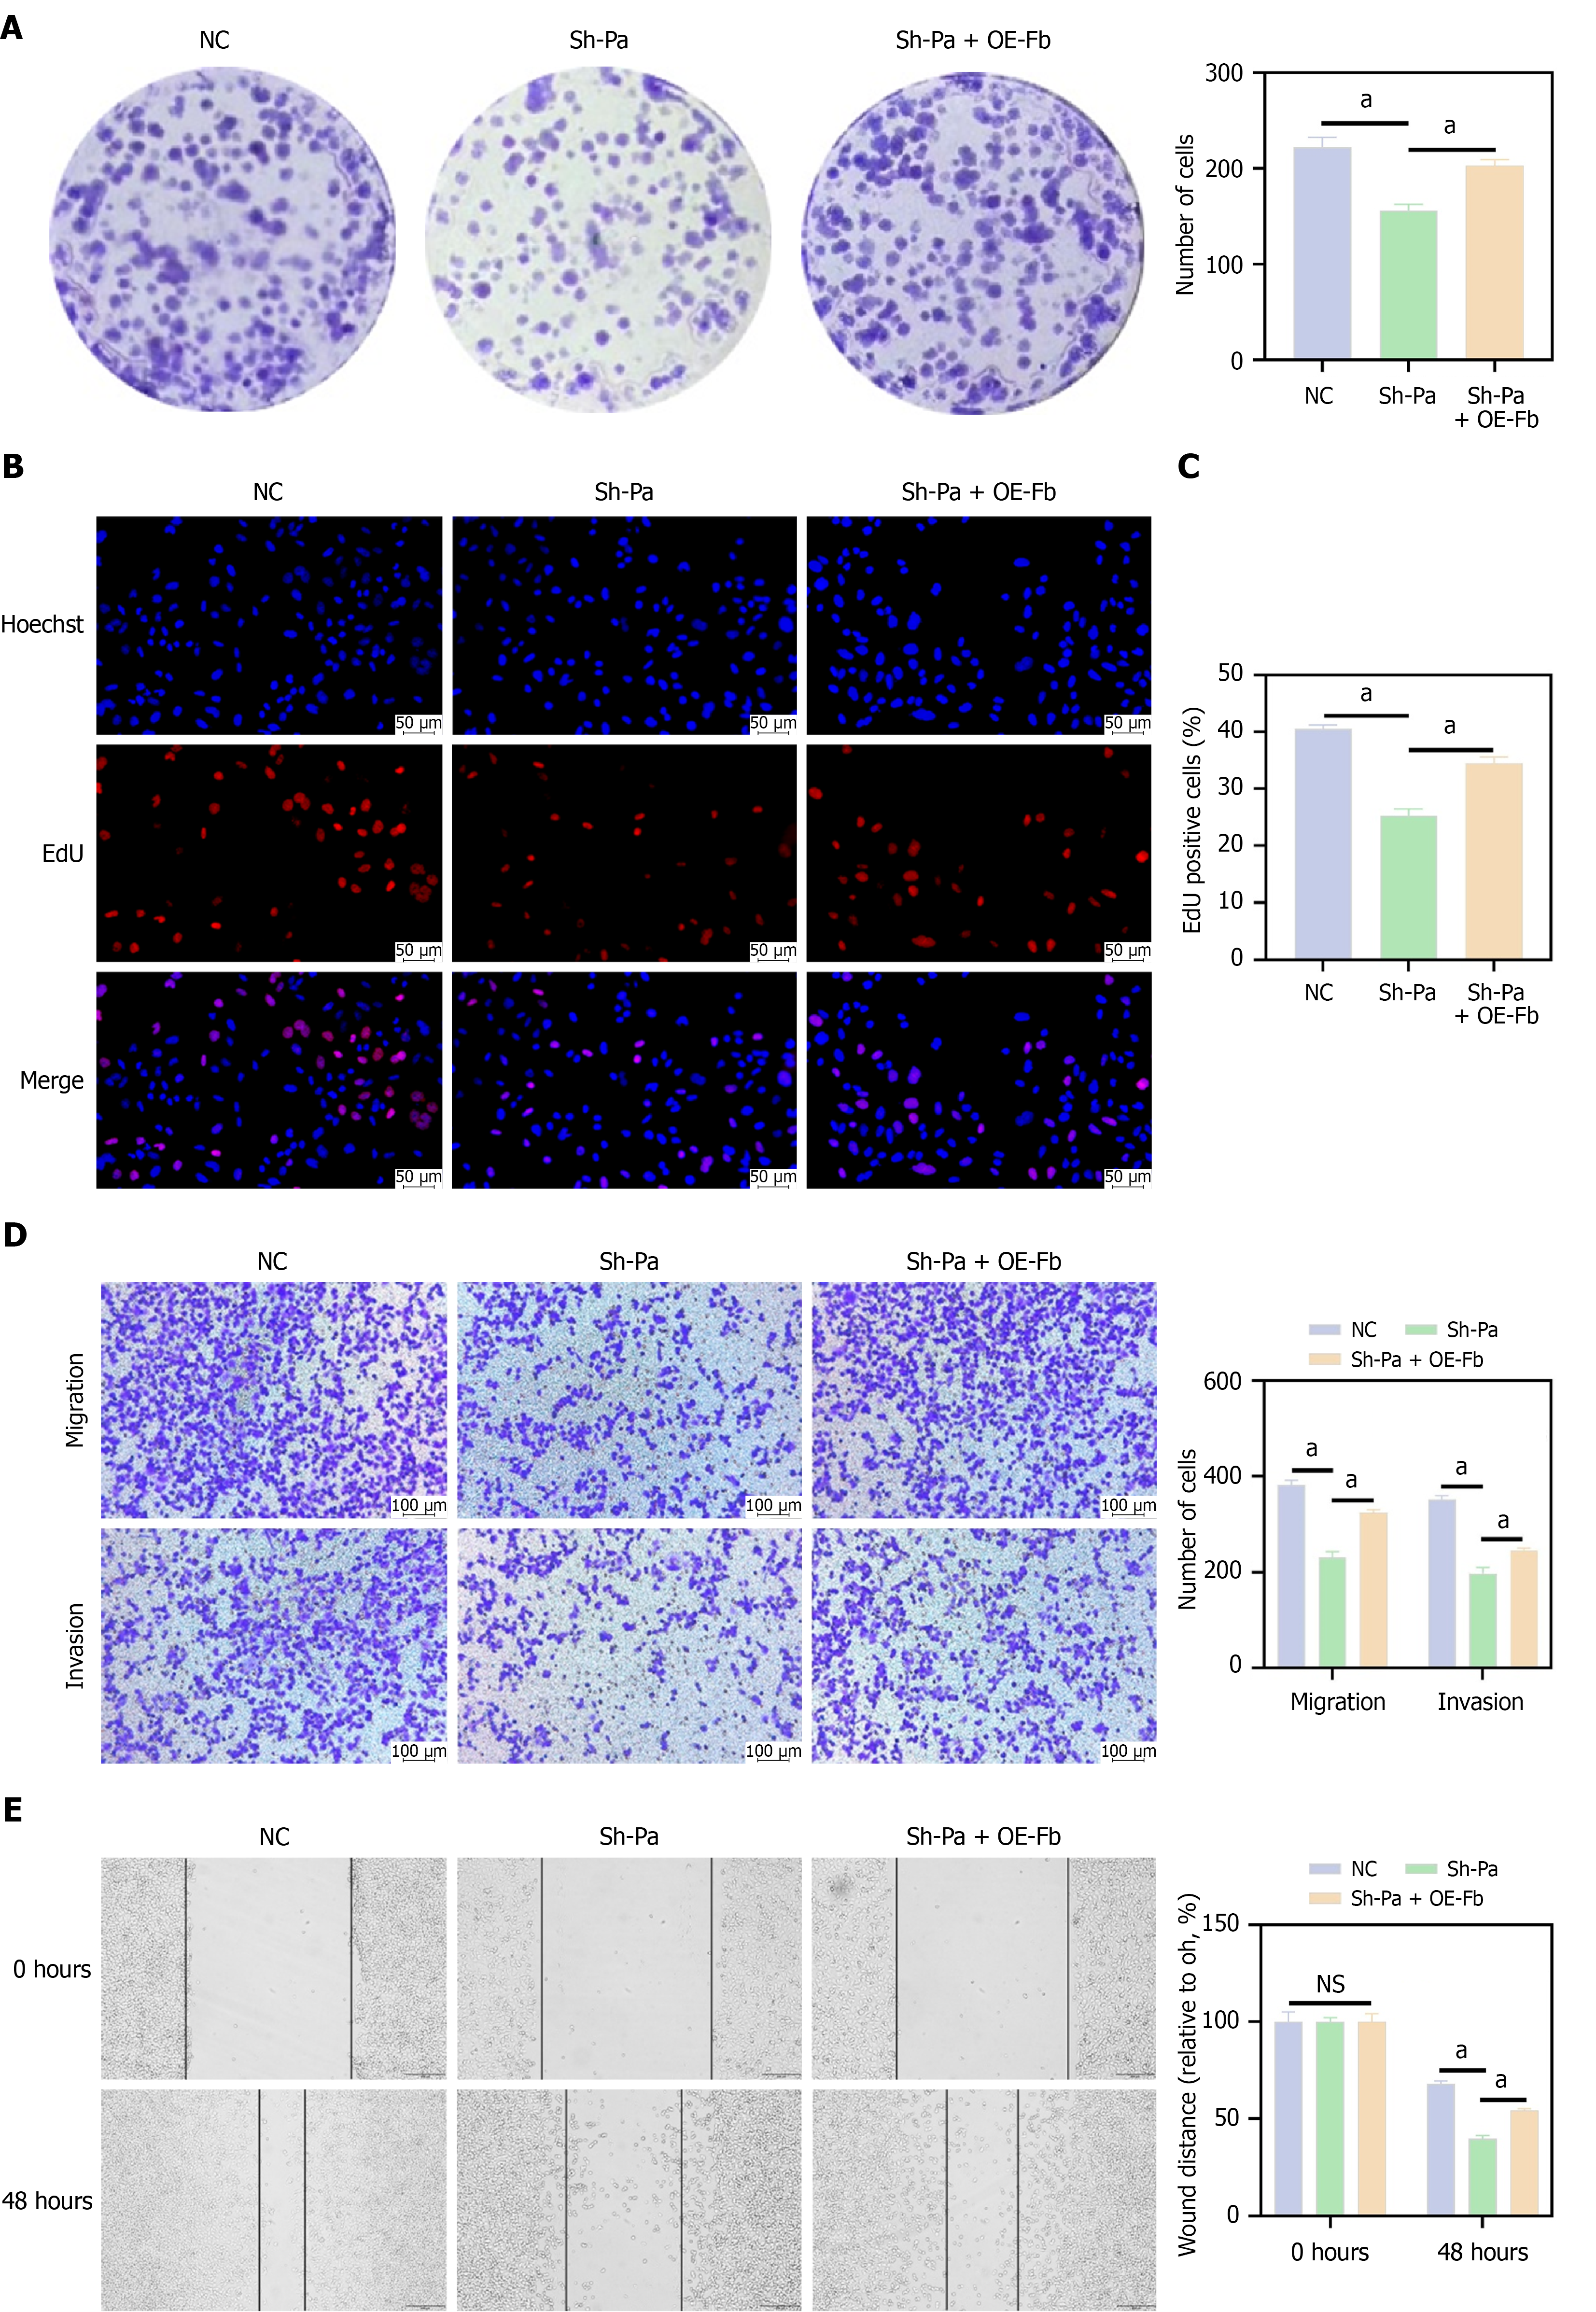
Figure 6 FBXO15 partially reversed the inhibitory effects of PARVA knockdown on malignant phenotypes of gastric cancer cells.
A: Colony formation assays with quantification; B: EdU staining images after FBXO15 overexpression in PARVA-silenced cells; C: Quantification of EdU-positive cells; D: Transwell migration and invasion assays with quantification; E: Wound-healing assays with quantification of wound closure. aP < 0.001. NS: Not significant; Pa: PARVA; Fb: FBXO15; OE: Overexpression.
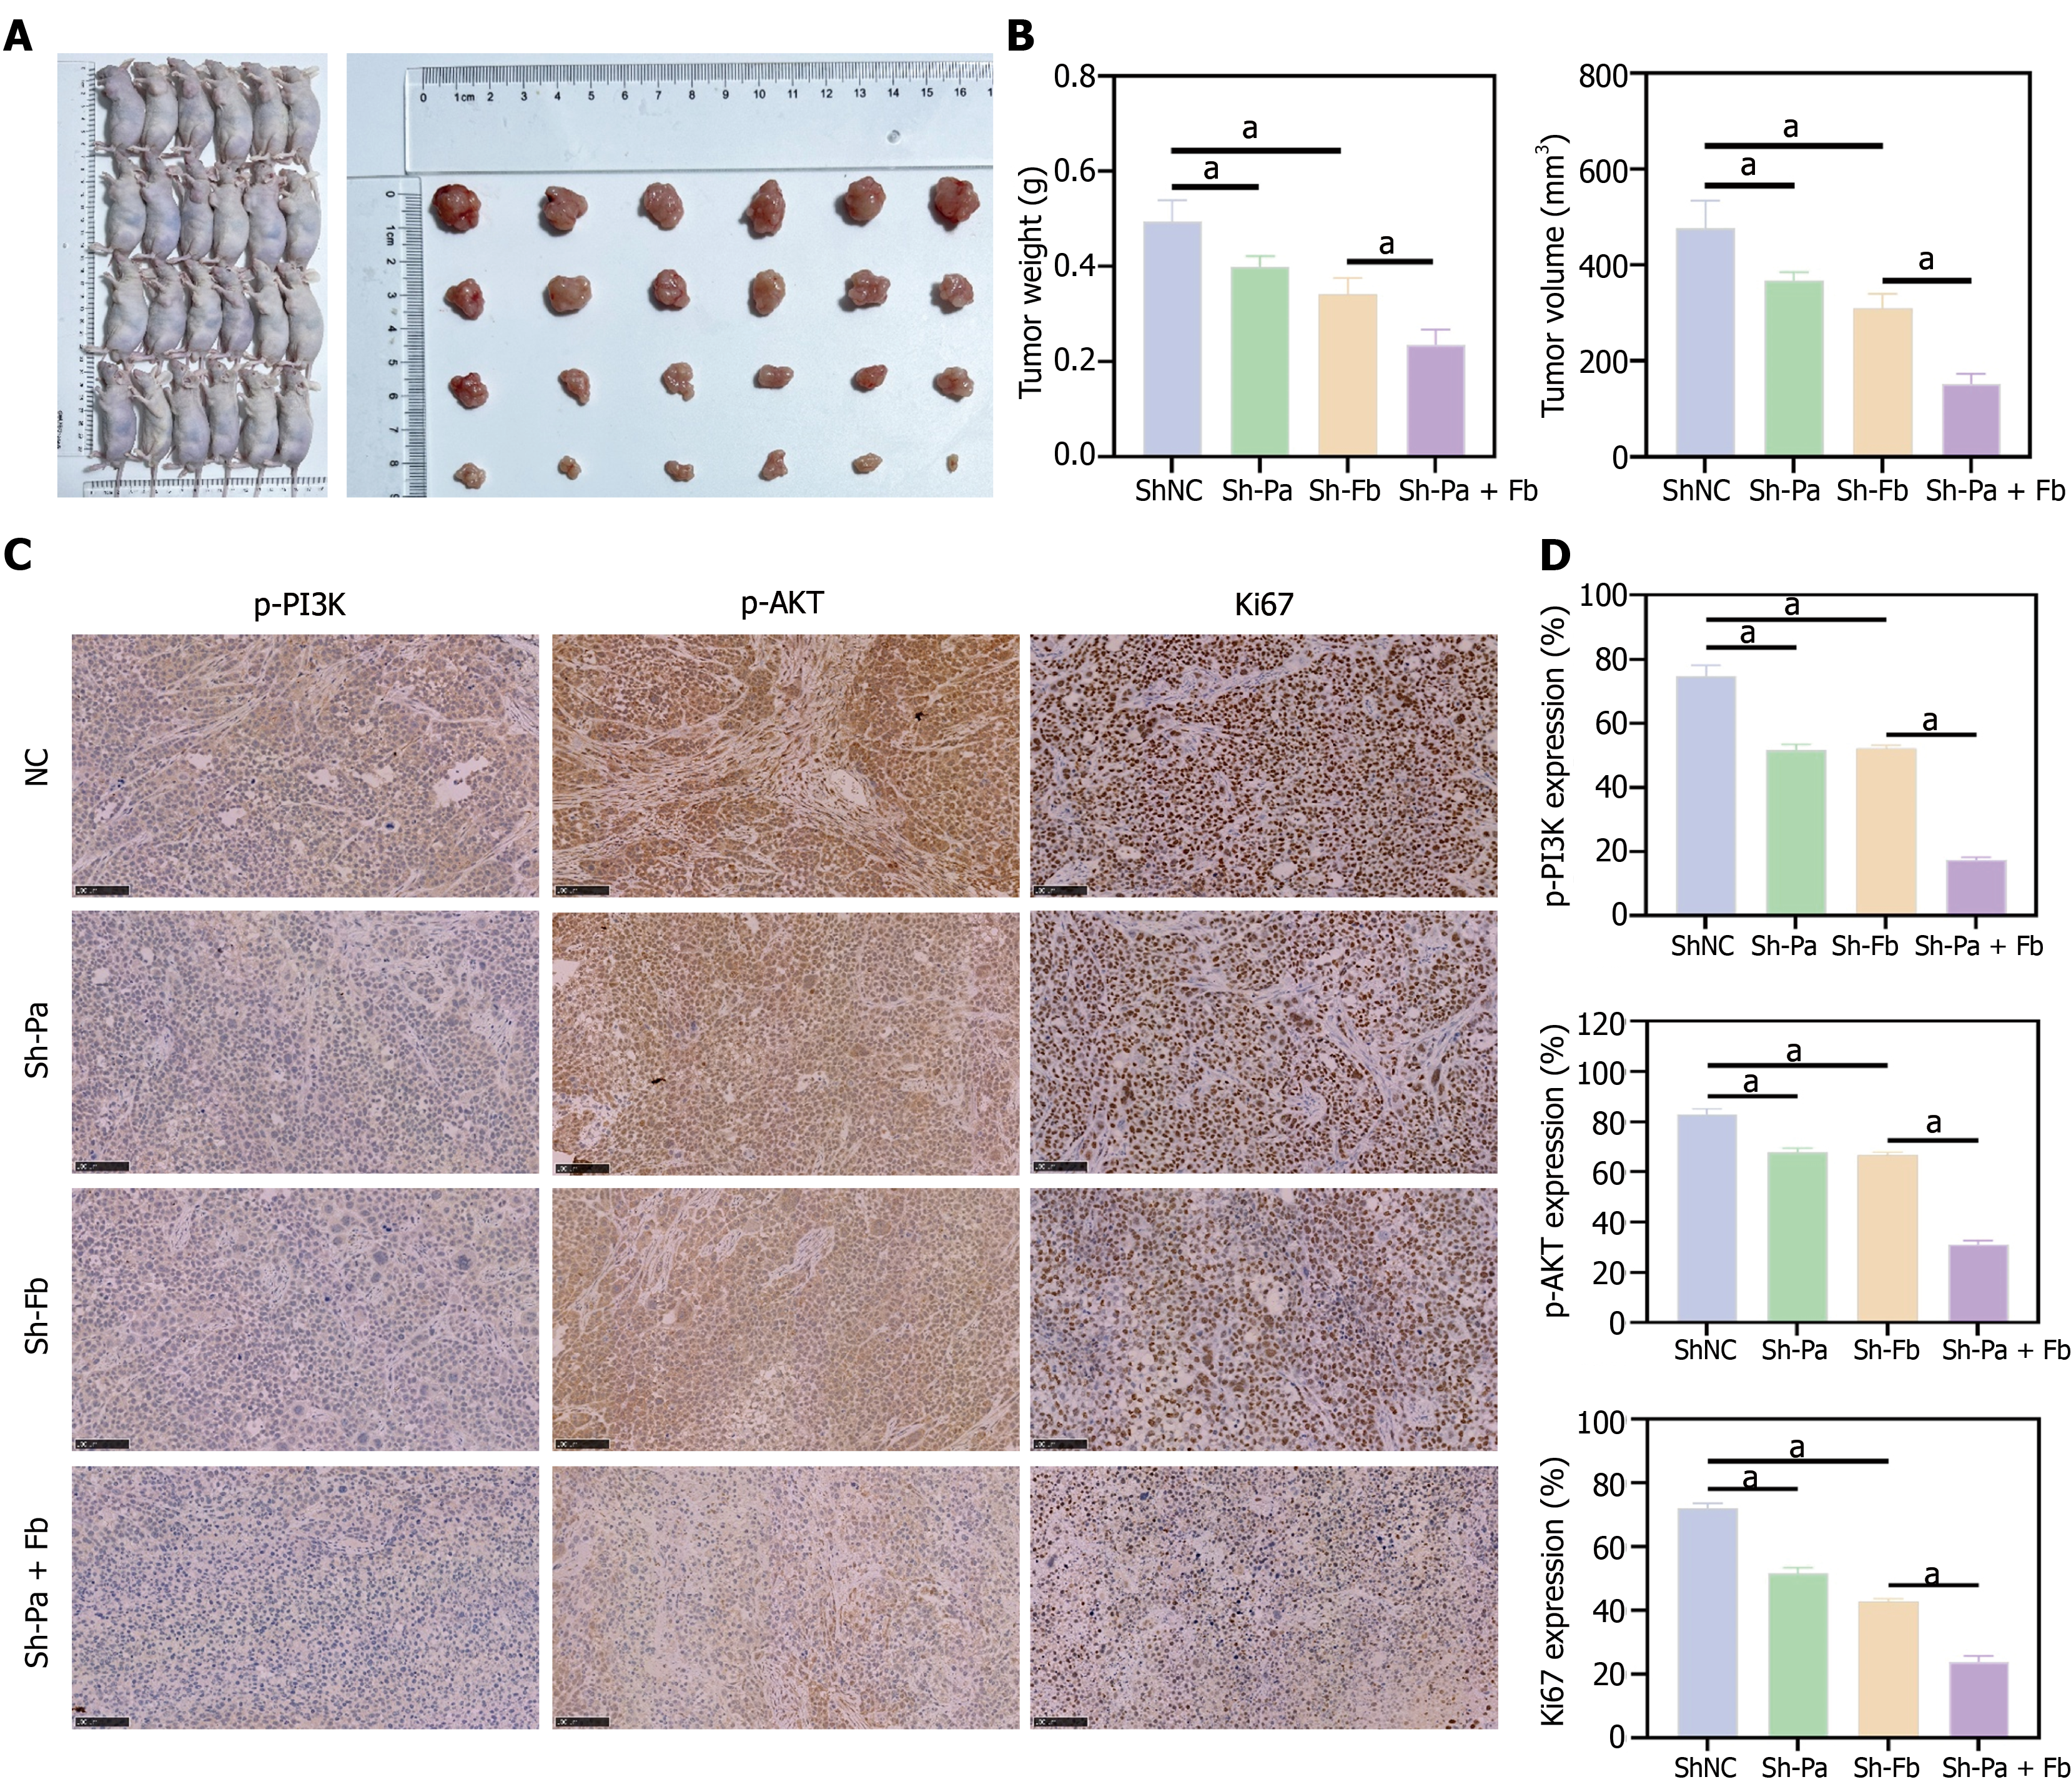
Figure 7 In vivo validation of the effects of PARVA and FBXO15 on gastric cancer growth and PI3K/AKT pathway activation.
A: Representative images of nude mice and subcutaneous xenograft tumors from each group; B: Tumor weight and final tumor volume in each group; C: Immunohistochemical staining of p-PI3K, p-AKT, and Ki67 in xenograft tissues; D: Quantitative analysis of p-PI3K, p-AKT, and Ki67 staining. aP < 0.001. NC: Negative control; Pa: PARVA; Fb: FBXO15.
- Citation: Lu X, Li J, Wang ML, Wang HZ, Li YX. PARVA promotes gastric cancer progression through FBXO15-related PI3K/AKT signaling. World J Gastrointest Oncol 2026; 18(10): 121827
- URL: https://www.wjgnet.com/1948-5204/full/v18/i10/121827.htm
- DOI: https://dx.doi.org/10.4251/wjgo.121827