
















Copyright: ©Author(s) 2026.
World J Gastrointest Oncol. Oct 15, 2026; 18(10): 121827
Published online Oct 15, 2026. doi: 10.4251/wjgo.121827
Published online Oct 15, 2026. doi: 10.4251/wjgo.121827
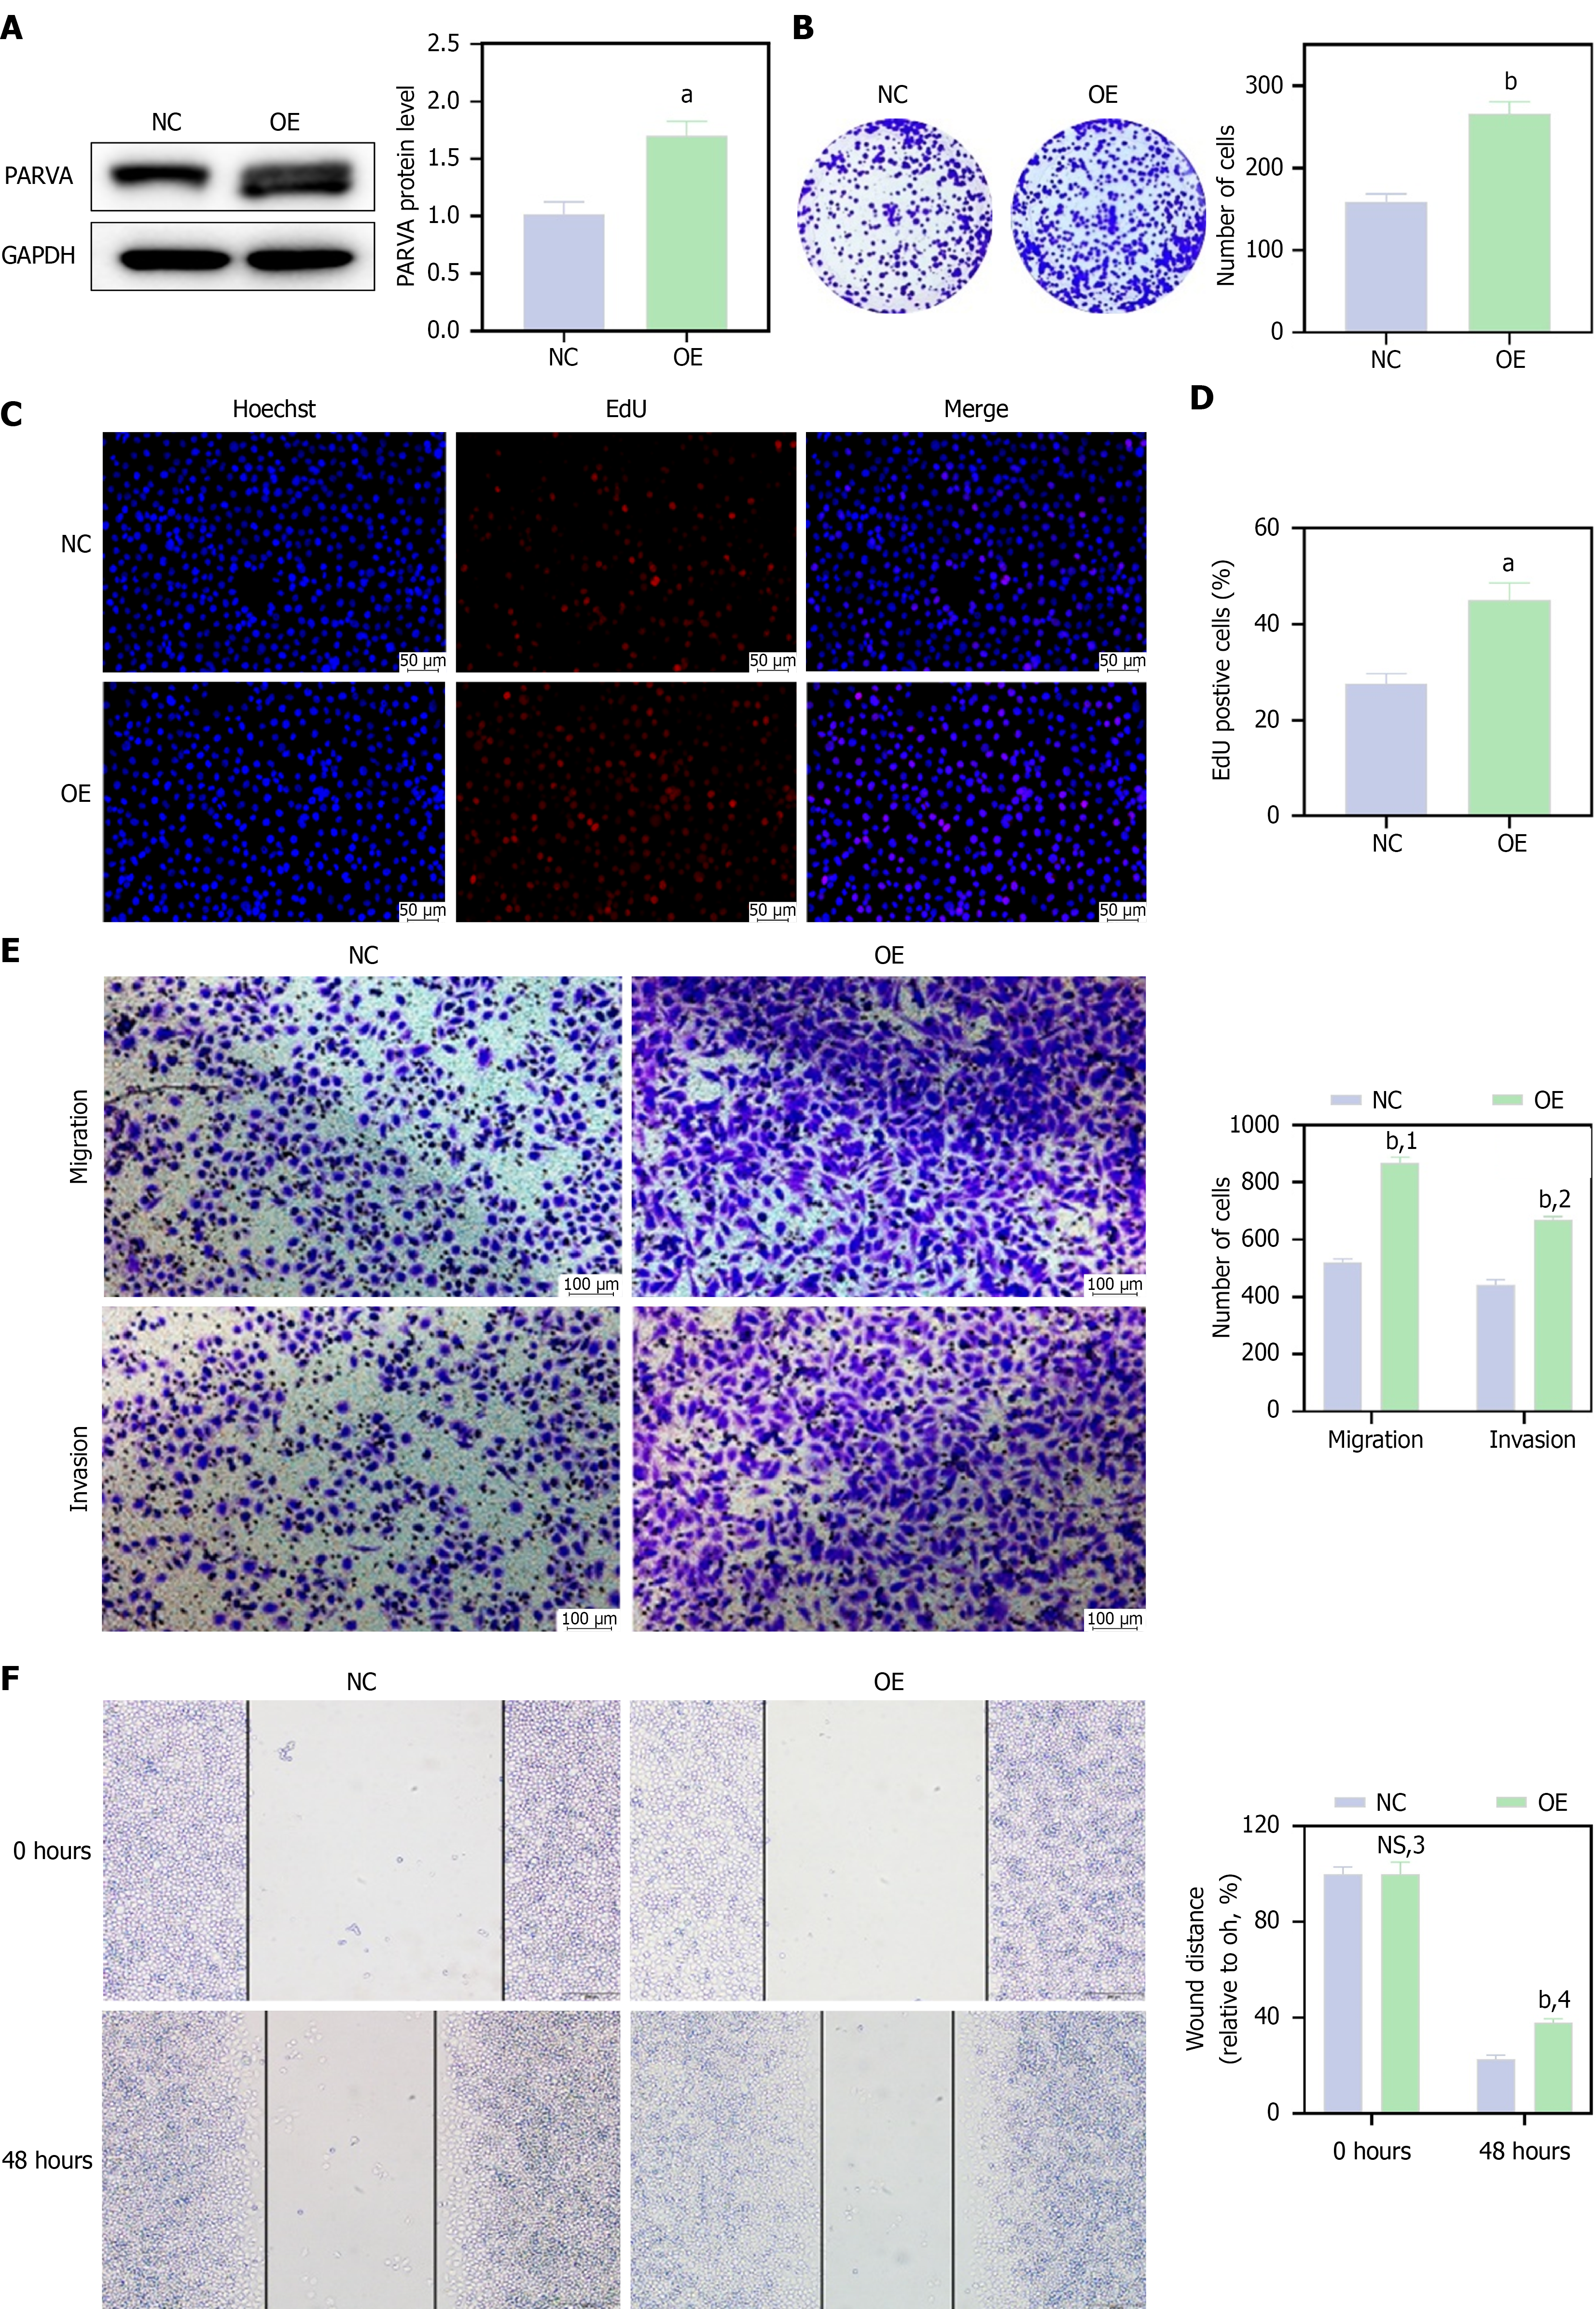
Figure 4 PARVA overexpression promoted the proliferation, migration, and invasion of gastric cancer cells.
A: Western blot analysis of PARVA overexpression efficiency in SGC7901 cells, with densitometric analysis; B: Colony formation assays with quantification of colony numbers; C: EdU assays; D: Quantification of EdU-positive cells; E: Transwell migration and invasion assays with quantification; F: Wound-healing assays with quantification of wound closure. When followed by a numeral, the comparison refers to the corresponding control within the indicated subgroup. respectively. aP < 0.01. bP < 0.001; 1Comparison within the migration subgroup; 2Comparison within the invasion subgroup; 3Comparison within the 0 hour subgroup; 4Comparison within the 48 hours subgroup. NS: Not significant; NC: Negative control; OE: Overexpression.
- Citation: Lu X, Li J, Wang ML, Wang HZ, Li YX. PARVA promotes gastric cancer progression through FBXO15-related PI3K/AKT signaling. World J Gastrointest Oncol 2026; 18(10): 121827
- URL: https://www.wjgnet.com/1948-5204/full/v18/i10/121827.htm
- DOI: https://dx.doi.org/10.4251/wjgo.121827