
















Copyright: ©Author(s) 2026.
World J Gastrointest Oncol. Oct 15, 2026; 18(10): 121827
Published online Oct 15, 2026. doi: 10.4251/wjgo.121827
Published online Oct 15, 2026. doi: 10.4251/wjgo.121827
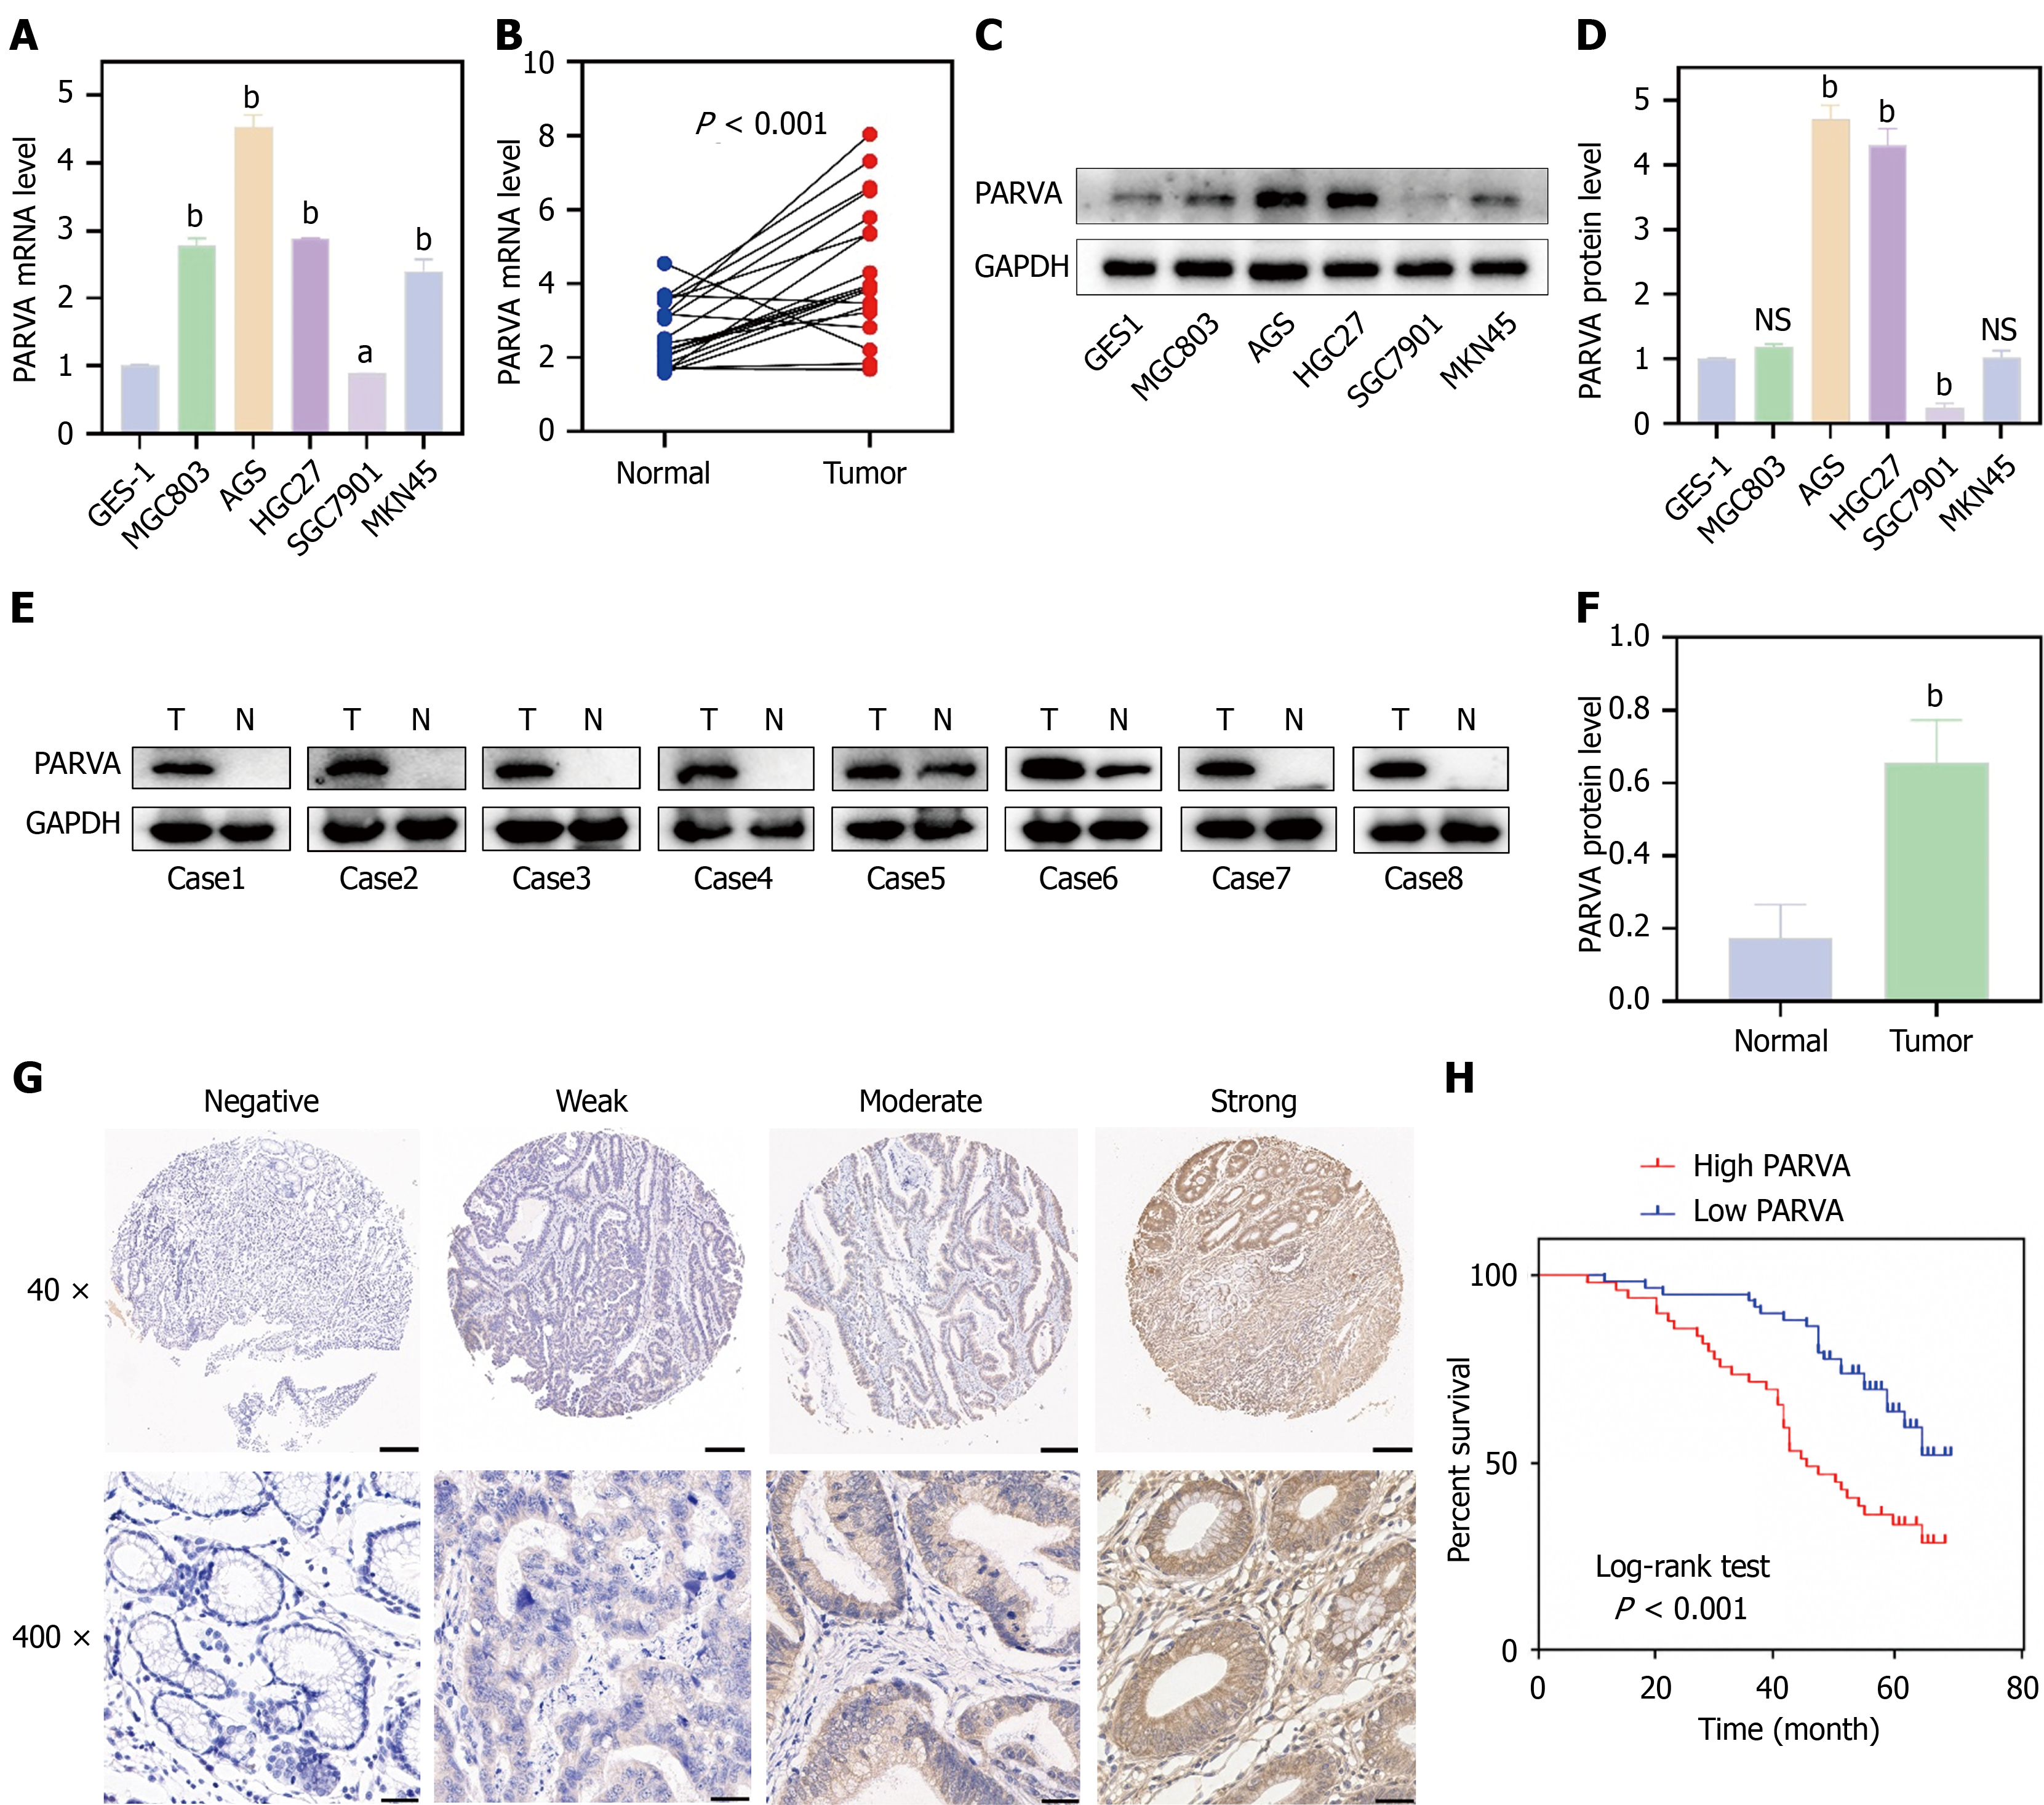
Figure 2 Expression pattern of PARVA in gastric cancer cell lines and tissues and its prognostic significance.
A: The quantitative real-time PCR (qRT-PCR) analysis of PARVA mRNA expression in GES-1 and gastric cancer cell lines; B: The qRT-PCR analysis of PARVA mRNA expression in gastric cancer tissues and paired adjacent tissues; C: Western blot analysis of PARVA protein expression in GES-1 and gastric cancer cell lines; D: Densitometric analysis of the Western blot bands shown in panel C; E: Western blot analysis of PARVA protein expression in gastric cancer tissues and paired adjacent tissues; F: Densitometric analysis of the Western blot bands shown in panel E; G: Representative immunohistochemical staining showing negative, weak, moderate, and strong PARVA expression in gastric cancer tissues; H: Kaplan-Meier survival analysis according to PARVA expression. Statistical comparisons were made against GES-1 or normal tissues, as indicated. Scale bars: 200 μm for 40 × images and 50 μm for 400 × images in panel G. aP < 0.05; bP < 0.001. NS: Not significant.
- Citation: Lu X, Li J, Wang ML, Wang HZ, Li YX. PARVA promotes gastric cancer progression through FBXO15-related PI3K/AKT signaling. World J Gastrointest Oncol 2026; 18(10): 121827
- URL: https://www.wjgnet.com/1948-5204/full/v18/i10/121827.htm
- DOI: https://dx.doi.org/10.4251/wjgo.121827