Copyright
©The Author(s) 2025.
World J Gastrointest Oncol. May 15, 2025; 17(5): 105933
Published online May 15, 2025. doi: 10.4251/wjgo.v17.i5.105933
Published online May 15, 2025. doi: 10.4251/wjgo.v17.i5.105933
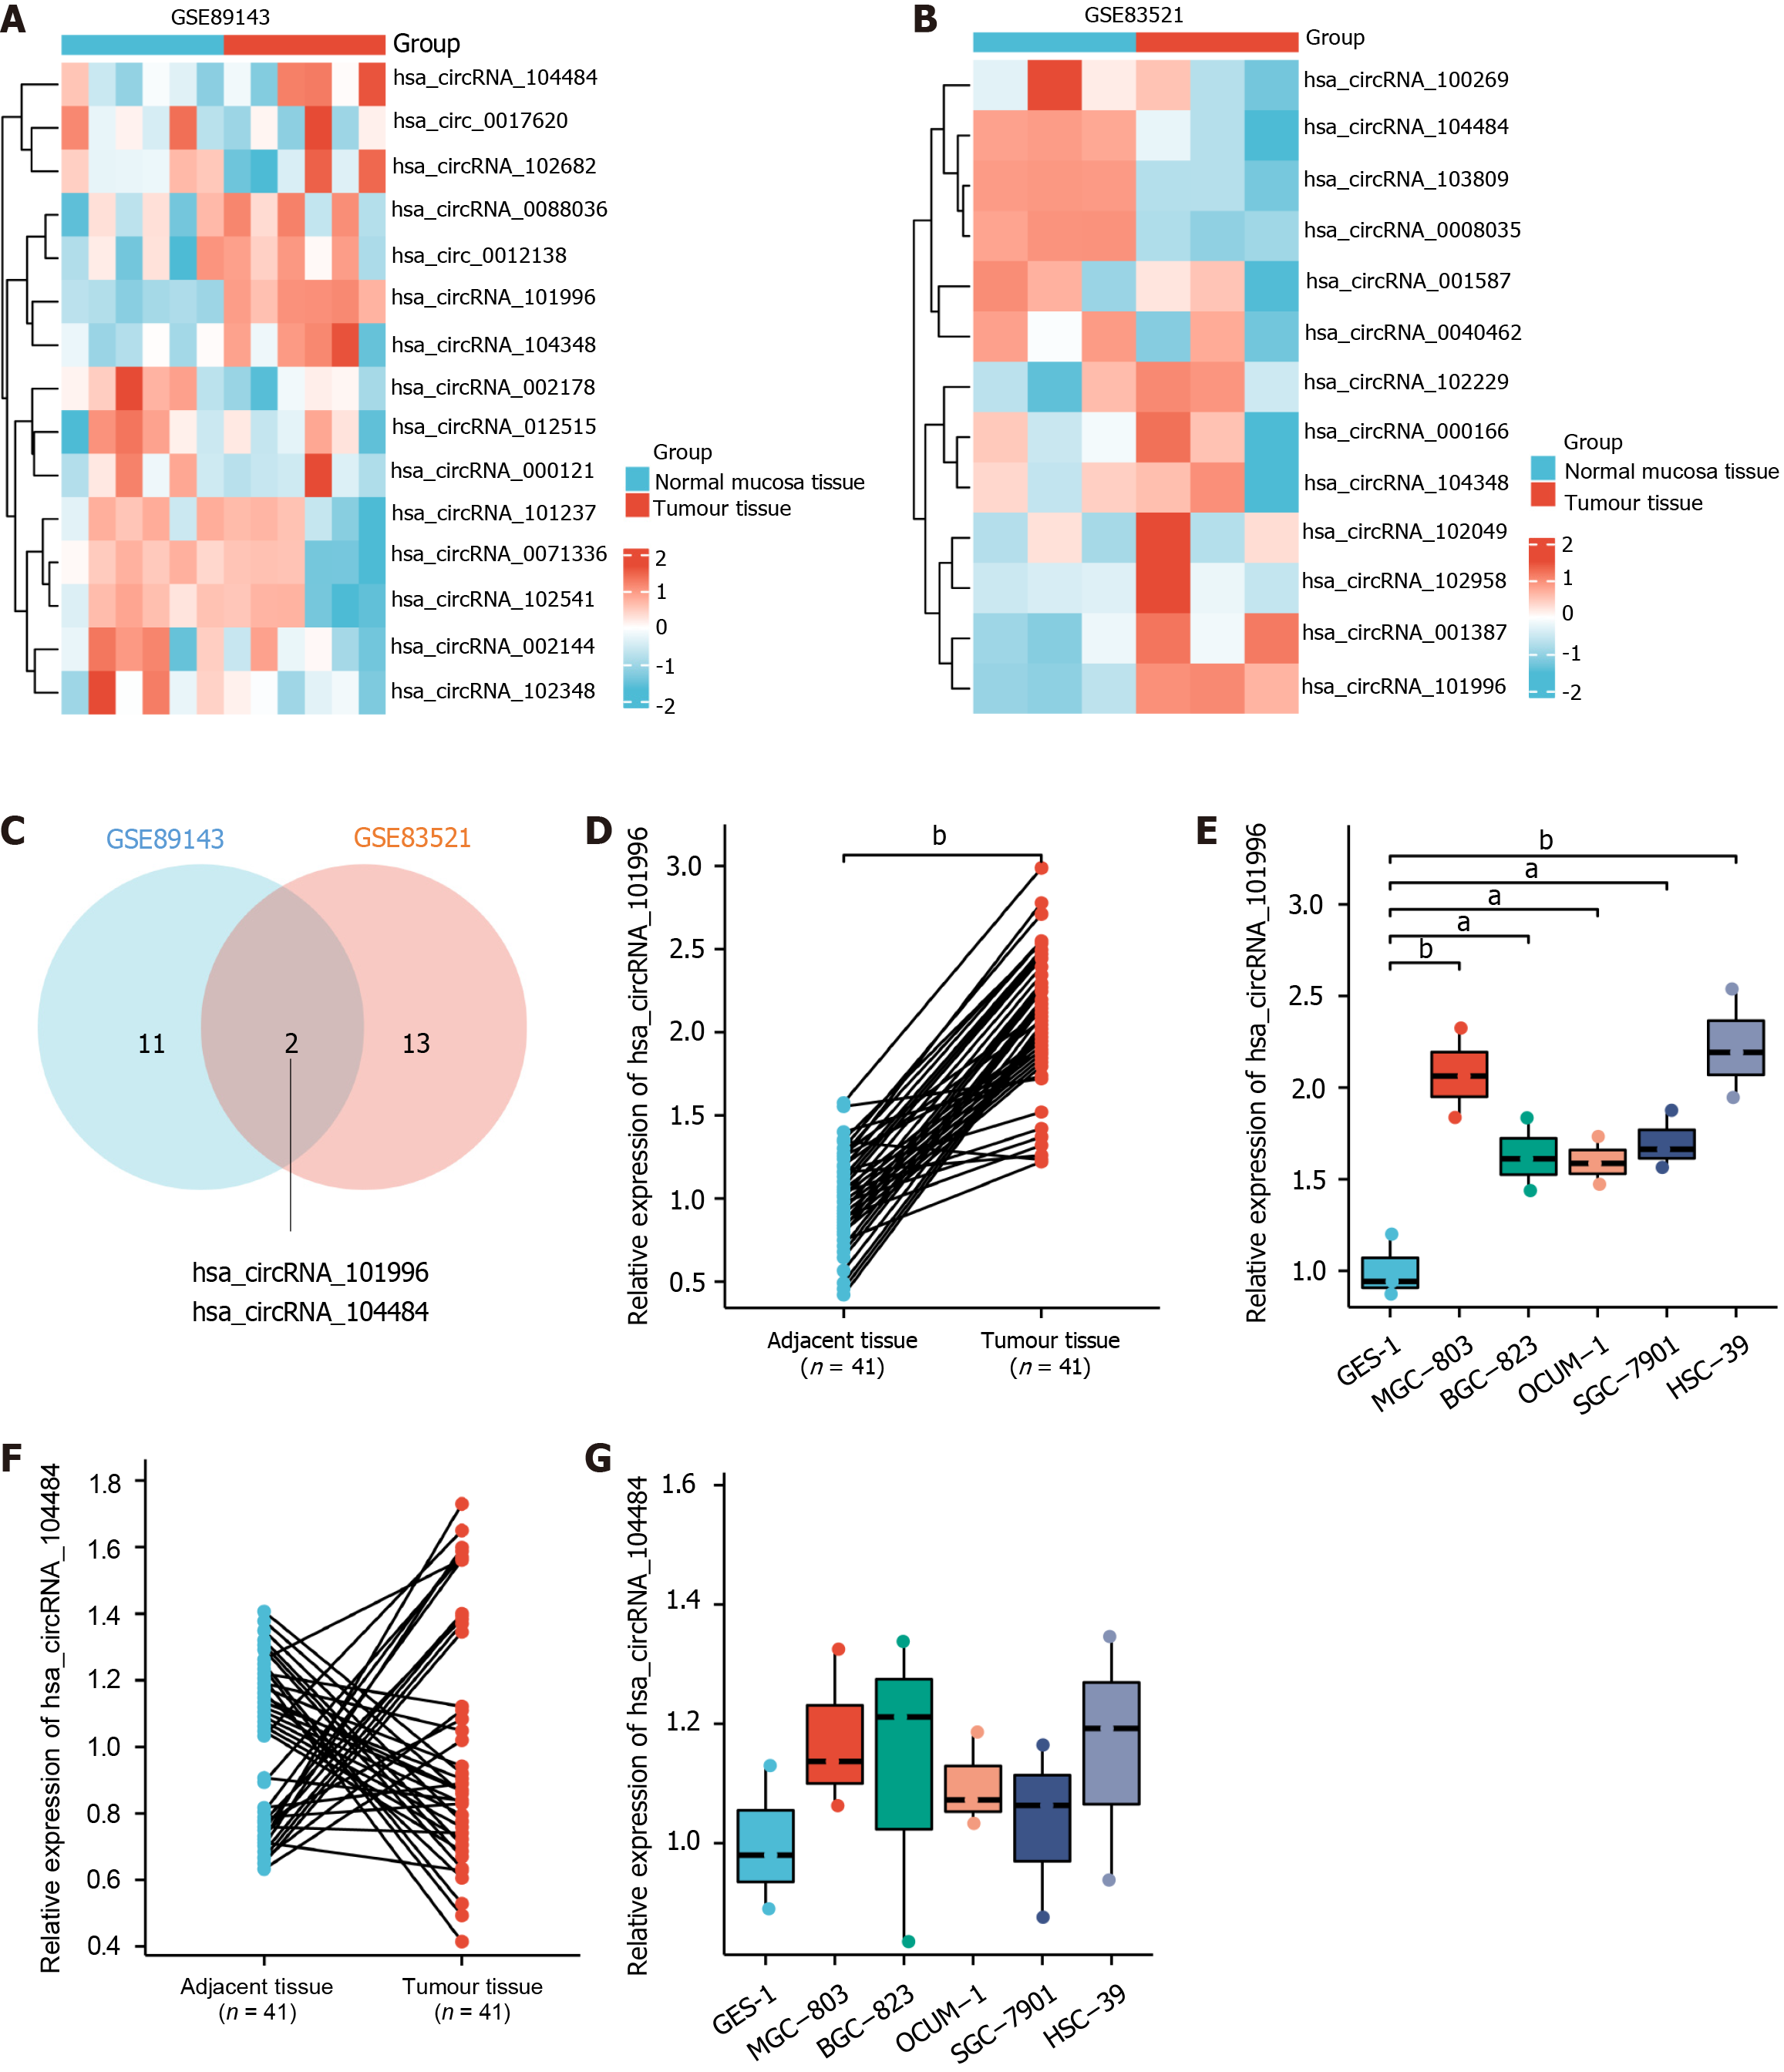
Figure 1 Expression characteristics of hsa_circRNA_101996 in gastric cancer tissues and cells.
A: Heat map of differential genes in the GSE89143; B: Heat map of differential genes in the GSE83521; C: Venn diagram; D: Compared to adjacent non-cancerous tissues, hsa_circRNA_101996 was significantly upregulated in gastric cancer tissues; E: Compared to GES-1 cell line, hsa_circRNA_101996 was significantly upregulated in MGC-803, BGC-823, OCUM-1, SGC-7901, and HSC-39 cell lines; F: There was no significant difference in the expression of hsa_circRNA_104484 between gastric cancer tissues and adjacent non-cancerous tissues; G: There was no significant difference in the expression of hsa_circRNA_104484 among cell lines. aP < 0.05; bP < 0.001.
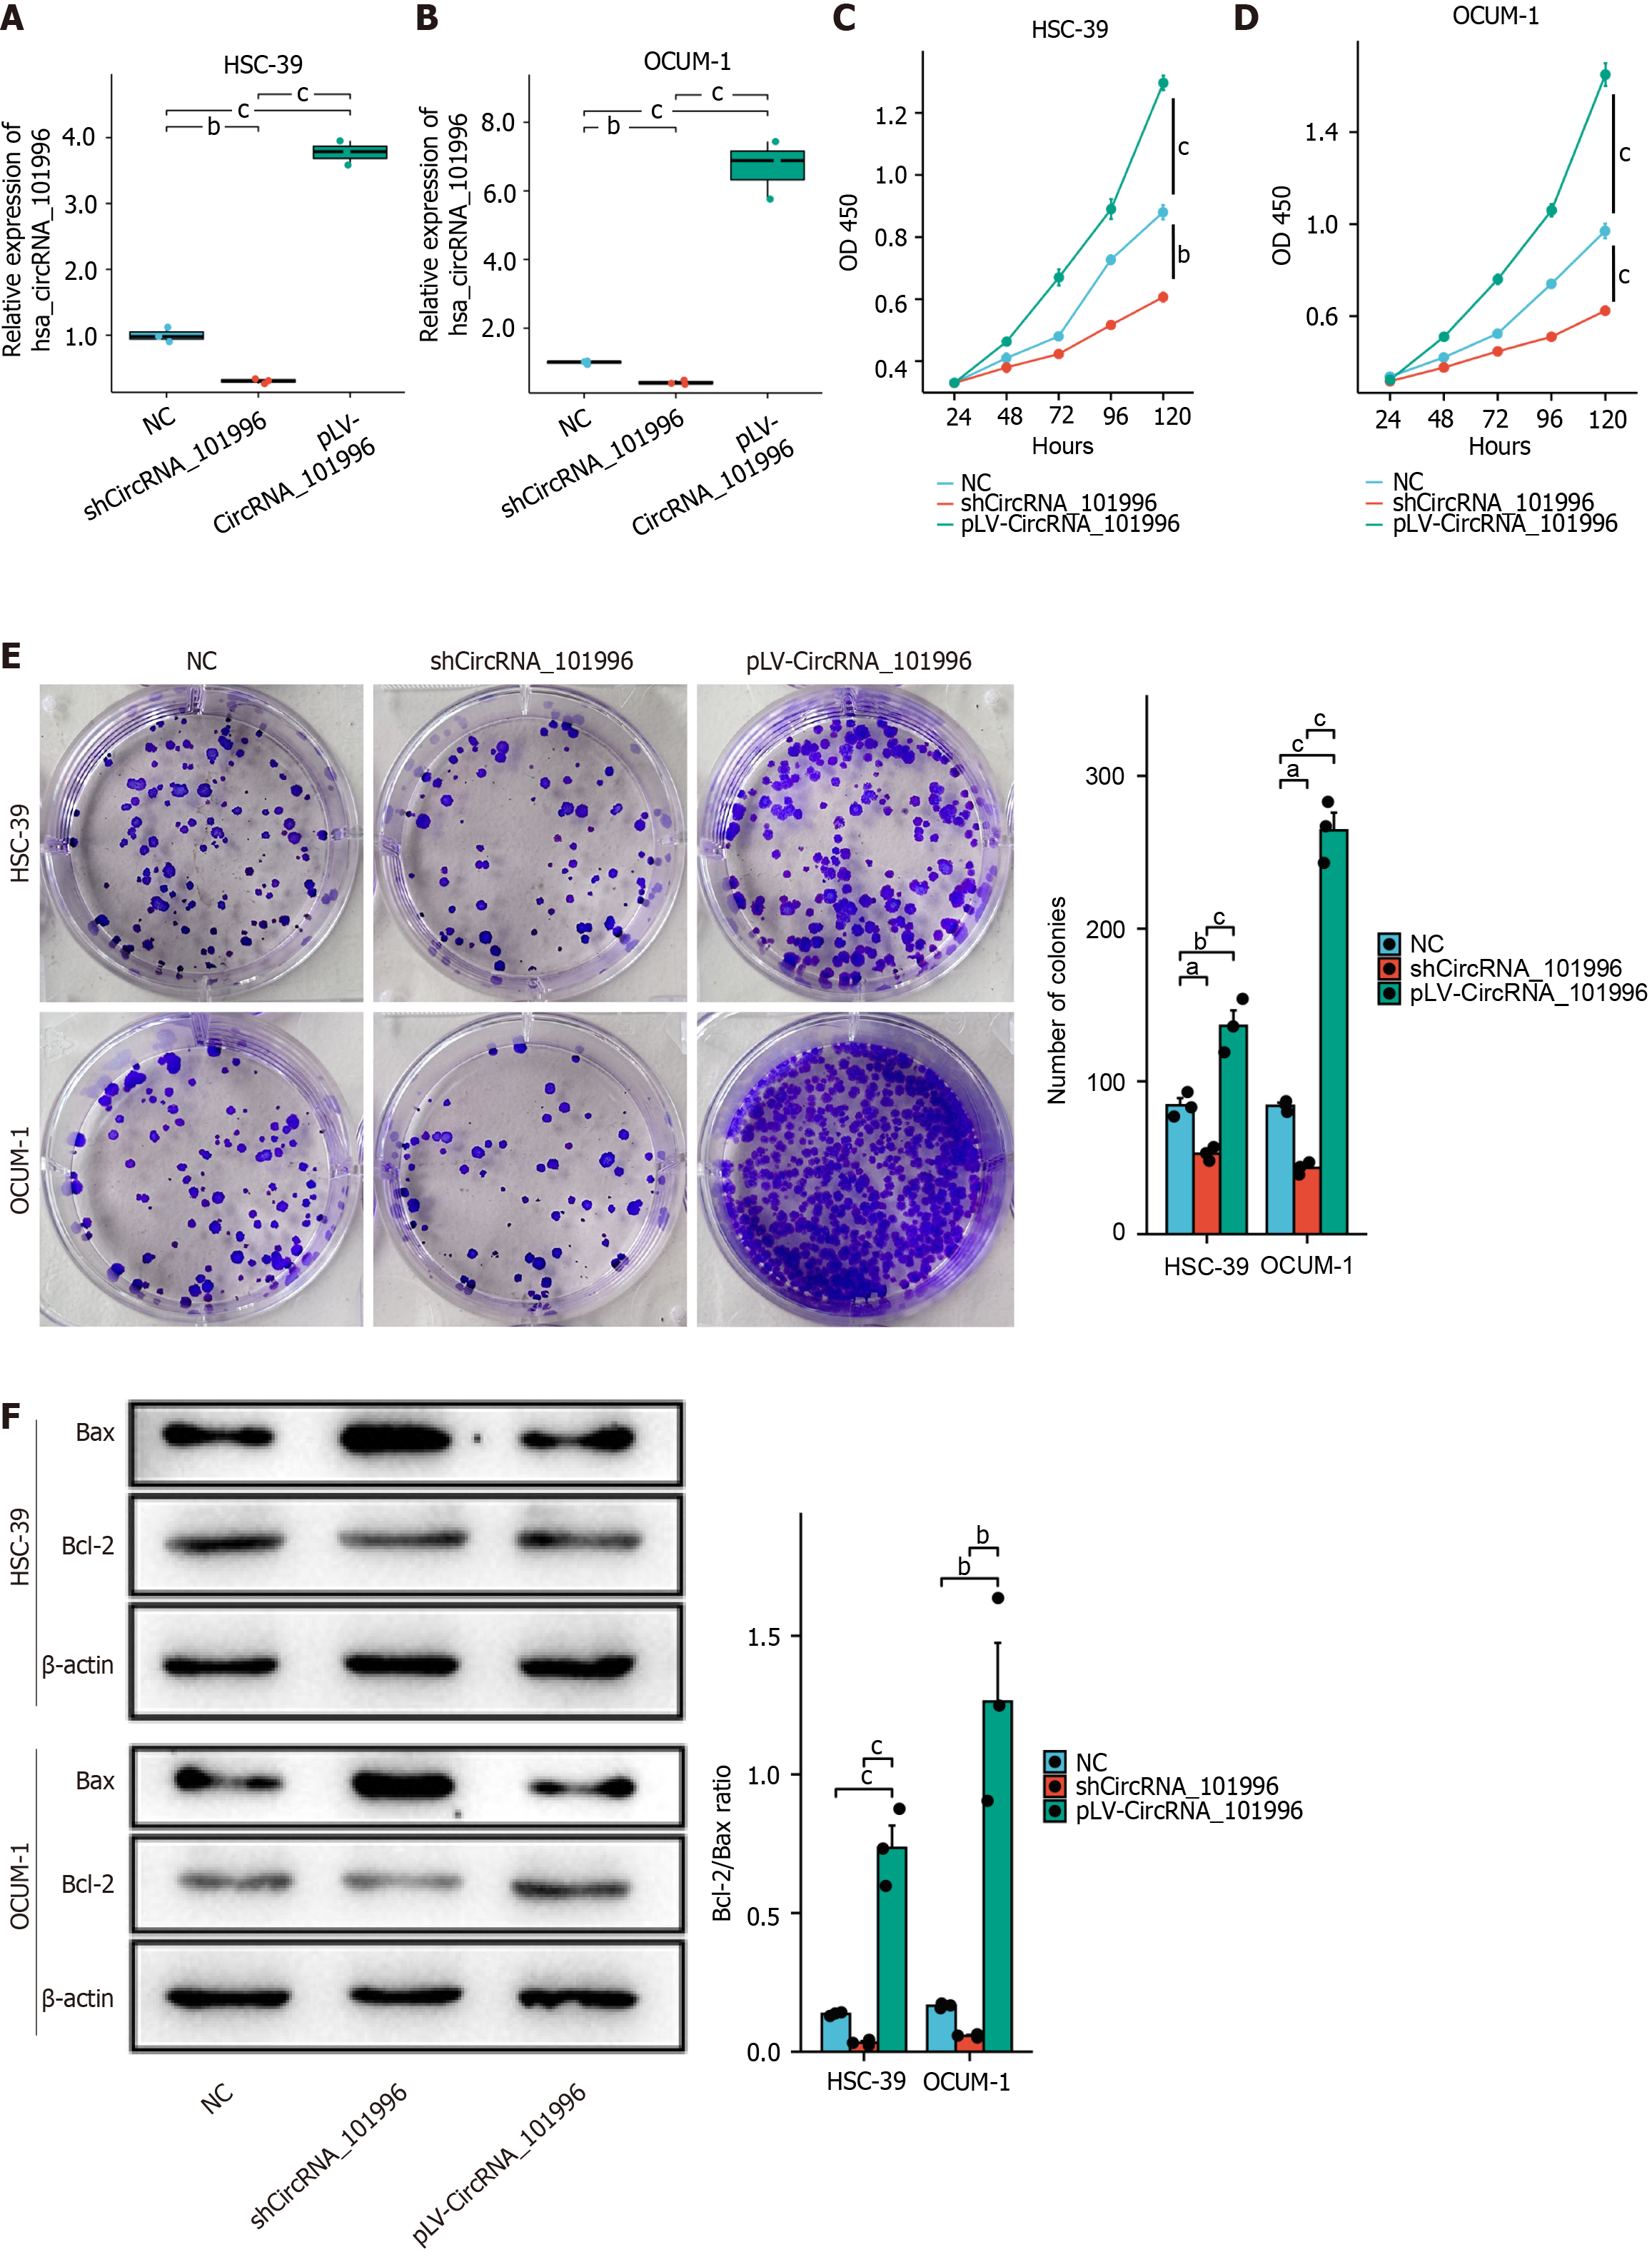
Figure 2 Hsa_circRNA_101996 promotes gastric cancer proliferation and suppresses apoptosis.
A and B: The efficiency of circRNA_101996 knockdown and overexpression in the OCUM-1 and HSC-39 cell lines; C and D: MTT assay in OCUM-1 and HSC-39 cell lines; E: Colony formation assay in OCUM-1 and HSC-39 cell lines; F: The Bcl-2/Bax ratio was significantly decreased in OCUM-1 and HSC-39 cells of the shCircRNA_101996 group, while the Bcl-2/Bax ratio was significantly increased in cells of the pLV-CircRNA_101996 group. aP < 0.05; bP < 0.01; cP < 0.001. NC: Negative control.
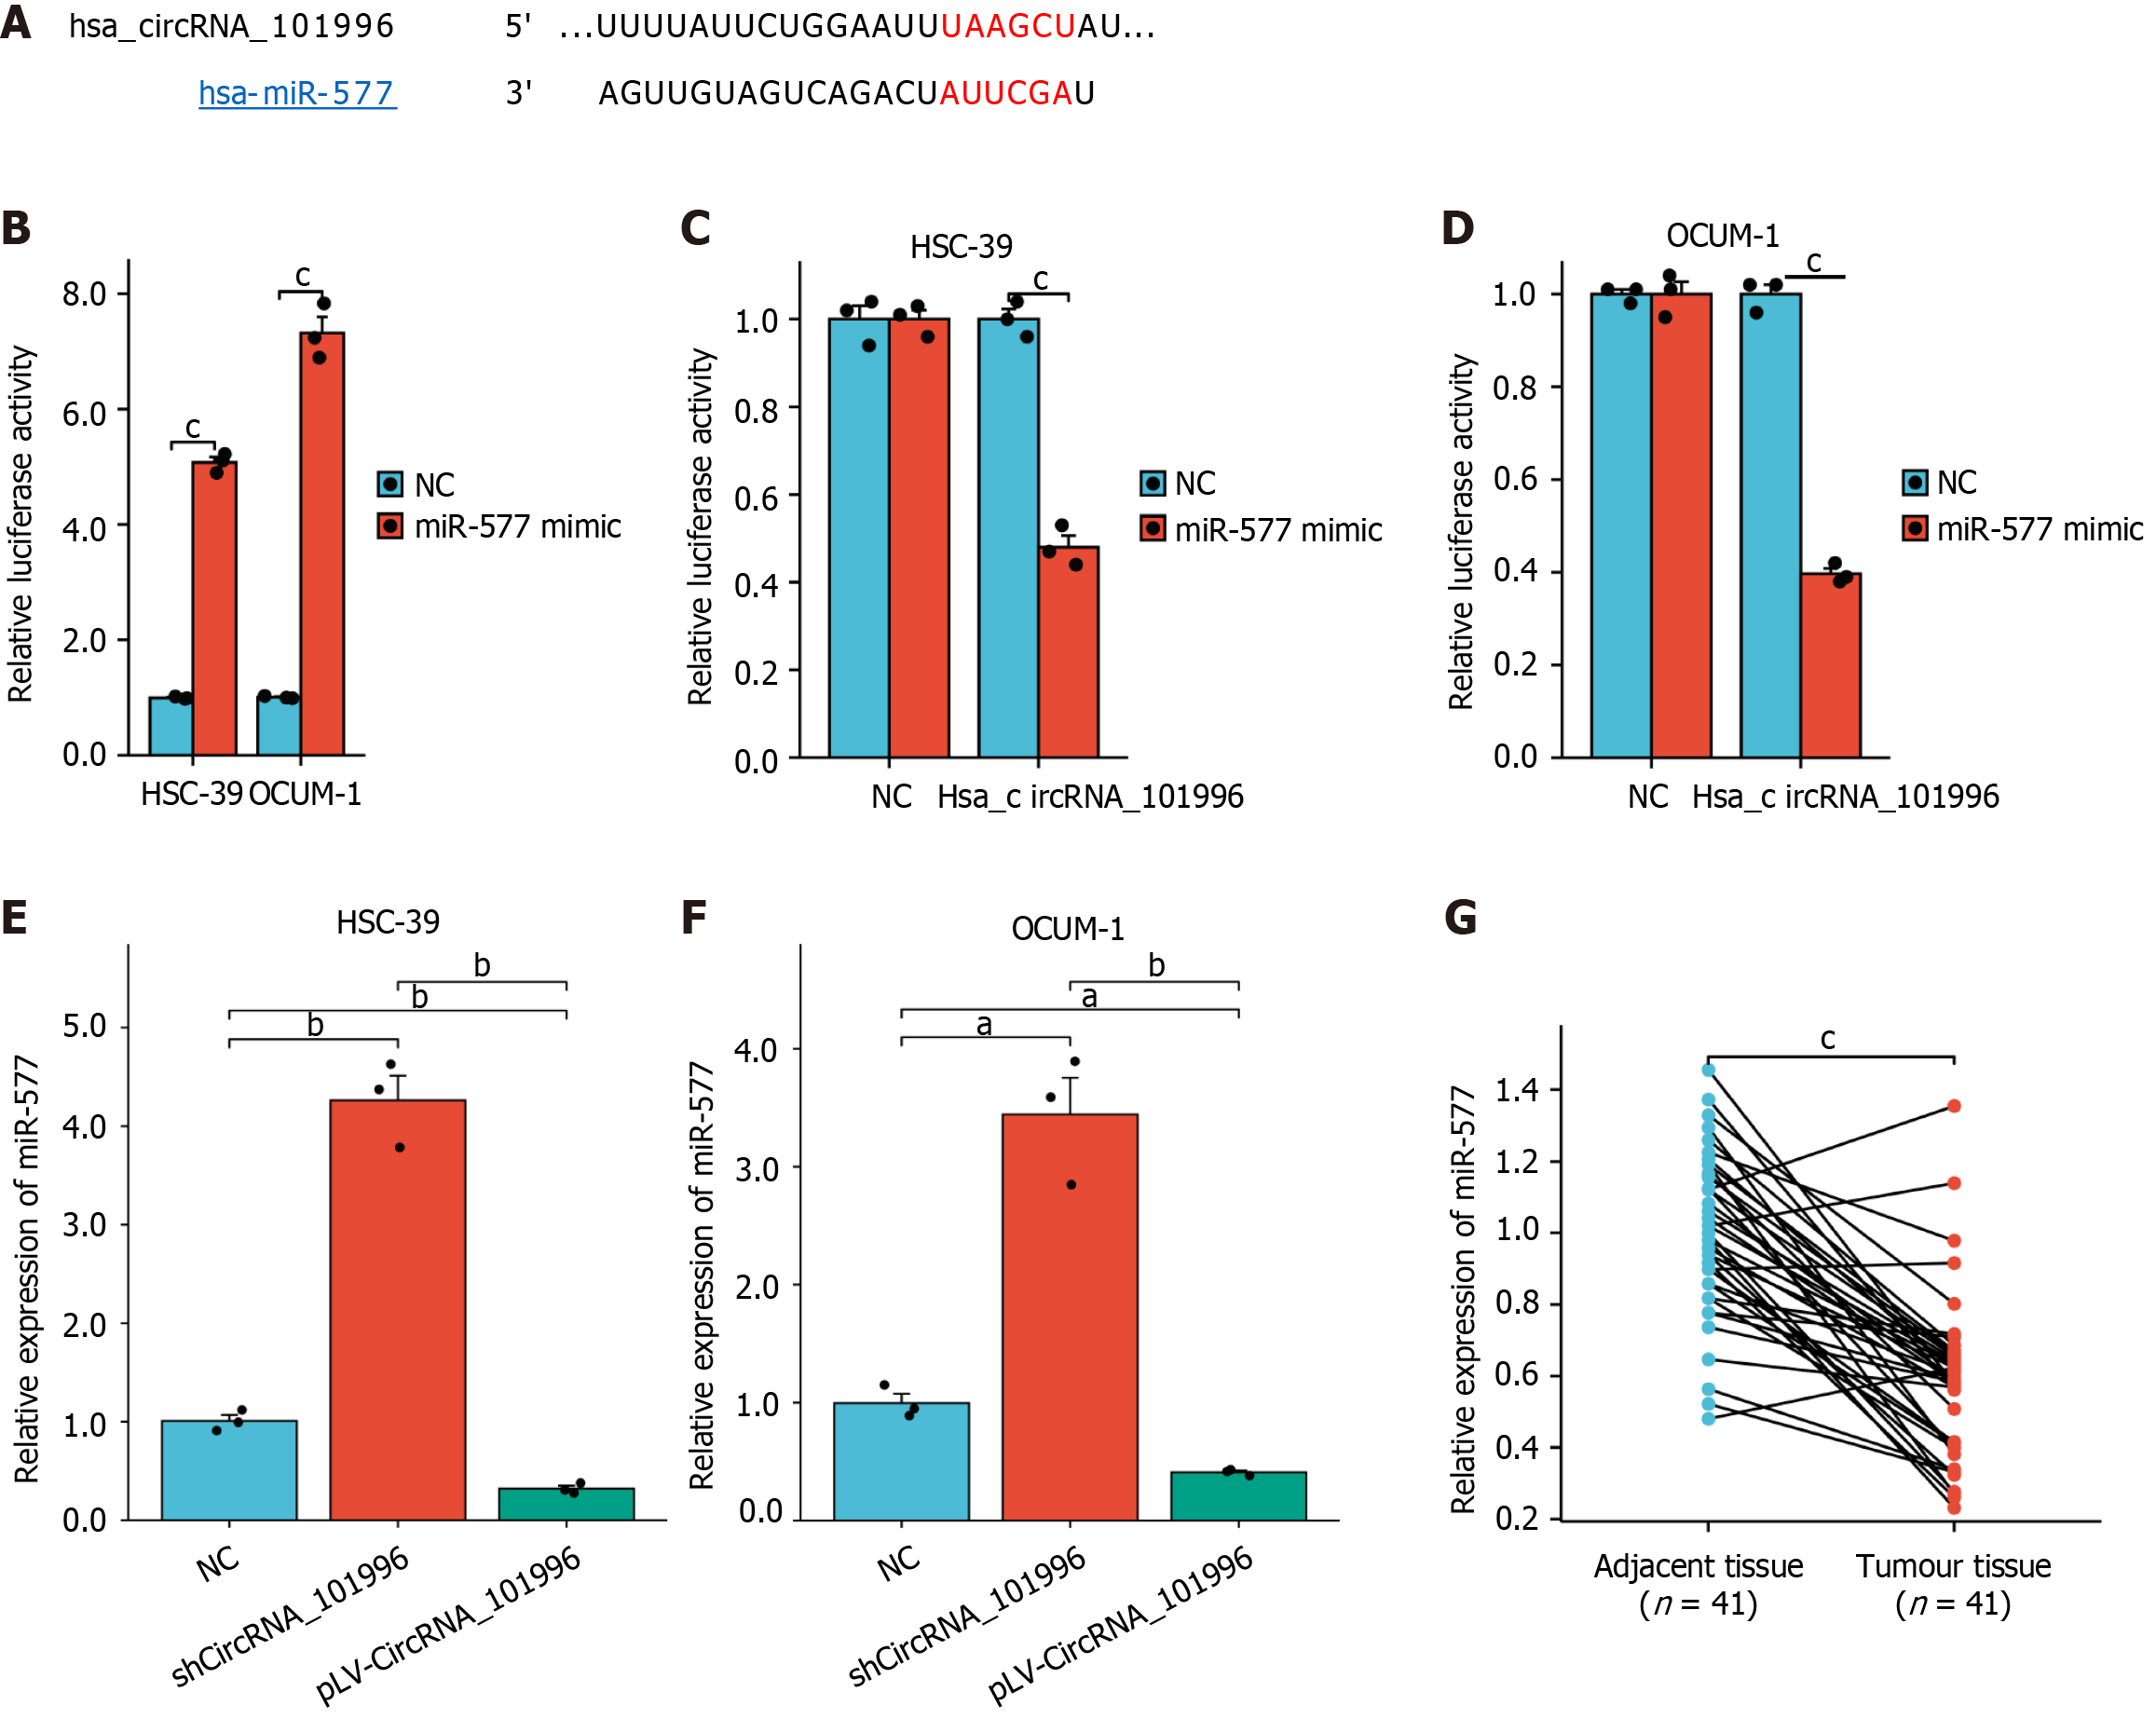
Figure 3 Validation of the regulatory relationship among hsa_circRNA_101996 and miR-577.
A: CircInteractome was used to predict the binding site of circRNA_101996 and miR-577; B: The expression of miR-577; C and D: Luciferase reporter gene assays confirmed the target relationship between hsa_circRNA_101996 and miR-577 in OCUM-1 and HSC-39 cell lines; F: The expression of miR-577; G: Compared with the adjacent tissues, miR-577 expression was notably downregulated in gastric cancer tissues. aP < 0.05; bP < 0.01; cP < 0.001. NC: Negative control.
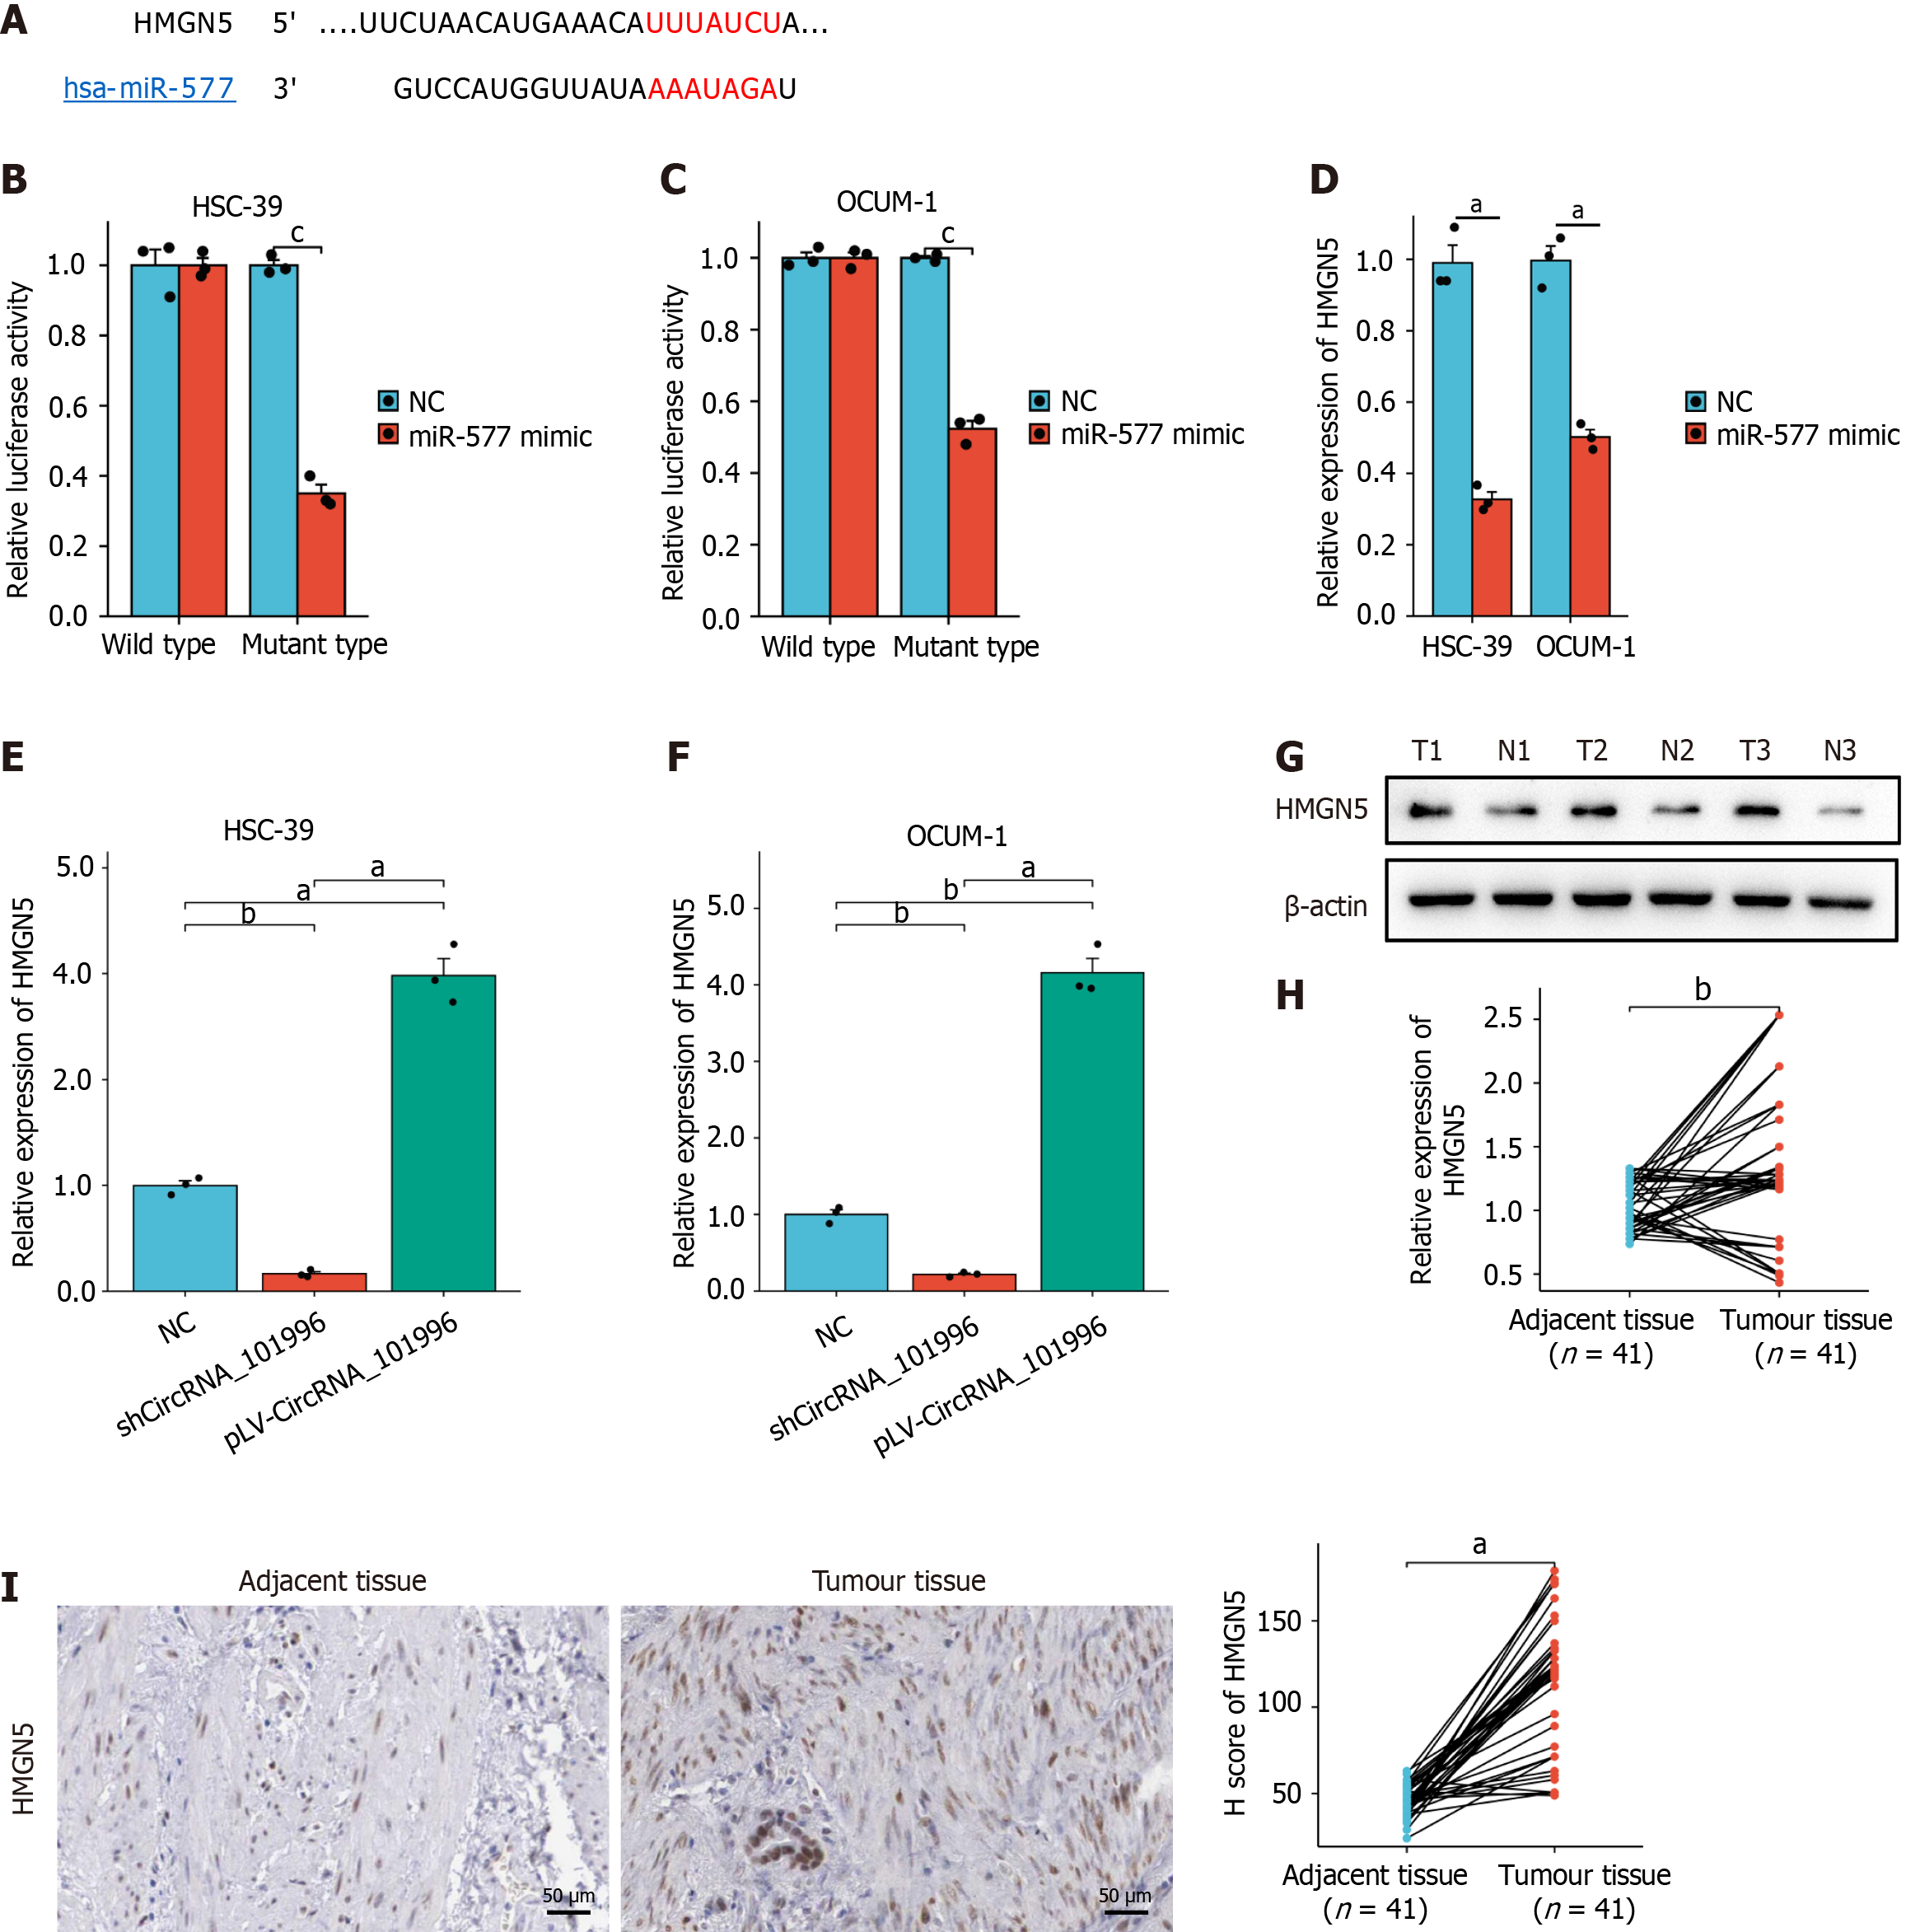
Figure 4 Validation of the regulatory relationship among miR-577 and HMGN5.
A: TargetScan was used to predict the binding site of miR-577 and HMGN5; B and C: Luciferase reporter gene assays confirmed the target relationship between miR-577 and HMGN5 in OCUM-1 and HSC-39 cell lines; D-I: The mRNA and protein levels of HMGN5. aP < 0.001; bP < 0.01. NC: Negative control.
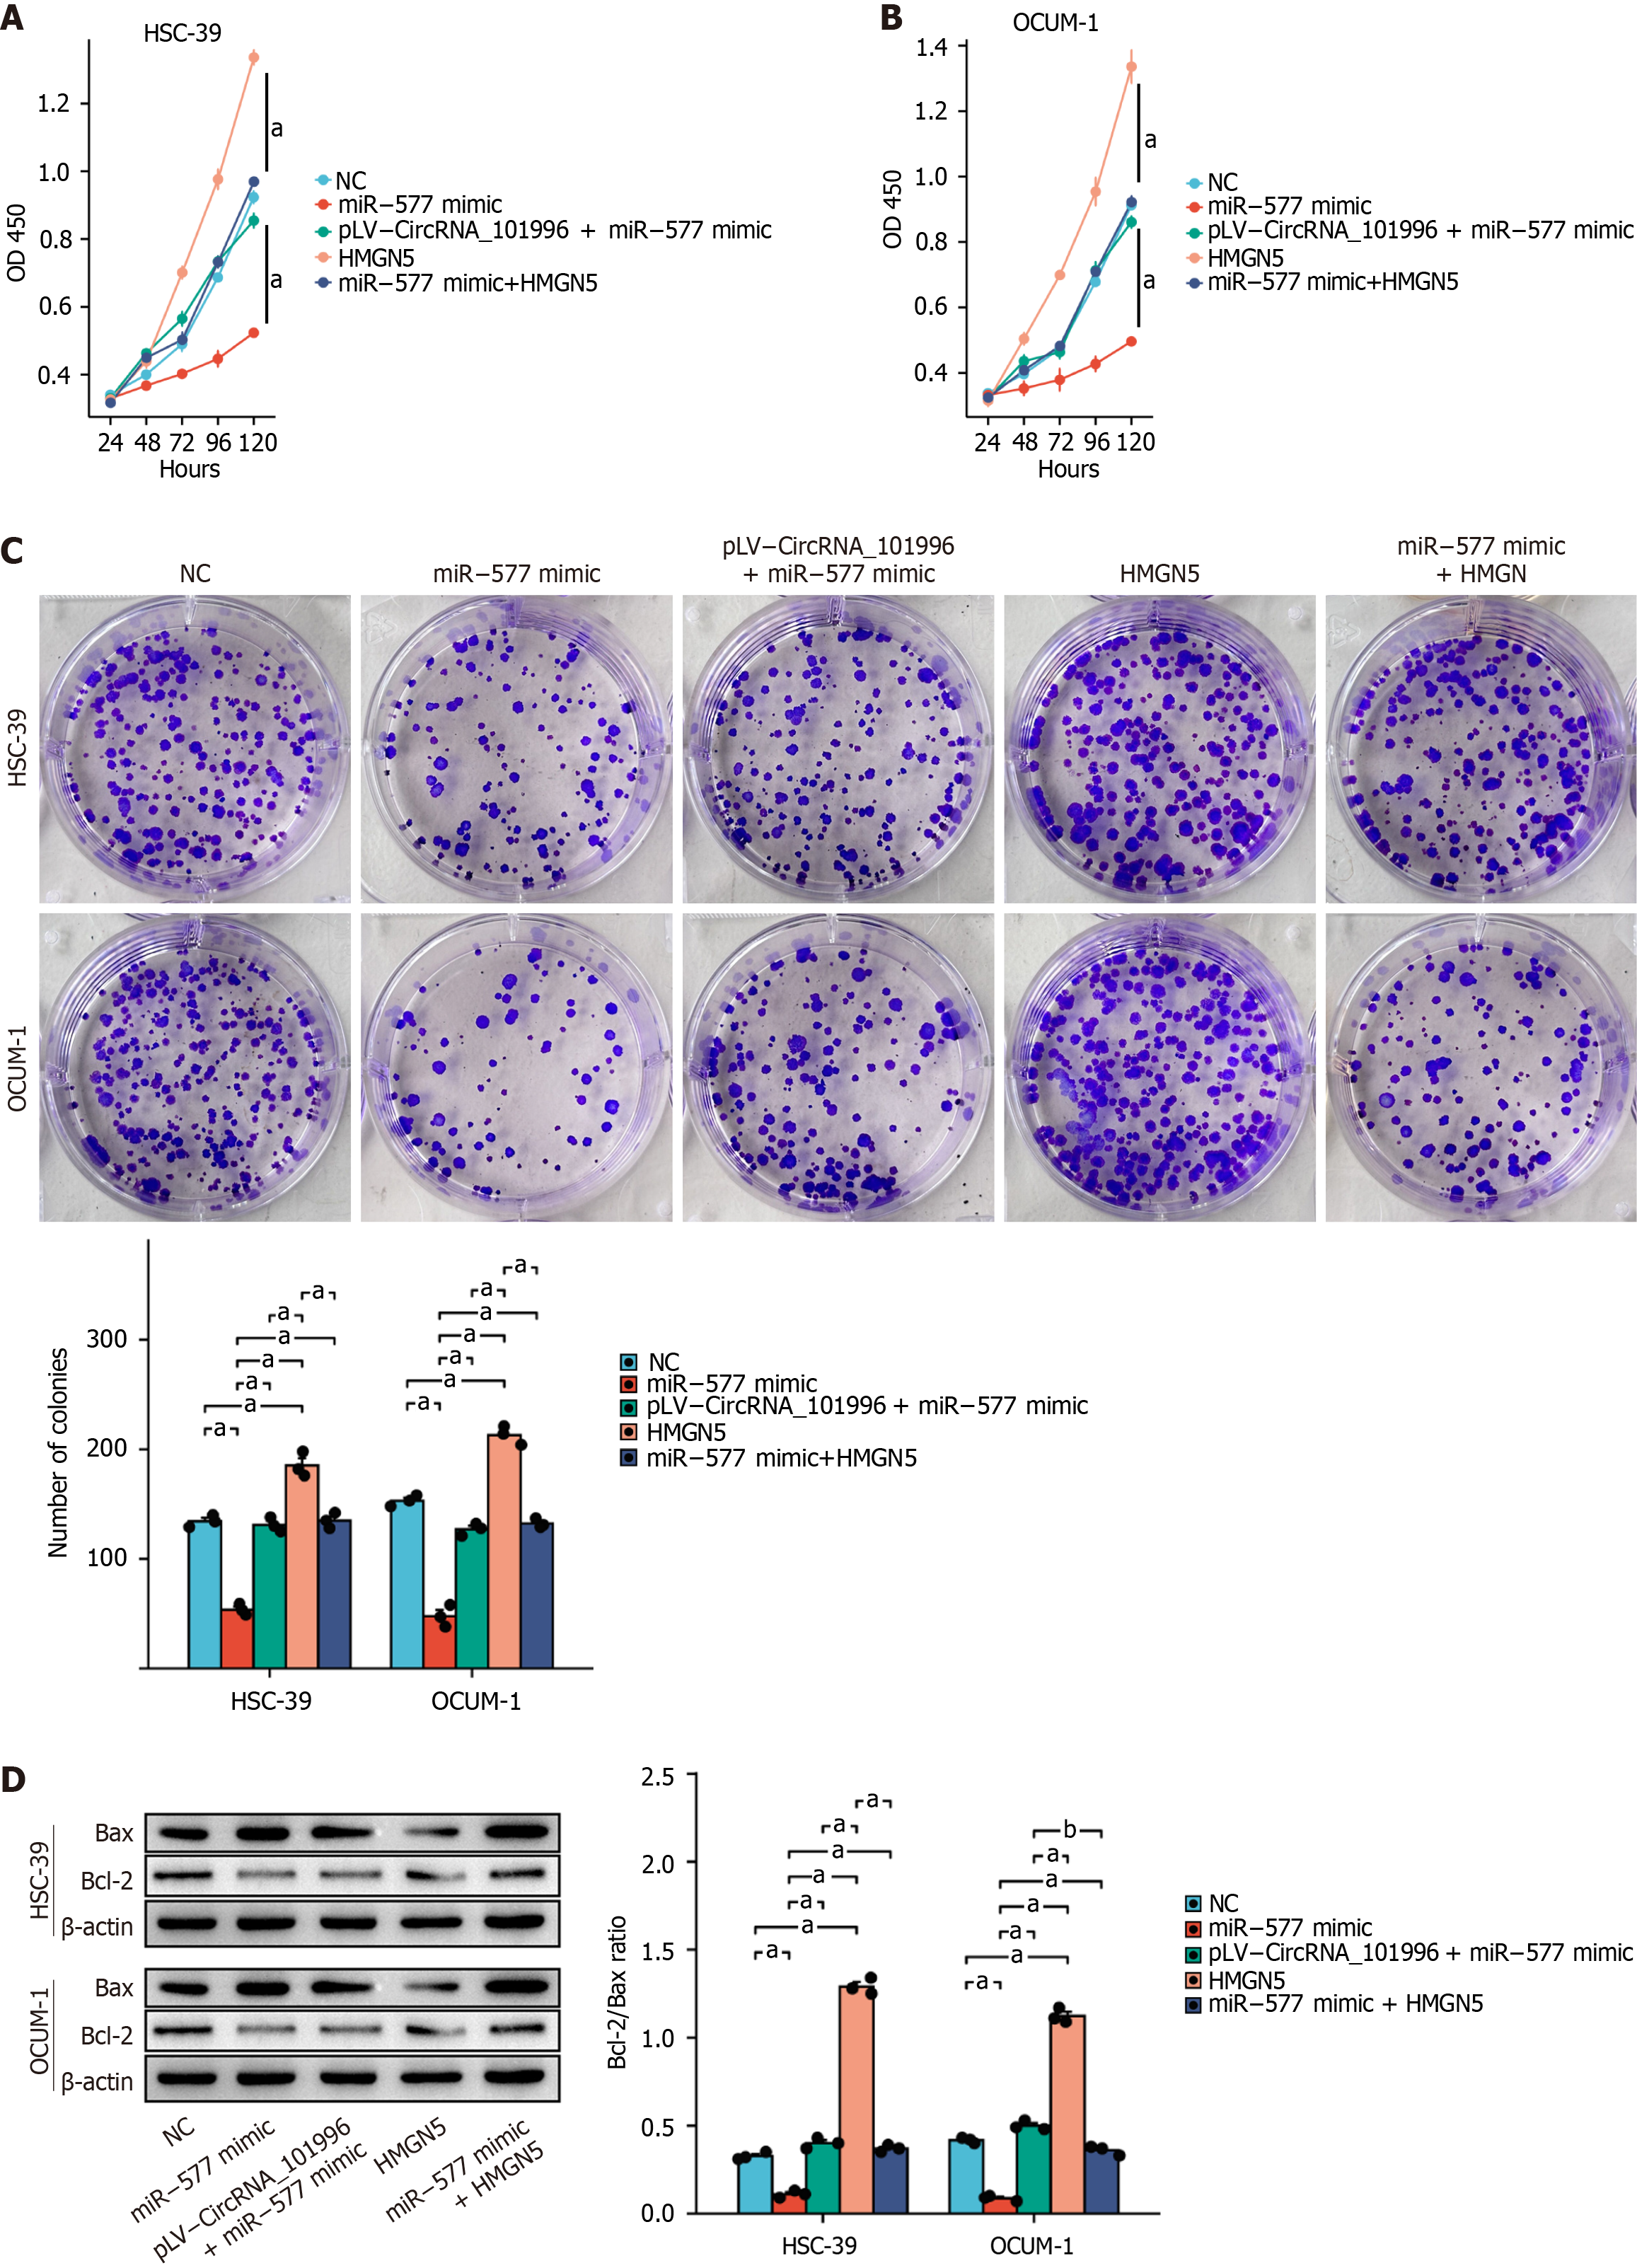
Figure 5 Hsa_circRNA_101996 promotes gastric cancer proliferation and suppresses apoptosis through the miR-577/HMGN5 axis.
A and B: MTT assay in OCUM-1 and HSC-39 cell lines; C: Colony formation assay in OCUM-1 and HSC-39 cell lines; D: Western blot assay. aP < 0.001; bP < 0.01. NC: Negative control.
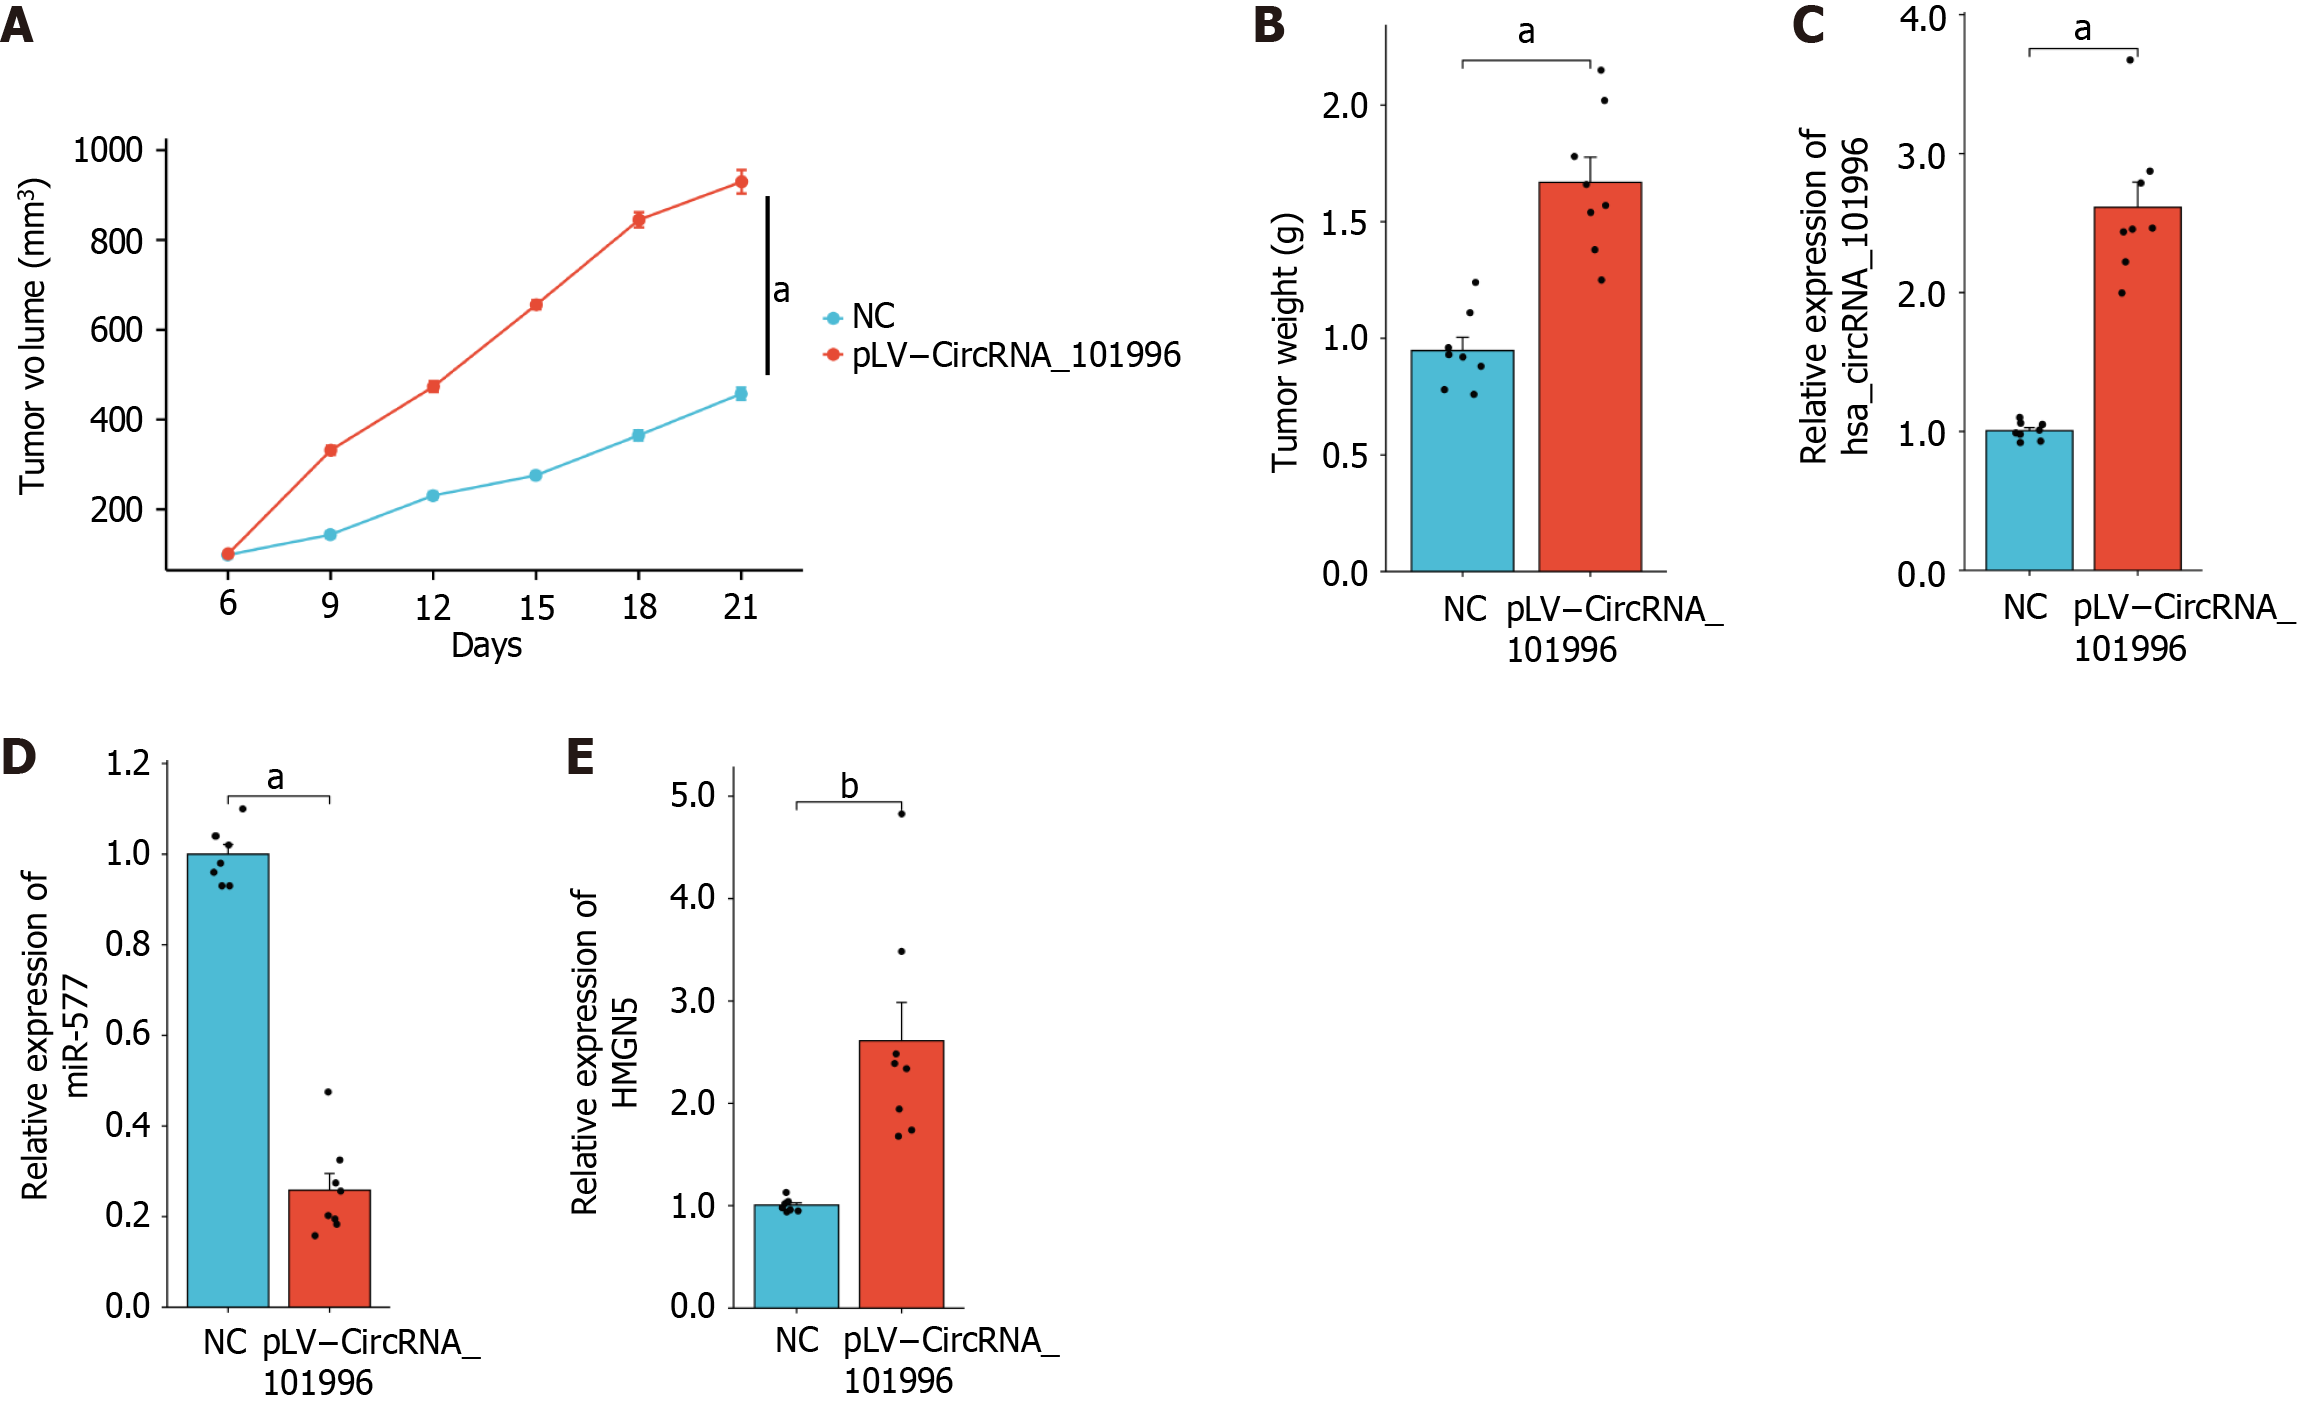
Figure 6 In vivo experimental validation of hsa_circRNA_101996 promoting gastric cancer growth via the miR-577/HMGN5 axis.
A and B: Tumor volume and weight; C-E: Expression levels of circRNA_101996, miR-577, and HMGN5. aP < 0.001; bP < 0.01. NC: Negative control.
- Citation: Wang XL, Zhang L, Shang Q. Circular RNA hsa_circRNA_101996 modulates gastric cancer cell proliferation and apoptosis through the miR-577/HMGN5 axis. World J Gastrointest Oncol 2025; 17(5): 105933
- URL: https://www.wjgnet.com/1948-5204/full/v17/i5/105933.htm
- DOI: https://dx.doi.org/10.4251/wjgo.v17.i5.105933


