Copyright
©The Author(s) 2025.
World J Gastrointest Oncol. May 15, 2025; 17(5): 104686
Published online May 15, 2025. doi: 10.4251/wjgo.v17.i5.104686
Published online May 15, 2025. doi: 10.4251/wjgo.v17.i5.104686
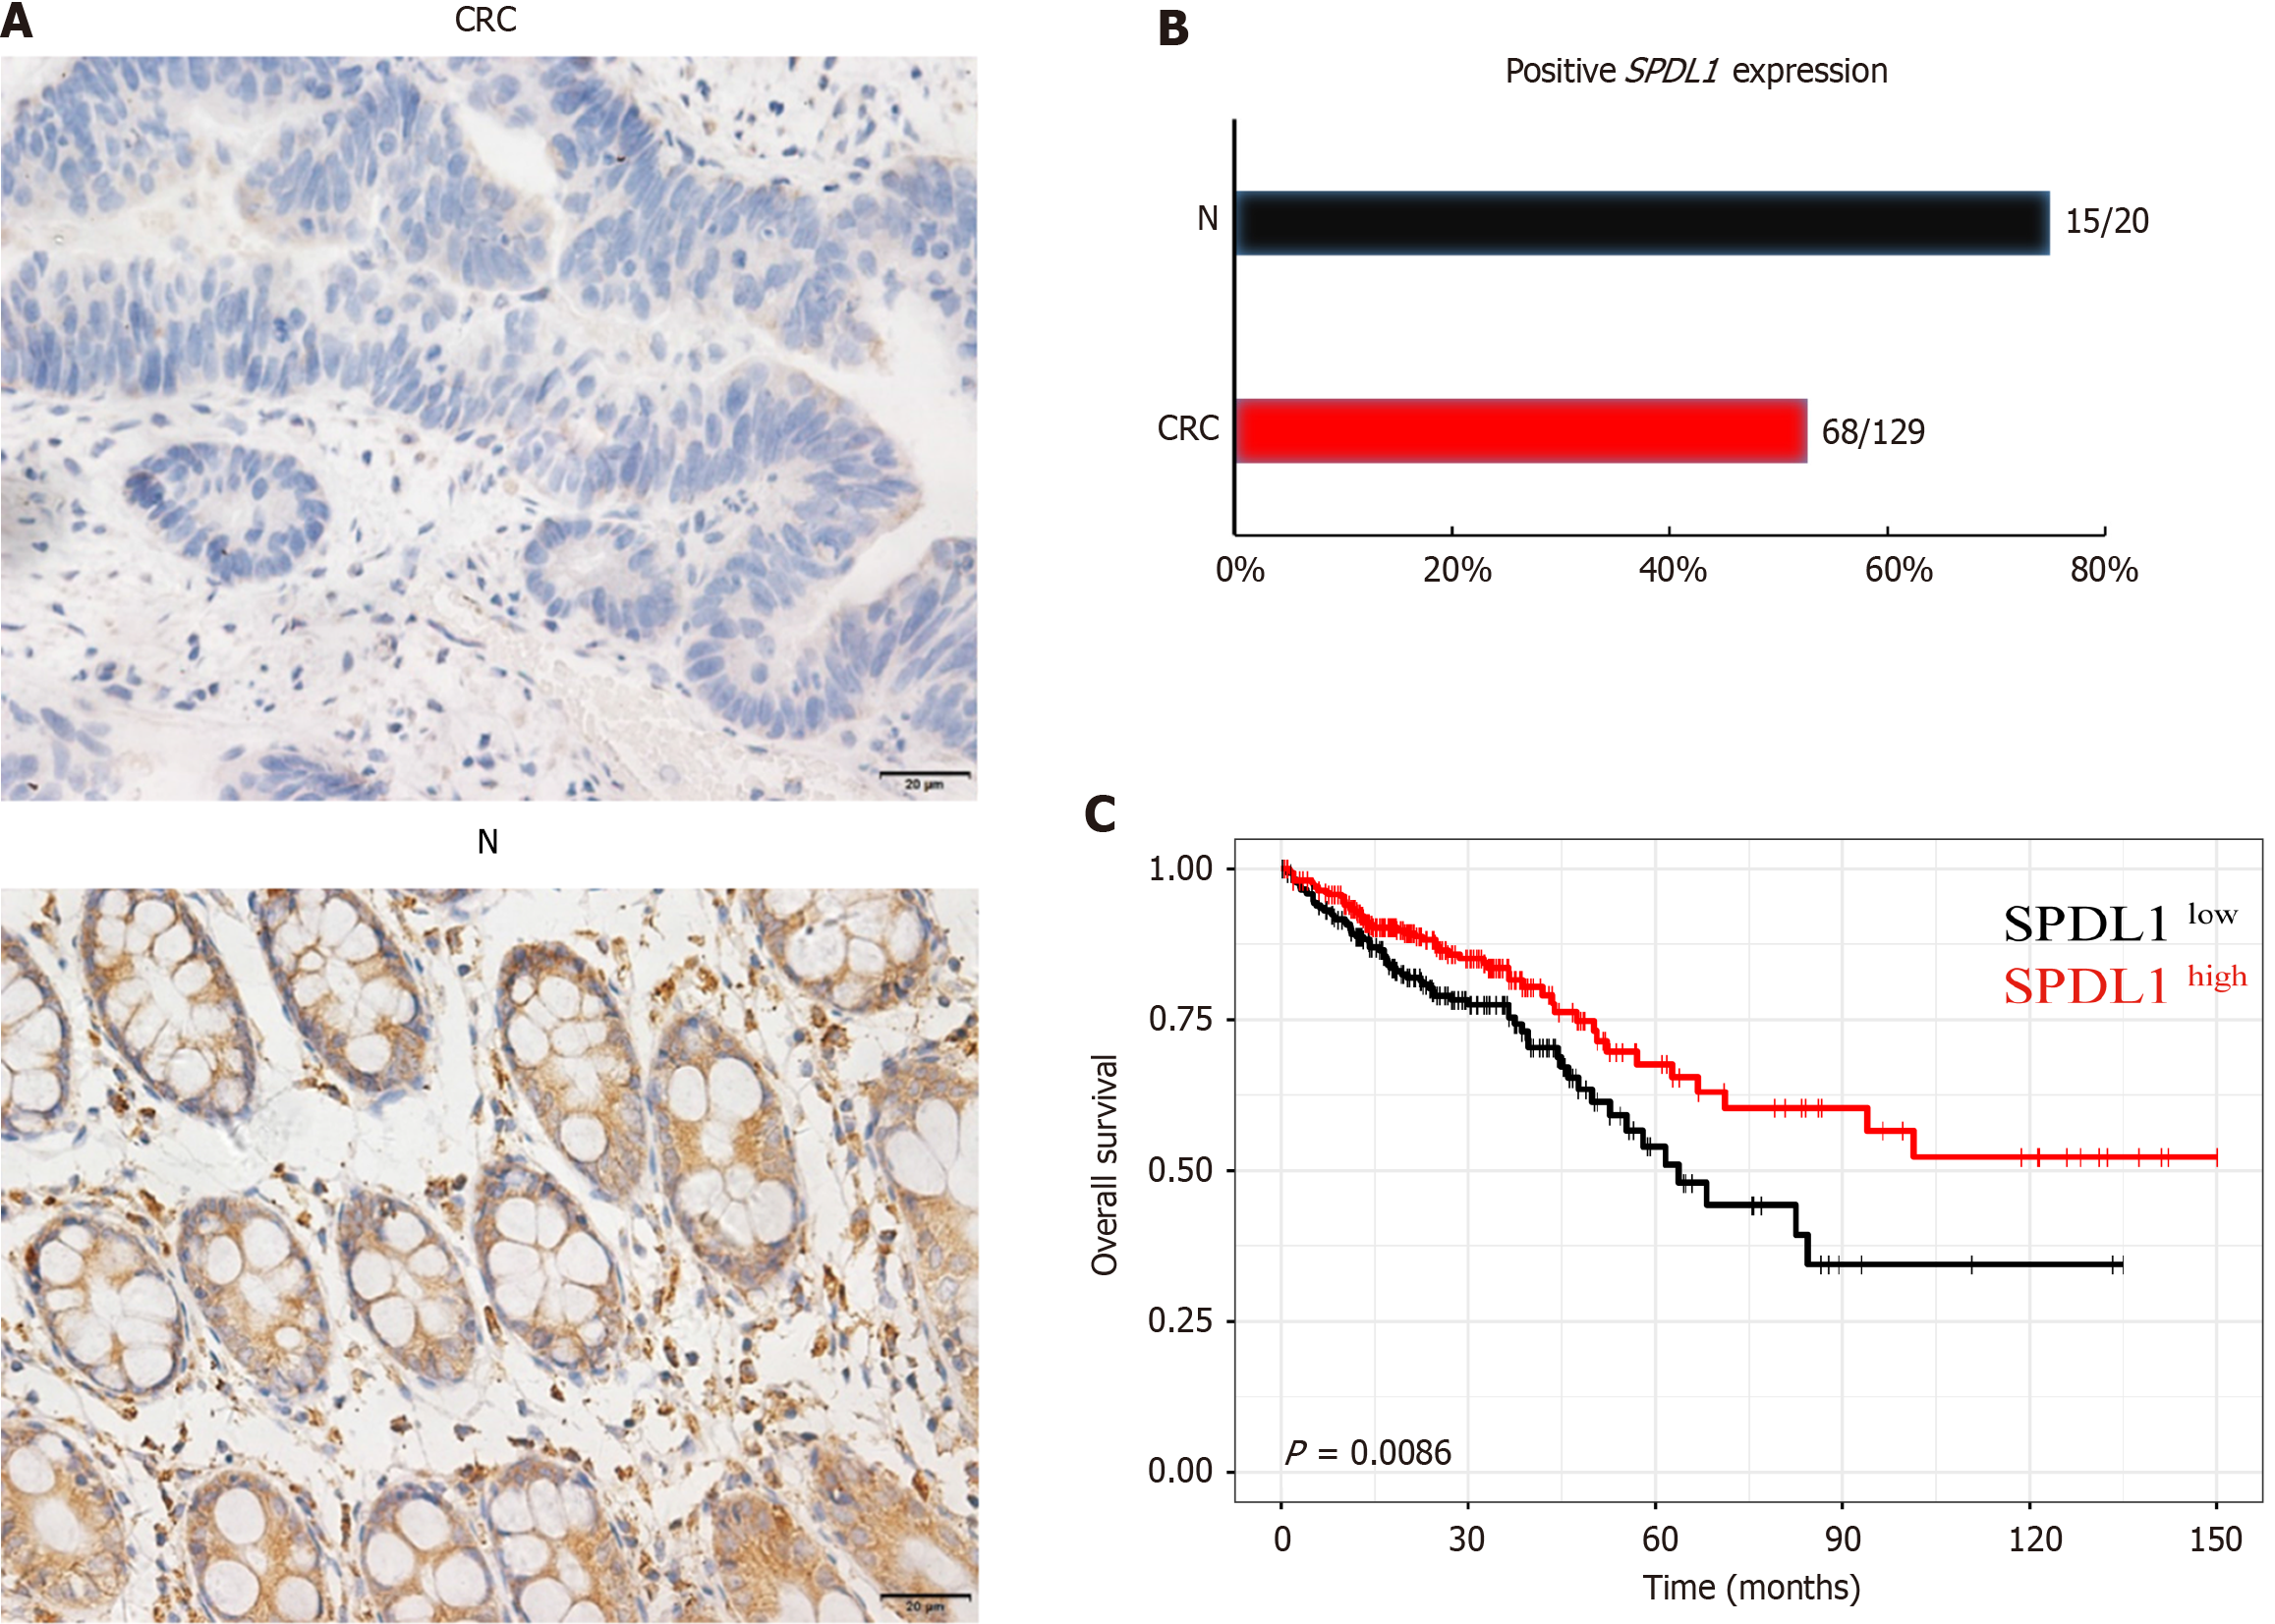
Figure 1 SPDL1 is expressed at lower levels in colorectal cancer tissues, and its lower expression is associated with poor patient.
A: SPDL1 expression in colorectal cancer (CRC) vs normal colorectal mucosa (N) (400 ×); B: Percentage of SPDL1 expression in CRC tissues and N; C: Comparison of overall survival in patients with CRC with high or low SPDL1 expression. CRC: Colorectal cancer; N: Normal colorectal mucosa.
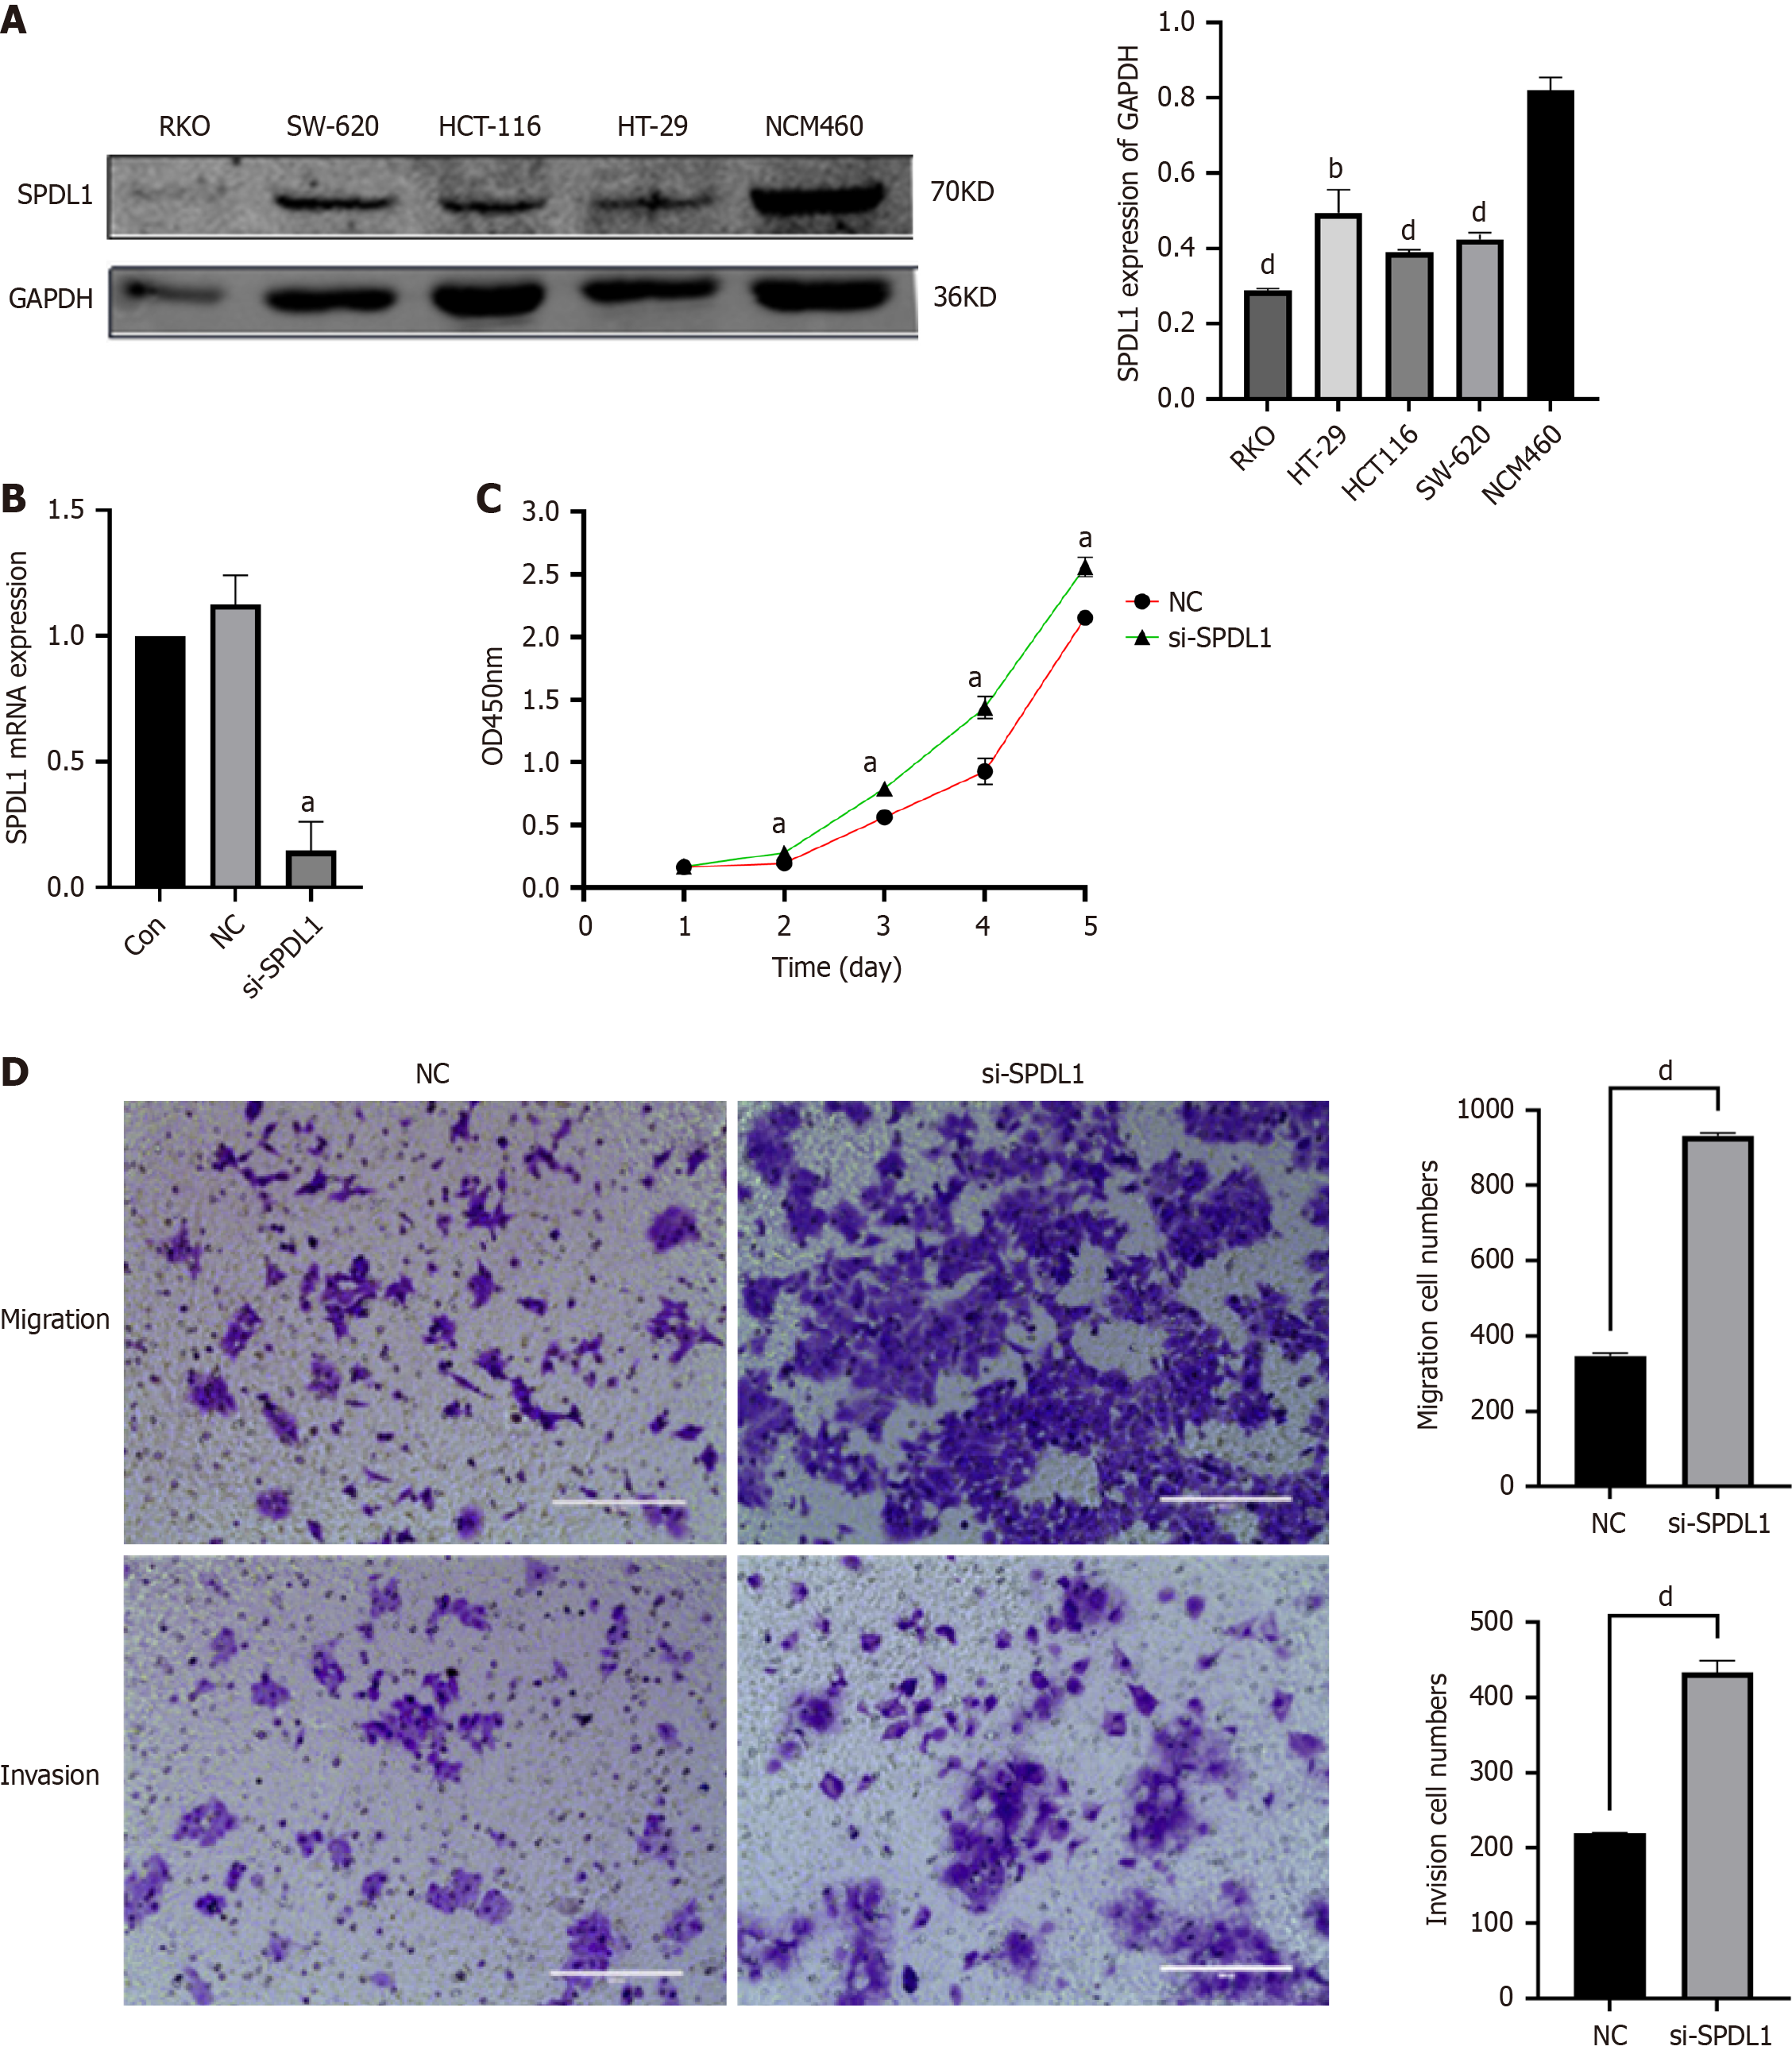
Figure 2 Small interfering RNA knockdown of SPDL1 promotes proliferation, migration and invasion of colorectal cancer cells.
A: Western blot showing the expression of SPDL1 protein in a non-cancerous colonic epithelial cell line and colorectal cancer cell lines; B: Quantitative reverse transcription-polymerase chain reaction showing siRNA knockdown of the SPDL1 gene; C: Cell counting kit-8 assay; D: Transwell assay. Data are presented as the mean ± SD from three independent experiments. aP < 0.05. bP < 0.01. dP < 0.0001. GAPDH: Glyceraldehyde-3-phosphate dehydrogenase; Con: Control; NC: Negative control; si-SPDL1: Small interfering RNA targeting SPDL1; OD: Optical density.
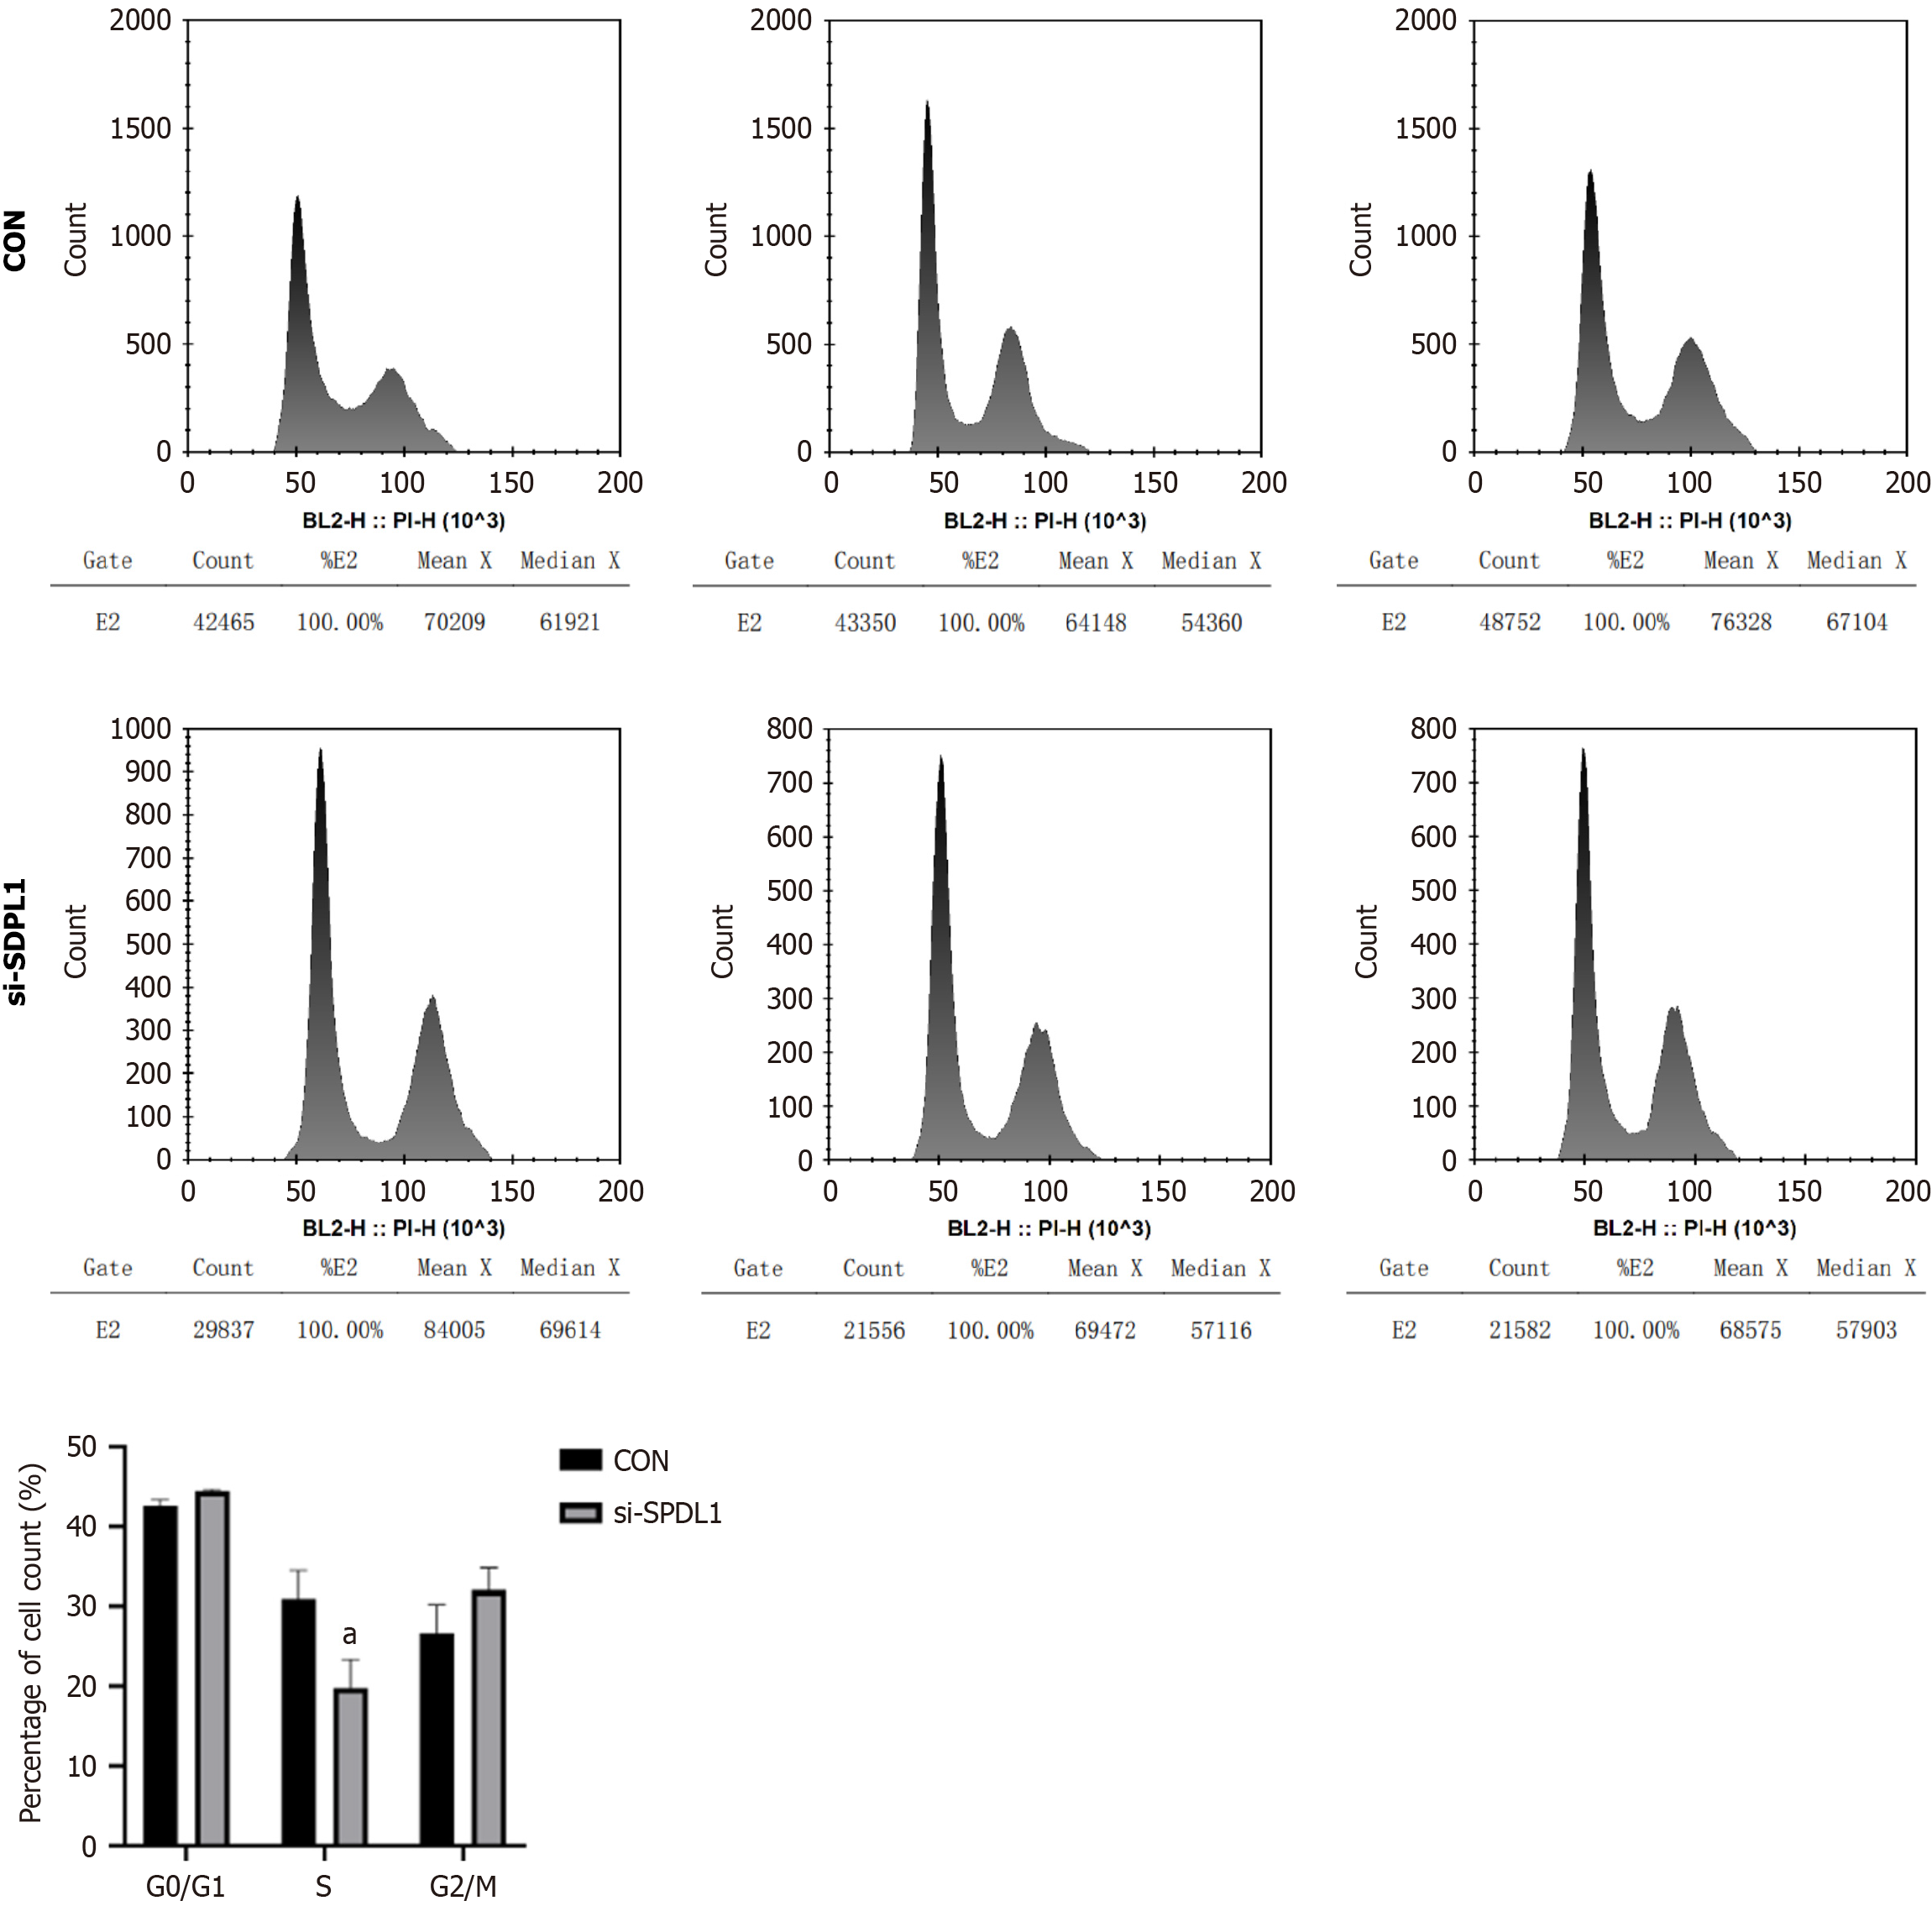
Figure 3 Effect of reduced SPDL1 expression on the cell cycle of colorectal cancer cells as measured by flow cytometry.
The data are presented as the mean ± SD from three independent experiments. aP < 0.05. Con: Control; si-SPDL1: Small interfering RNA targeting SPDL1.
Figure 4 Transcriptomics analysis.
A: Differential gene expression volcano map; B-D: Gene Ontology enrichment analysis; E: Kyoto Encyclopedia of Genes and Genomes enrichment analyses; F: Average expression of epidermal growth factor receptor; G: Average expression of protein kinase A; H: Mitogen-activated protein kinase signaling pathway-heatmap; I: Cell cycle signaling pathway-heatmap. aP < 0.05. si-SPDL1: Small interfering RNA targeting SPDL1; DEGS: Differentially expressed genes; GO: Gene Ontology; MCM: Minichromosome maintenance complex; CHOP: C/EBP homologous protein; ATP: Adenosine triphosphate; KEGG: Kyoto Encyclopedia of Genes and Genomes; MAPK: Mitogen-activated protein kinase; EGFR: Epidermal growth factor receptor; PKA: Protein kinase A; TPM: Transcripts per million.
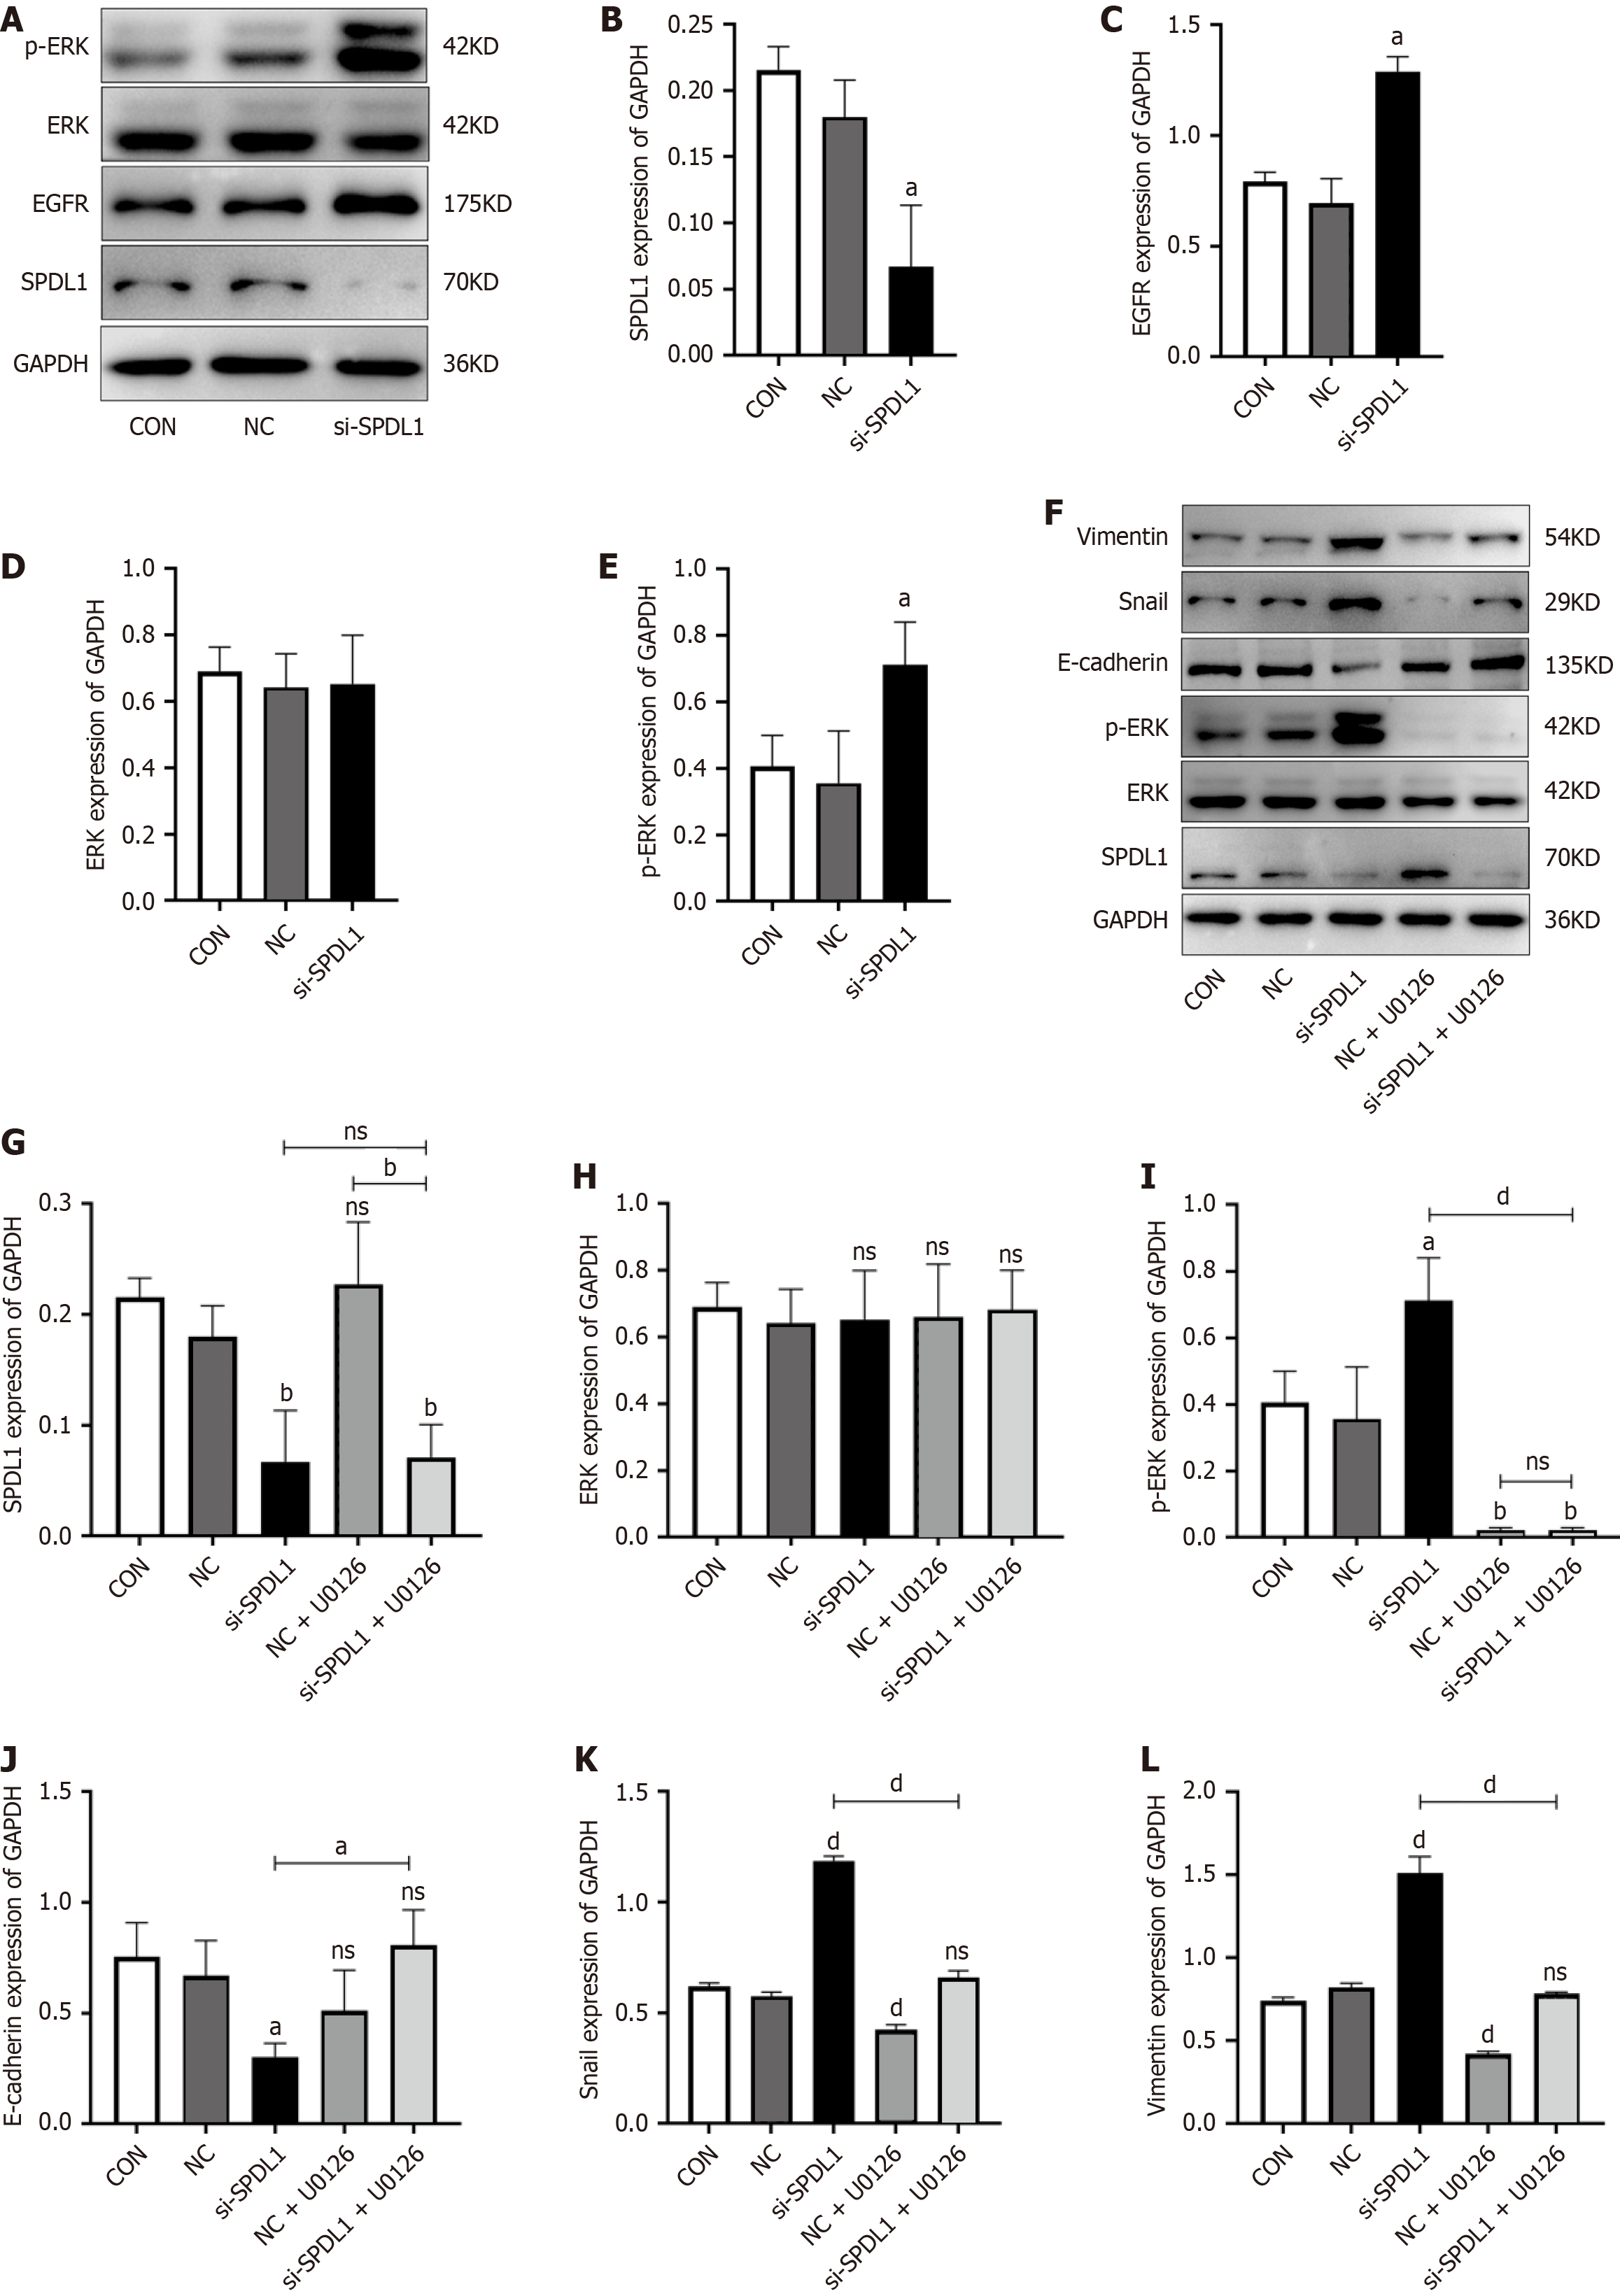
Figure 5 SPDL1 affects the expression of proteins related to epithelial-mesenchymal transition, epidermal growth factor receptor/extracellular signal-regulated kinase signaling pathway.
A: Representative Western blot images after SPDL1 knocked down in HCT116 cells; B-E: Quantification of Western blot data in (A); F: Representative Western blot images. Cells were treated with U0126 and analyzed by Western blot; G-L: Quantification of Western blot data in (F). Data are presented as the mean ± SD from three independent experiments. aP < 0.05. bP < 0.01. dP < 0.0001. ns: Not significant; ERK: Extracellular signal-regulated kinase; p-ERK: Phospho-extracellular signal-regulated kinase; EGFR: Epidermal growth factor receptor; GAPDH: Glyceraldehyde-3-phosphate dehydrogenase; Con: Control; NC: Negative control; si-SPDL1: Small interfering RNA targeting SPDL1.
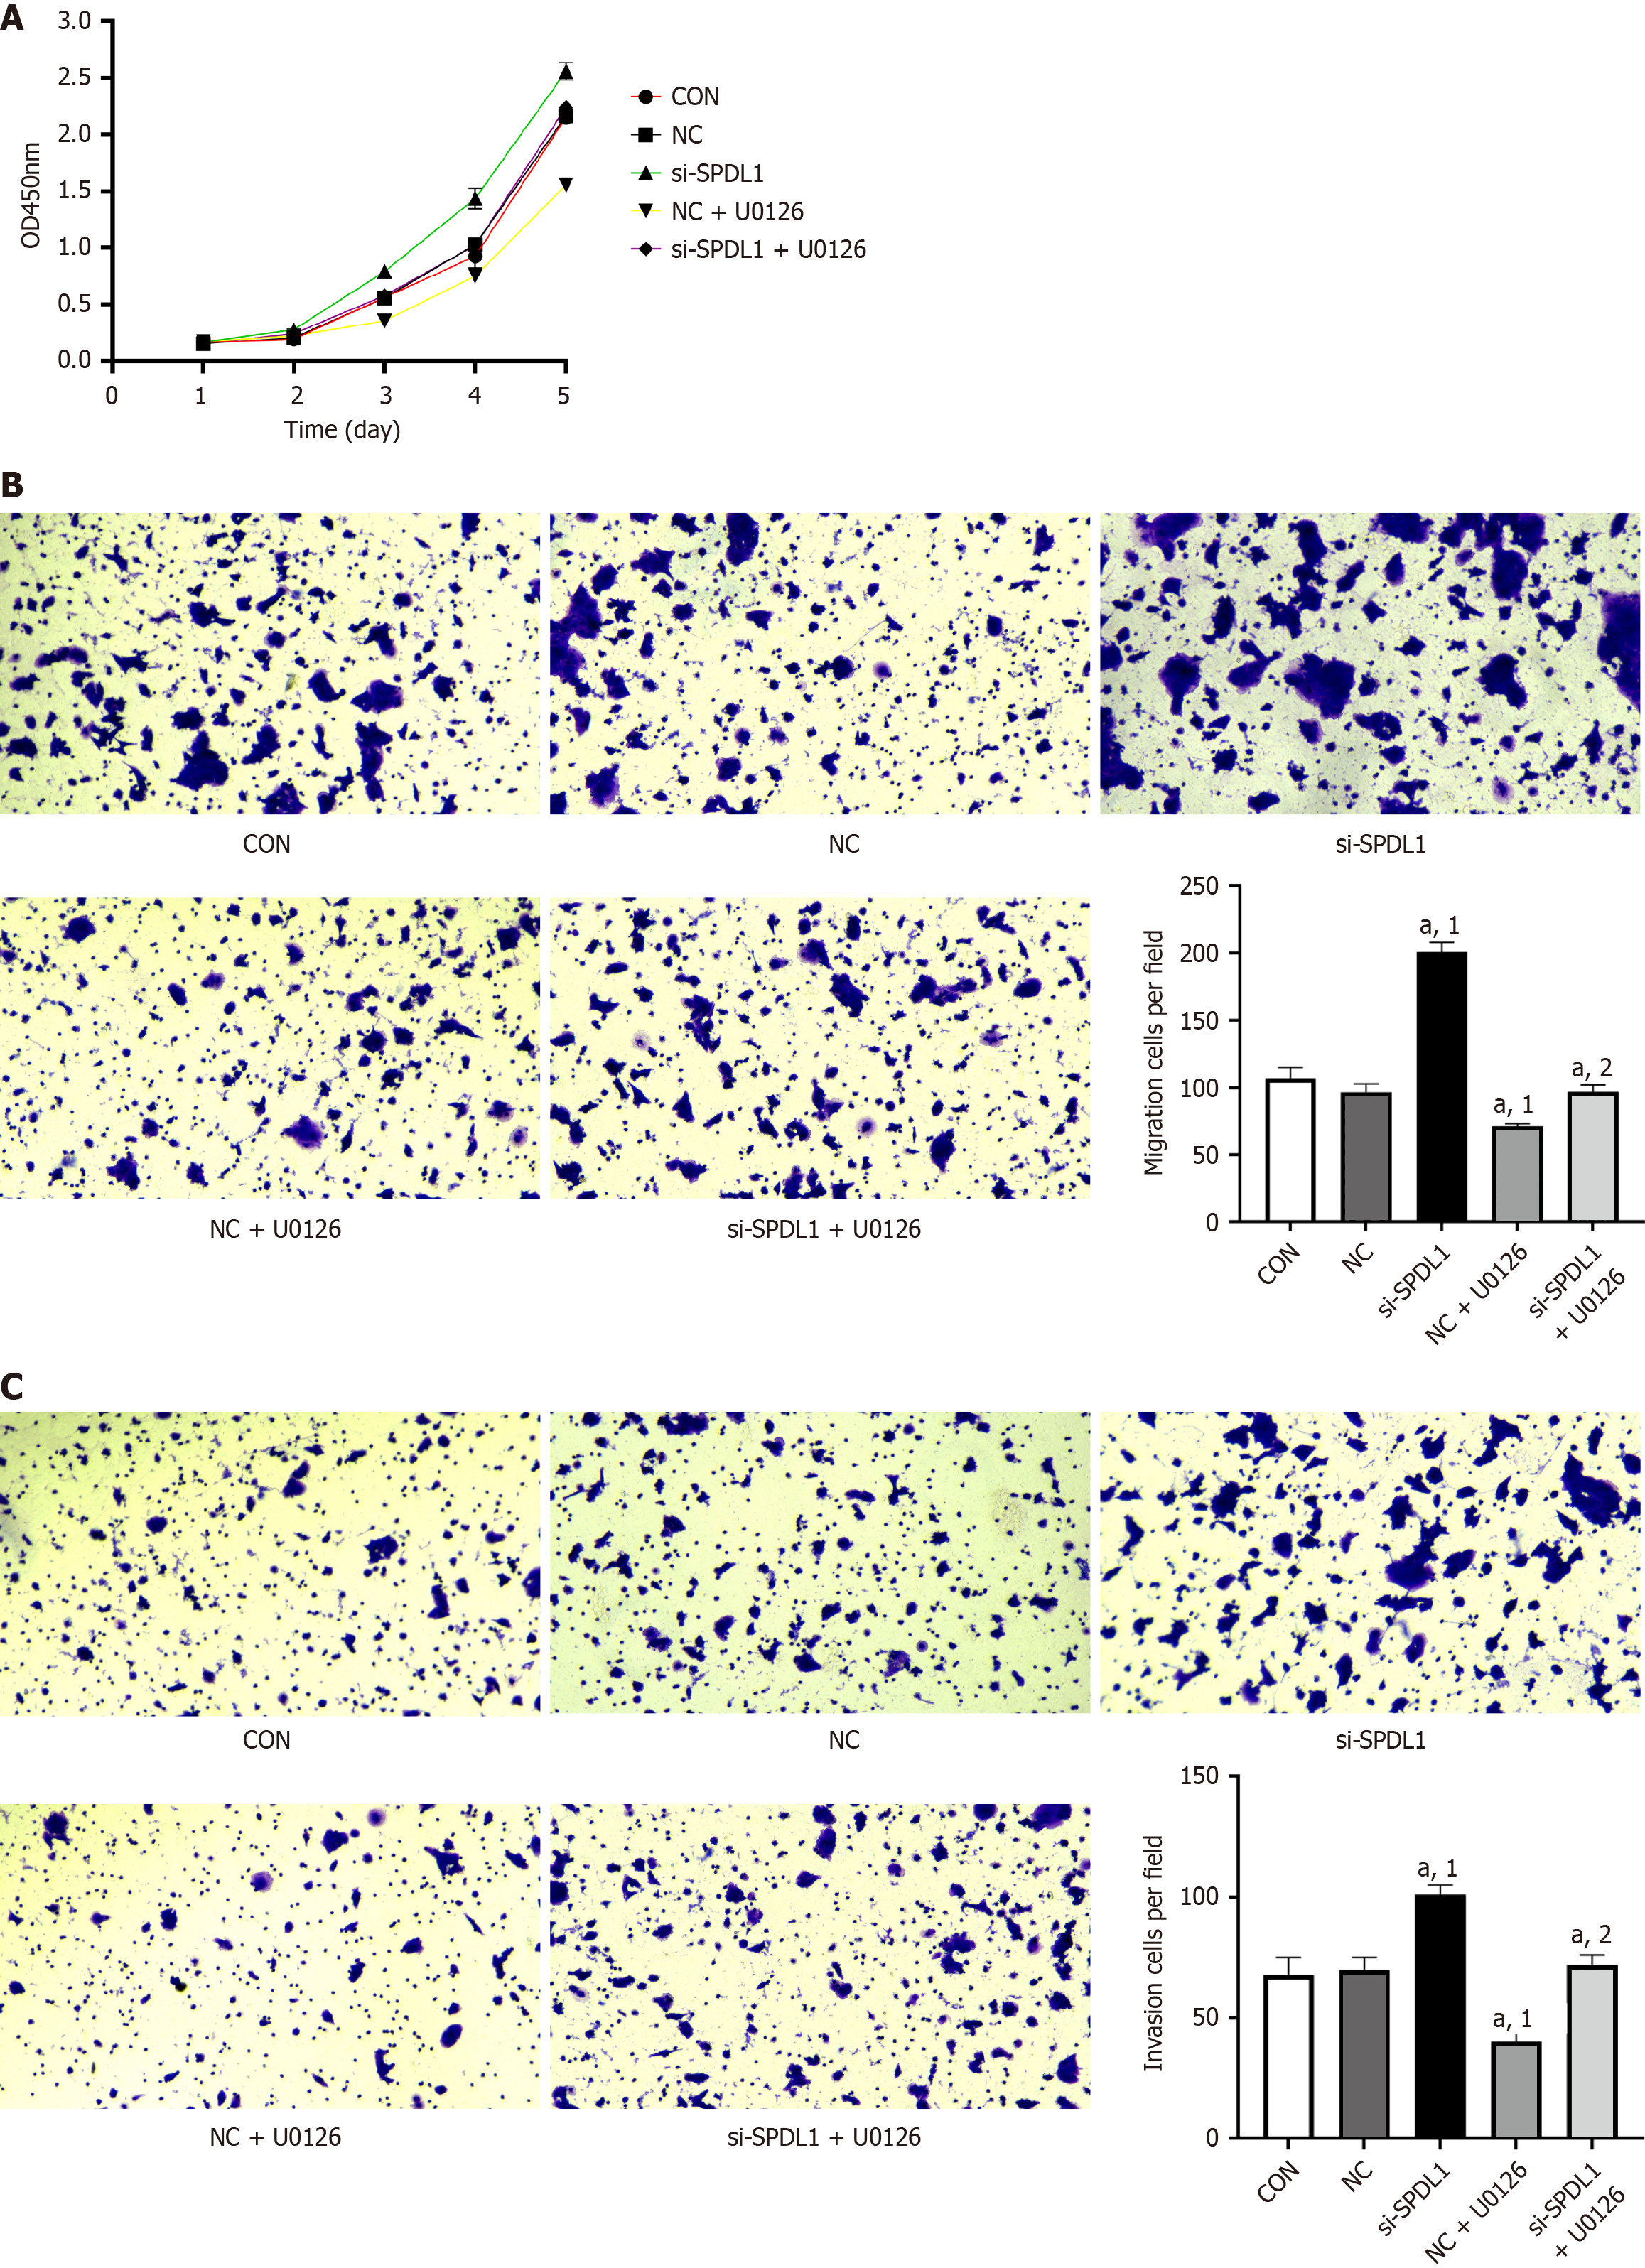
Figure 6 SPDL1 inhibits the malignant biological behaviour of HCT116 cells.
A: Cell counting kit-8 assay; B and C: Transwell migration assay (magnification, 100 ×). The data are presented as the mean ± SD from three independent experiments. aP < 0.05. 1P vs negative control group. 2P vs negative control + U0126 group. Con: Control; NC: Negative control; si-SPDL1: Small interfering RNA targeting SPDL1; OD: Optical density.
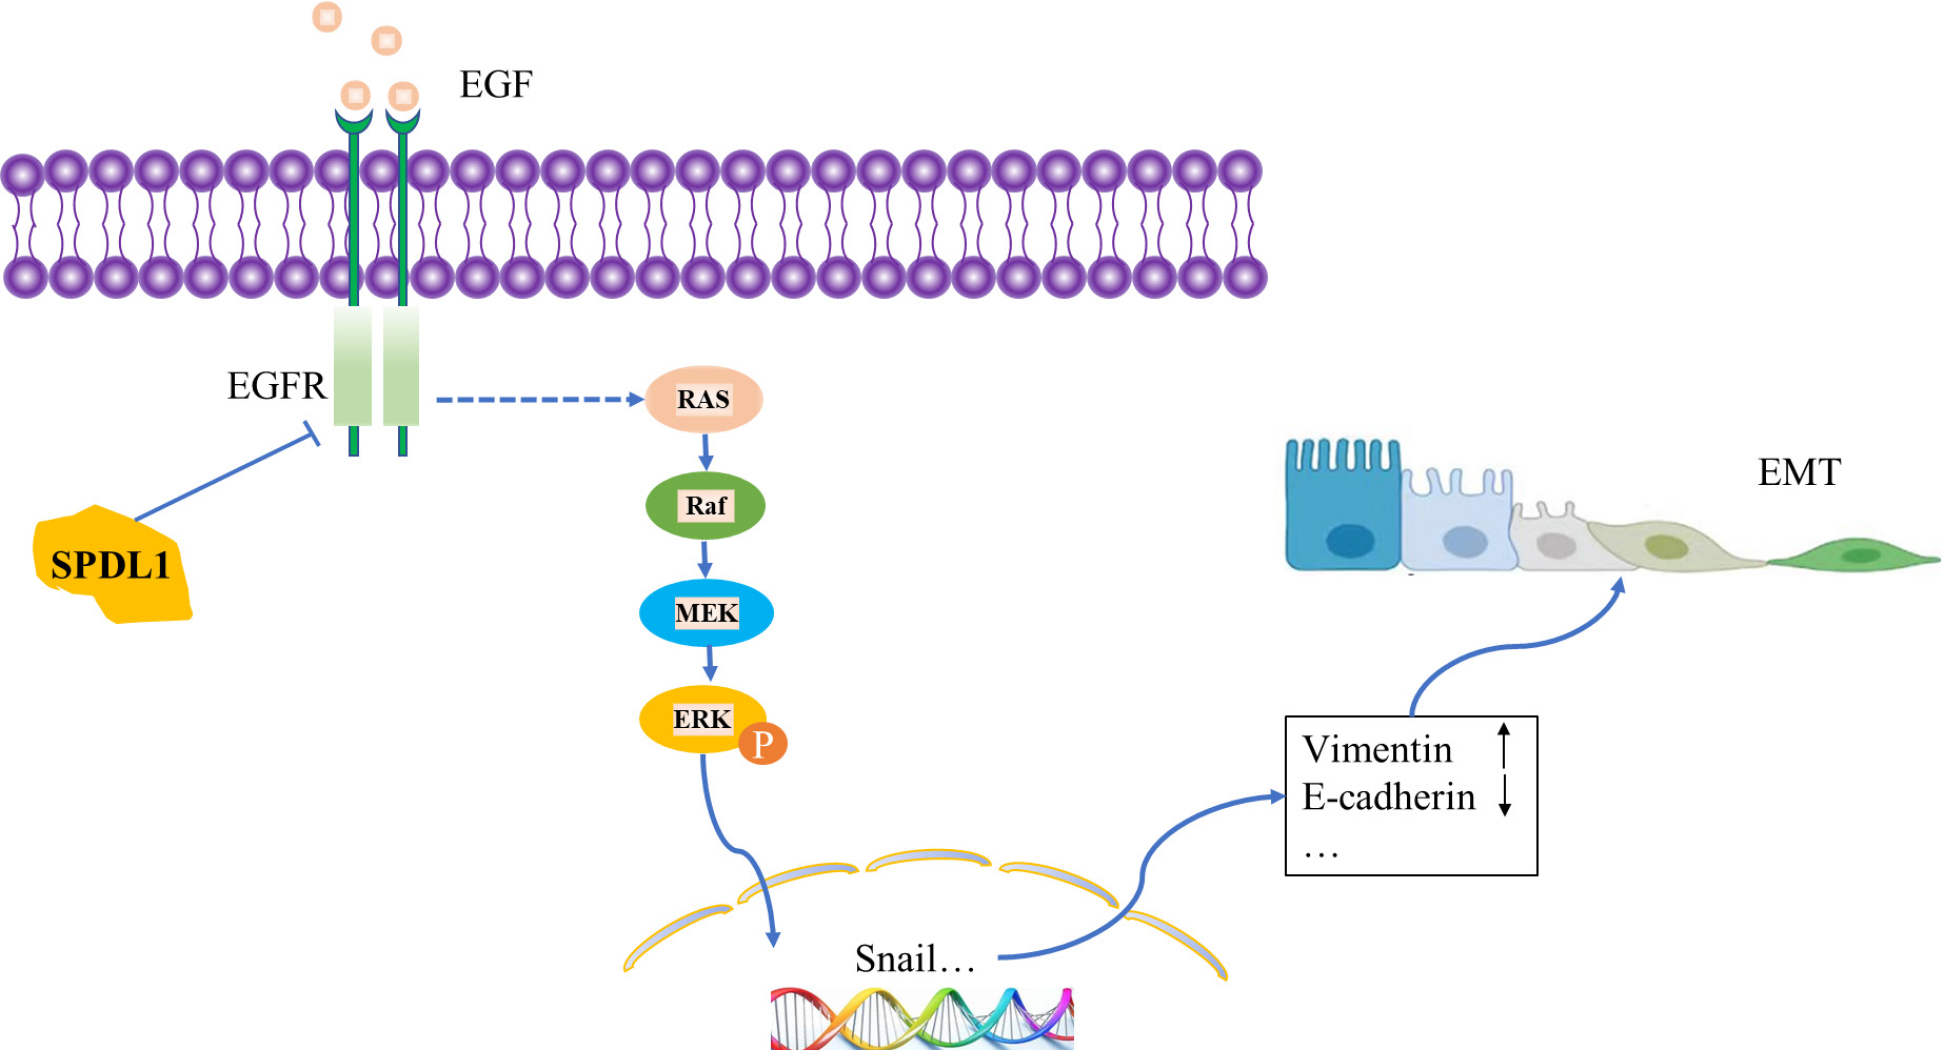
Figure 7 Proposed pathway by which reduced SPDL1 expression leads to epithelial-mesenchymal transition and promotes cell migration and invasion in colorectal cancer.
EGF: Epidermal growth factor; EGFR: Epidermal growth factor receptor; MEK: Mitogen-activated protein kinase; ERK: Extracellular signal-regulated kinase; EMT: Epithelial-mesenchymal transition.
- Citation: Peng P, Sun J, Li MS, Cheng RX, Liu SQ, Qin MB, Zhang JX, Huang JA. SPDL1 inhibition enhances colorectal cancer progression via epidermal growth factor receptor/extracellular signal-regulated kinase pathways. World J Gastrointest Oncol 2025; 17(5): 104686
- URL: https://www.wjgnet.com/1948-5204/full/v17/i5/104686.htm
- DOI: https://dx.doi.org/10.4251/wjgo.v17.i5.104686


