Copyright
©The Author(s) 2003.
World J Gastroenterol. Dec 15, 2003; 9(12): 2751-2758
Published online Dec 15, 2003. doi: 10.3748/wjg.v9.i12.2751
Published online Dec 15, 2003. doi: 10.3748/wjg.v9.i12.2751
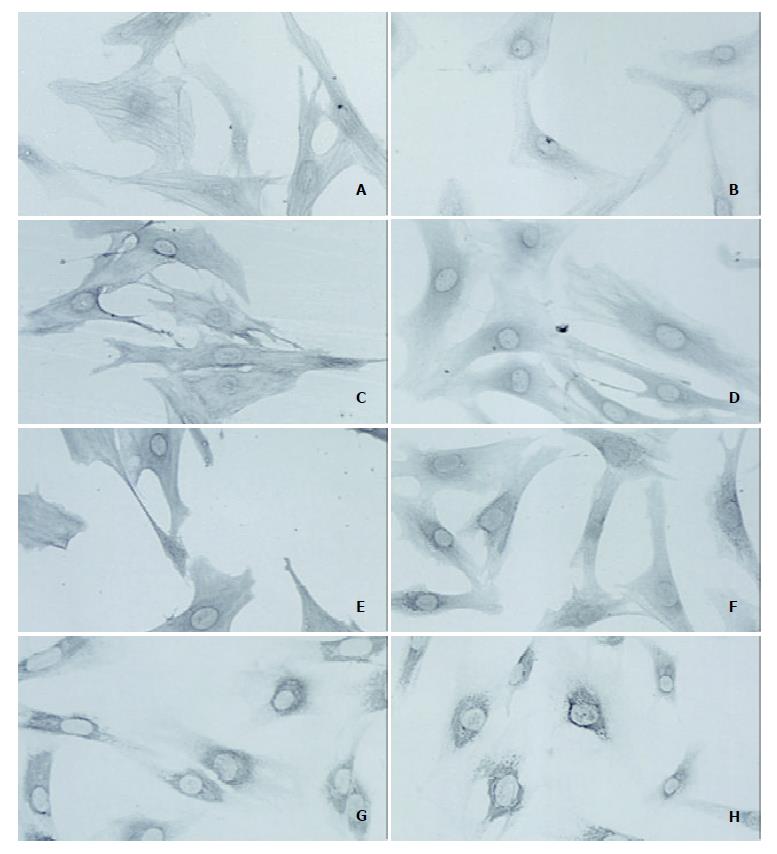
Figure 1 SIPS expressed cytoskeletal proteins and extracellular matrix proteins.
Cells were grown directly on slides. Immunostaining for α-SMA (A), glial fibrillary acidic protein (B), vimentin (C), desmin (D), type I collagen (E), fibronectin (F), and prolyl hydroxy-lases (α) (G) and (β) (H) was performed using a streptavidin-biotin-peroxidase complex detection kit. Original magnification: ×20 objective.
Figure 2 SIPS cells were negative for SA-β-Gal.
SIPS cells (A), SAM-K cells (B), and late-passage (passage 20) PSCs (C) were grown directly on slides, fixed, and stained with β-Gal staining solution, adjusted to pH 6.0, for 16 hours at 37 °C. After washed, the slides were viewed under light microscope. SA-β-Gal was not detected in SIPS and in SAM-K cells, but was detected in late-passage PSCs (arrows). Original magnification: ×20 objective.
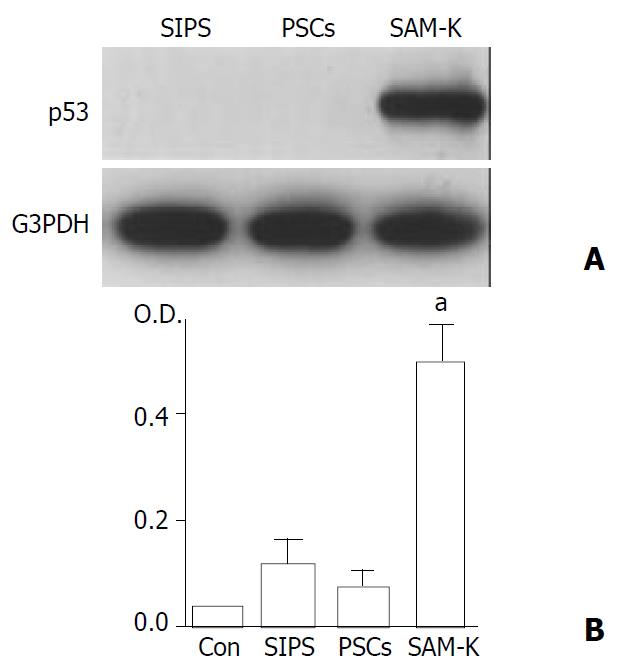
Figure 3 p53 expression and telomerase activity were nega-tive in SIPS cells.
(A) Total cell lysates (approximately 100 μg) were prepared from SIPS, primary PSCs (passage 3), and SAM-K cells. The level of p53 was determined by Western blotting. The level of G3PDH was also determined as a loading control. (B) Telomerase activity was measured utilizing the TRAP by enzyme-linked immunosorbent assay. The telomerase activity was determined by differences in absorbance at O.D.450-O.D. 690. Negative control was prepared by incubating the total cell extracts with ribonuclease A. The mean of the absorbance in negative control was subtracted from those of the samples, and the samples were regarded as telomerase positive (“a”) if the difference in absorbance was higher than 0.2. Data are shown as mean ± SD (n = 6).
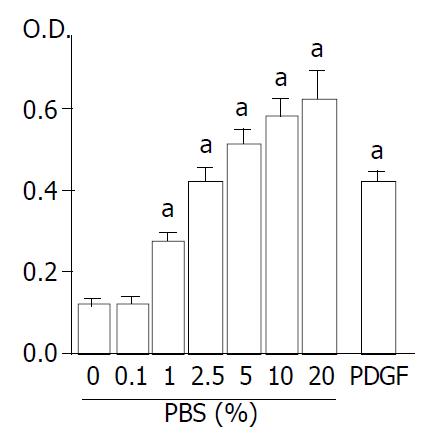
Figure 4 Proliferation of SIPS cells was serum-dependent and stimulated with PDGF-BB.
SIPS cells were treated with FBS (at the indicated concentrations) or PDGF-BB (at 25 ng/ml. After 24-hour-incubation, cells were labeled with BrdU for 3 hours. Cells were then fixed, and incubated with peroxidase-conju-gated anti-BrdU antibody. Then the peroxidase substrate 3,3’, 5,5’-tetramethylbenzidine was added, and BrdU incorporation was quantitated by differences in absorbance at wavelength 370 minus 492 nm (“O.D.”). Data are shown as mean ± SD (n = 6). aP < 0.01 vs. serum-free medium only. O.D.: optical density.
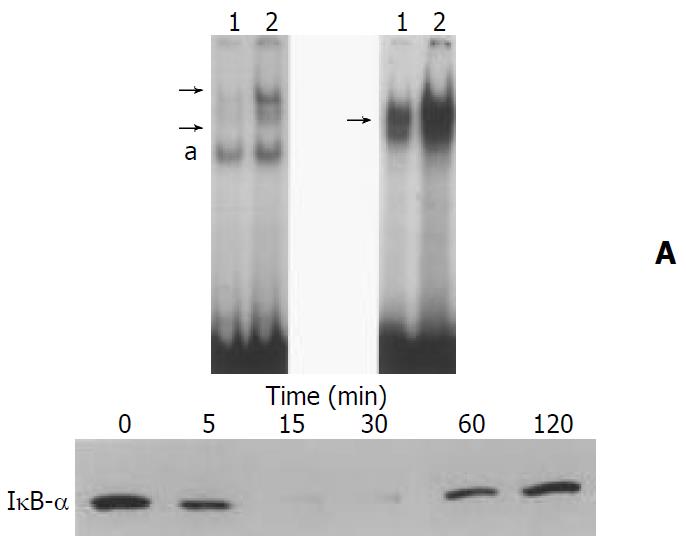
Figure 5 IL-1β activated NF-κB and AP-1 in SIPS cells.
(A, B) SIPS cells were treated with IL-1β (at 2 ng/ml, lane 2) for 1 hour. Nuclear extracts were prepared, and specific binding activities of NF-κB (panel A) and AP-1 (panel B) were assessed by electro-phoretic mobility shift assay. Arrows denote specific inducible complexes competitive with cold double-stranded oligonucle-otide probes. Lane 1: control (medium only). a: non-specific band. (C) SIPS cells were treated with IL-1β for indicated times. Total cell lysates (approximately 100 μg) were prepared, and the level of IκB-α was determined by Western blotting.
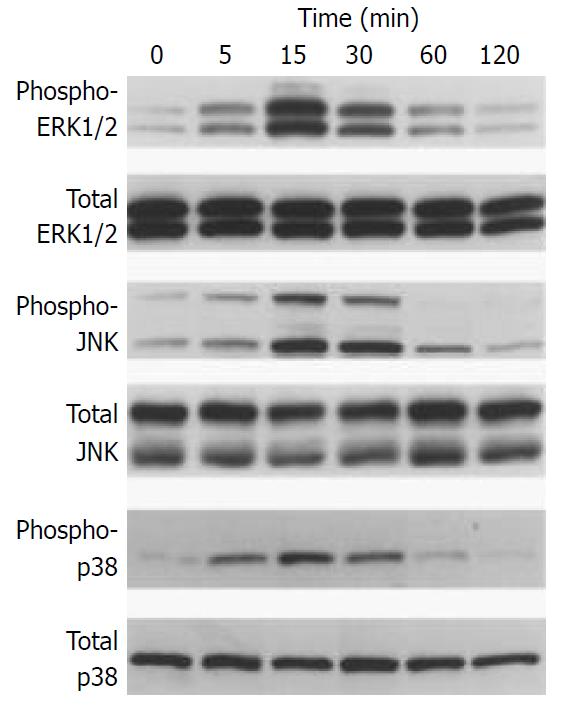
Figure 6 IL-1β activated MAP kinases.
SIPS cells were treated with IL-1β (at 2 ng/ml) for the indicated time. Total cell ly-sates (approximately 100 μg) were prepared, and the levels of activated, phosphorylated MAP kinases were determined by Western blotting. The levels of total MAP kinases were also determined.
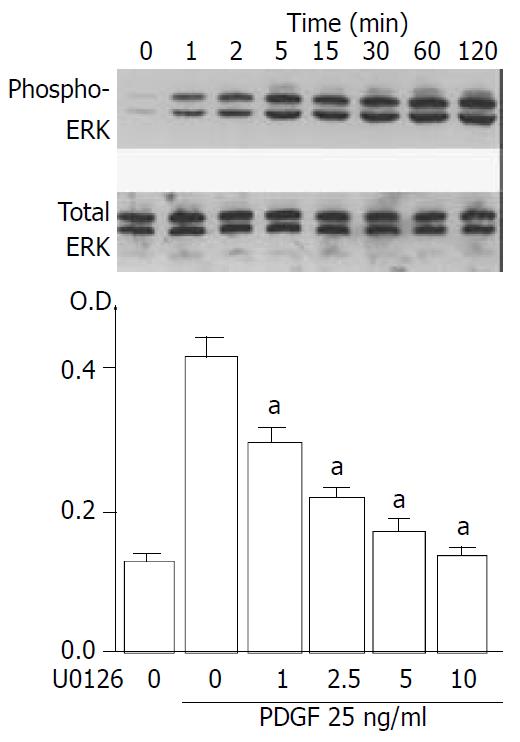
Figure 7 PDGF-BB induced proliferation of SIPS cells through ERK pathway.
(A) SIPS cells were treated with PDGF-BB (at 25 ng/ml) for the indicated time. Total cell lysates (approximately 100 μg) were prepared, and the level of activated, phosphorylated ERK was determined by Western blotting. The level of total ERK was also determined. (B) SIPS cells were treated with PDGF-BB (at 25 ng/ml) in the presence of U0126 at the indicated concentrations (at μM). After 24-hour-incubation, cells were labeled with BrdU for 3 hours. Cells were fixed, and incubated with peroxidase-conjugated anti-BrdU antibody. Then the peroxidase substrate 3,3’,5,5’-tetramethylbenzidine was added, and BrdU incorporation was quantitated by differences in absorbance at O.D.370-O.D.492. Data are shown as mean ± SD (n = 6). aP < 0.01 versus PDGF only. O.D.: optical density.
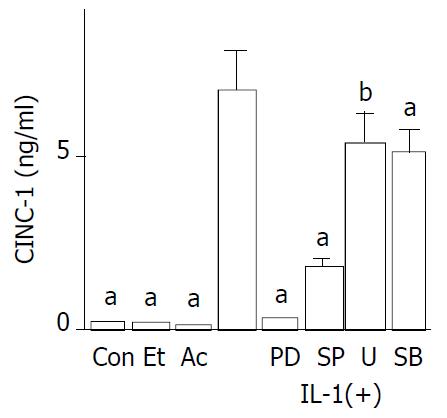
Figure 8 IL-1β induced CINC-1 expression.
SIPS cells were left untreated, or treated with IL-1β (IL; at 2 ng/ml) in the absence or presence of PDTC (“PD” at 10 μM), SP600125 (“SP” at 10 μM), U0126 (“U” at 5 μM), or SB202190 (“SB” at 25 μM). After 24 hours, CINC-1 levels in the culture supernatant were determined by enzyme immunoassay. The effects of ethanol (“Et” at 50 mM) and acetaldehyde (“Ac” at 200 μM) were also examined. Con: control (medium only). Data shown are expressed as means ± SD (n = 6). aP < 0.01, bP < 0.05 versus IL-1β only.
- Citation: Masamune A, Satoh M, Kikuta K, Suzuki N, Shimosegawa T. Establishment and characterization of a rat pancreatic stellate cell line by spontaneous immortalization. World J Gastroenterol 2003; 9(12): 2751-2758
- URL: https://www.wjgnet.com/1007-9327/full/v9/i12/2751.htm
- DOI: https://dx.doi.org/10.3748/wjg.v9.i12.2751


