Copyright
©The Author(s) 2001.
World J Gastroenterol. Jun 15, 2001; 7(3): 324-330
Published online Jun 15, 2001. doi: 10.3748/wjg.v7.i3.324
Published online Jun 15, 2001. doi: 10.3748/wjg.v7.i3.324
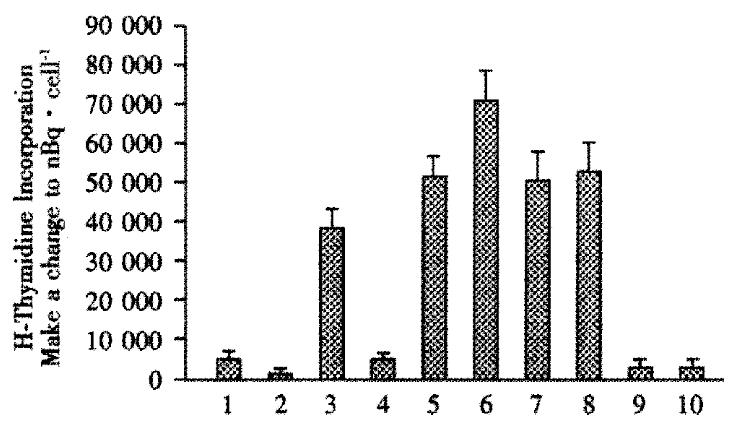
Figure 1 Mixed lymphocyte assays.
Rat spleen (responder) cells, from 3 rats per group, were incubated either alone, or with (stimulator) irradiated primary human hepatocytes, IMR-90 human fibroblasts, or 293 human kidney cells in the presence of 3H-thymidine. The incorporation of radioactivity was used as a measure of proliferation of rat spleen cells induced by exposure to foreign cells. When performed, rats were intrafetally injected with primary human hepatocytes on d16 of gestation. Mixed lymphocyte assays were performed at wk1 after birth. Spleen cells from rats neither injected intrafetally with hepatocytes, nor transplanted, lane 1; irradiated primary human hepatocytes incubated alone, lane 2; spleen cells from rats neither intrafetally injected nor transplanted, but which were incubated with irradiated hepatocytes, lane 3; spleen cells from rats intrafetally injected and transplanted and subsequently exposed to irradiated hepatocytes, lane 4; responder spleen cells from intrafetally injected and transplanted, exposed to irradiated IMR-90 fibroblasts, lane 5, and 293 kidney cells, lane 6; spleen cells from animals neither intrafetally injected nor transplanted, but exposed to irradiated IMR-90 cells, lane 7, or 293 cells, lane 8; irradiated IMR-90 and 293 cells incubated alone, lanes 9 and 10, respectively. Results were expressed as means ± SE. *indicates statistical significance, P < 0.05.
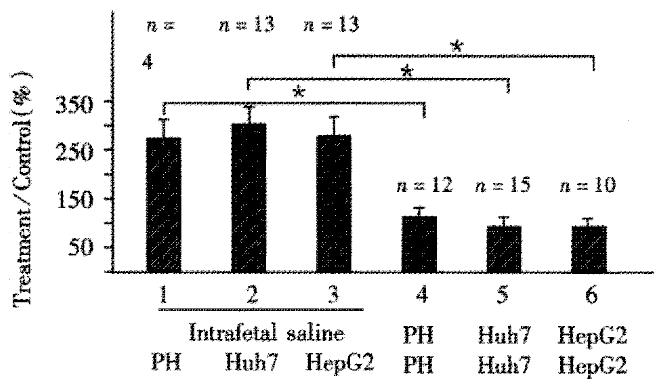
Figure 2 Mixed lymphocyte assays for measuring tolerance induced by different types of human hepatocytes.
Rats were intrafetally tolerized with either primary human hepatocytes (PH), or Huh7 cell, or HepG2 cells. All assays were performed at wk1 after birth and show radioactive incorporation by spleen cells from rats that were injected intrafetally with only saline, and subsequently incubated with primary hepatocytes, hepatoblastoma cell lines Huh7, or HepG2, lanes 1, 2 and 3, respectively. Radioactive uptake of spleen cells from rats intrafetally injected with primary hepatocytes, Huh7 or HepG2 cells and incubated with their corresponding irradiated cells is shown in lanes 4, 5, and 6, respectively. The number of rats in each group is indicated on the top of each column. Results are expressed as percentage of controls (spleen cells from untreated rats incubated alone) as -x±sx. Duncan's test was used to analyze the significance between different treatment groups. *indicates significant differences between groups 1 and 4, between 2 and 5; and 3 and 6, P < 0.05.
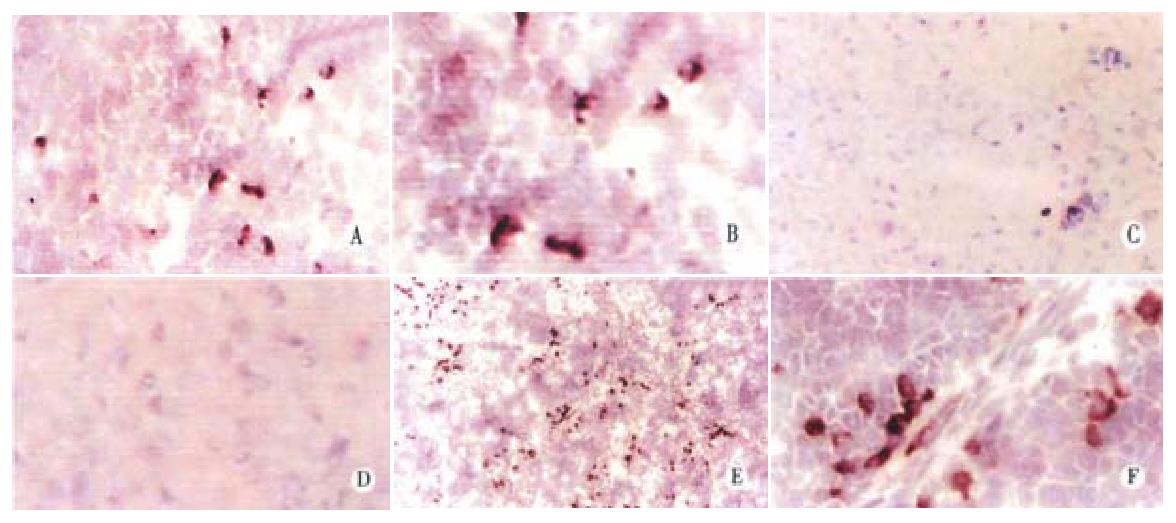
Figure 3 Immunohistochemistry for detecting human albumin in rat livers.
Antibody against human albumin was visualized using a DAB method as described in Materials and Methods. Fifteen SD fetal rats were tolerized with Huh7 cells. Ten newborn rats were subsequently transplanted with Huh7 cells on d1 after birth, and the rest were not transplanted. Panel A, a representative rat that was tolerized and transplanted with Huh7 cells, sacrificed on d1 post-transplantation, magnification × 125; panel B, same as panel A, × 250; panel C, a representative rat that was tolerized with Huh7 cells, but without transplantation, × 125; panel D, same as panel C, × 250; panel E, a representative rat that was tolerized and transplanted with Huh7 cells, sacrificed on d7 after birth, × 125; panel F, same as panel B, × 250.
Figure 4 Confocal immunofluorescence microscopy for detection of human albumin in rat livers at wk16 post-transplantation.
Panel A, a representative rat intrafetally injected with primary hepatocytes and subsequently transplanted with those same cells, stained with monoclonal goat anti-rat albumin. Panel B, a section from the same sample stained with monoclonal mouse anti-human albumin antibody. Panel C, a representative rat intrafetally injected with primary human hepatocytes, but not transplanted with hepatocytes, stained with anti-human albumin antibody. Panel D, the same sample as in Panel A stained with only second antibody. Magnification, × 250.
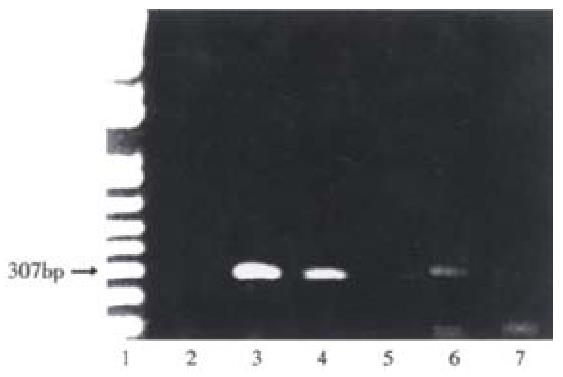
Figure 5 Detection of human albumin DNA in rat liver genomic DNA 16 wk post-transplantation.
From livers of animals treated as described in Figure 4, DNA was extracted, and assayed for the presence of human albumin sequences by PCR as described in Materials and Methods. Lane 1, molecular markers; lane 2, liver from untreated rats; lanes 3 to 5, 104, 103 and 102 Huh7 cells, respectively; lane 6, a representative rat intrafetally injected with primary human hepatocytes, and transplanted with those cells; lane 7, a rat intrafetally injected with primary hepatocytes, but not transplanted. The expected position of the amplified human albumin sequence is indicated by the arrow corresponding to 307 bp based on the DNA molecular markers in lane 1.
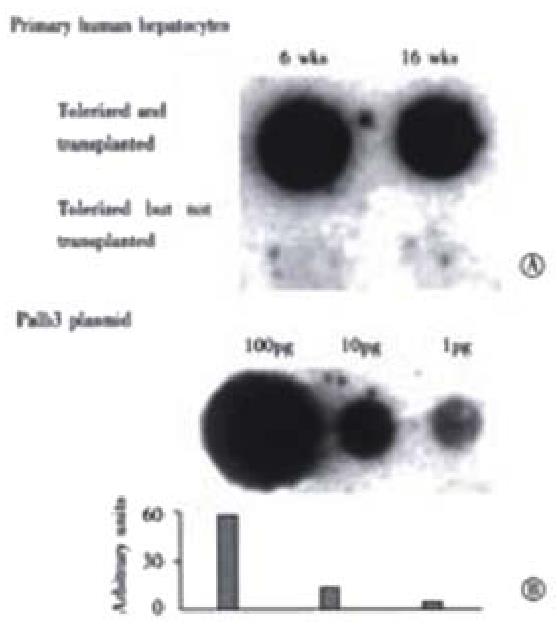
Figure 6 Quantitation of human albumin DNA in rat livers by dot blotting.
Panel A, upper row, shows DNA extracted from liver samples from a intrafetally injected, and transplanted rat at wk6 and 16 post-transplantation, respectively. Lower row shows results from a rat tolerized but without transplantation at the same time points. All dots were hybridized with a 32P-labeled probe for human albumin DNA. Panel B shows a plasmid, palb-3, containing the complete human albumin gene, applied in decreasing amounts, 100 pg, 10 pg and 1 pg as standards.
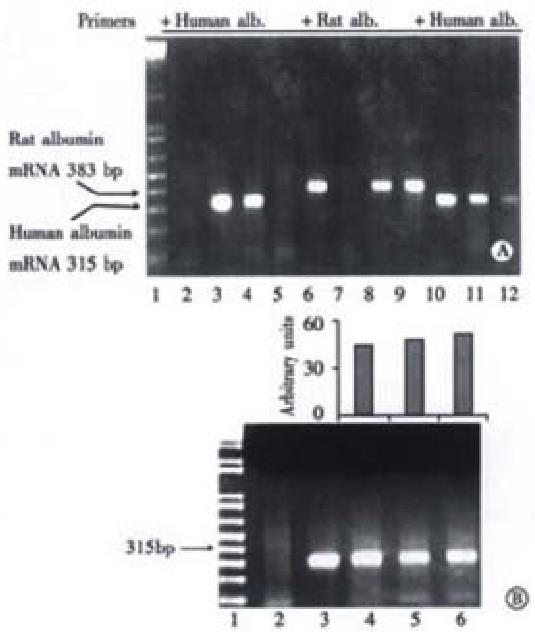
Figure 7 Detection of human albumin mRNA in rat livers by RT-PCR.
Panel A, RT-PCR of RNA extracts from liver samples collected at wk16 post-transplantation. Lane 1, 1 kb plus molecular markers; lanes 2 and 6, non-intrafetally injected, non-transplanted rats; lanes 3 and 7, Huh7 cells as positive control; lanes 4 and 8, rats intrafetally injected, and transplanted with primary human hepatocytes; lanes 5 and 9, rats intrafetally injected, but not transplanted with human hepatocytes. For lanes 2 to 5, samples were amplified with primers for human albumin DNA, and for lanes 6 to 9, samples were amplified with primers for rat albumin DNA. In lanes 10 to 12, DNA from 104, 103 and 102 cultured Huh7 cells were amplified with primers for human albumin. The expected positions of human and rat albumin mRNA products at 315 bp and 388 bp, respectively, are indicated by arrows. Panel B, Time course of human albumin mRNA expression in the rat livers. Lane 1, 1 kb plus molecular markers; lane 2, samples from a non-tolerized and non-transplanted rat; lane 3, Huh 7 cells as a positive control; lanes 4 to 6, samples from a representative rat tolerized and transplanted with primary human hepatocytes collected at wk2, 6 and 16 post-transplantation, respectively.
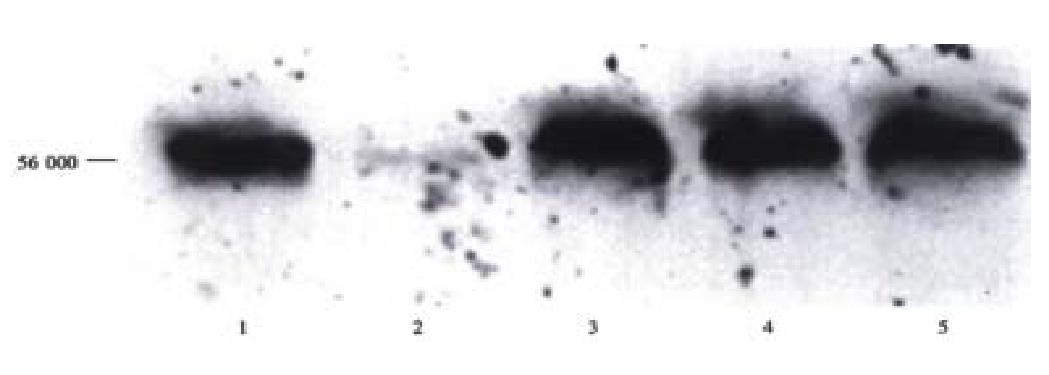
Figure 8 Detection of human albumin protein in rat serum by Western blots.
Western blots of serum samples from a representative rat intrafetally injected and transplanted with primary human hepatocytes at post-transplantation wk1, lane 3; wk2, lane 4; and wk3, lane 5. Lane 1: standard human albumin and lane 2: standard rat albumin.
- Citation: Ouyang EC, Wu CH, Walton C, Promrat K, Wu GY. Transplantation of human hepatocytes into tolerized genetically immunocompetent rats. World J Gastroenterol 2001; 7(3): 324-330
- URL: https://www.wjgnet.com/1007-9327/full/v7/i3/324.htm
- DOI: https://dx.doi.org/10.3748/wjg.v7.i3.324


