
















Copyright: ©Author(s) 2026.
World J Gastroenterol. Dec 28, 2026; 32(48): 122778
Published online Dec 28, 2026. doi: 10.3748/wjg.122778
Published online Dec 28, 2026. doi: 10.3748/wjg.122778
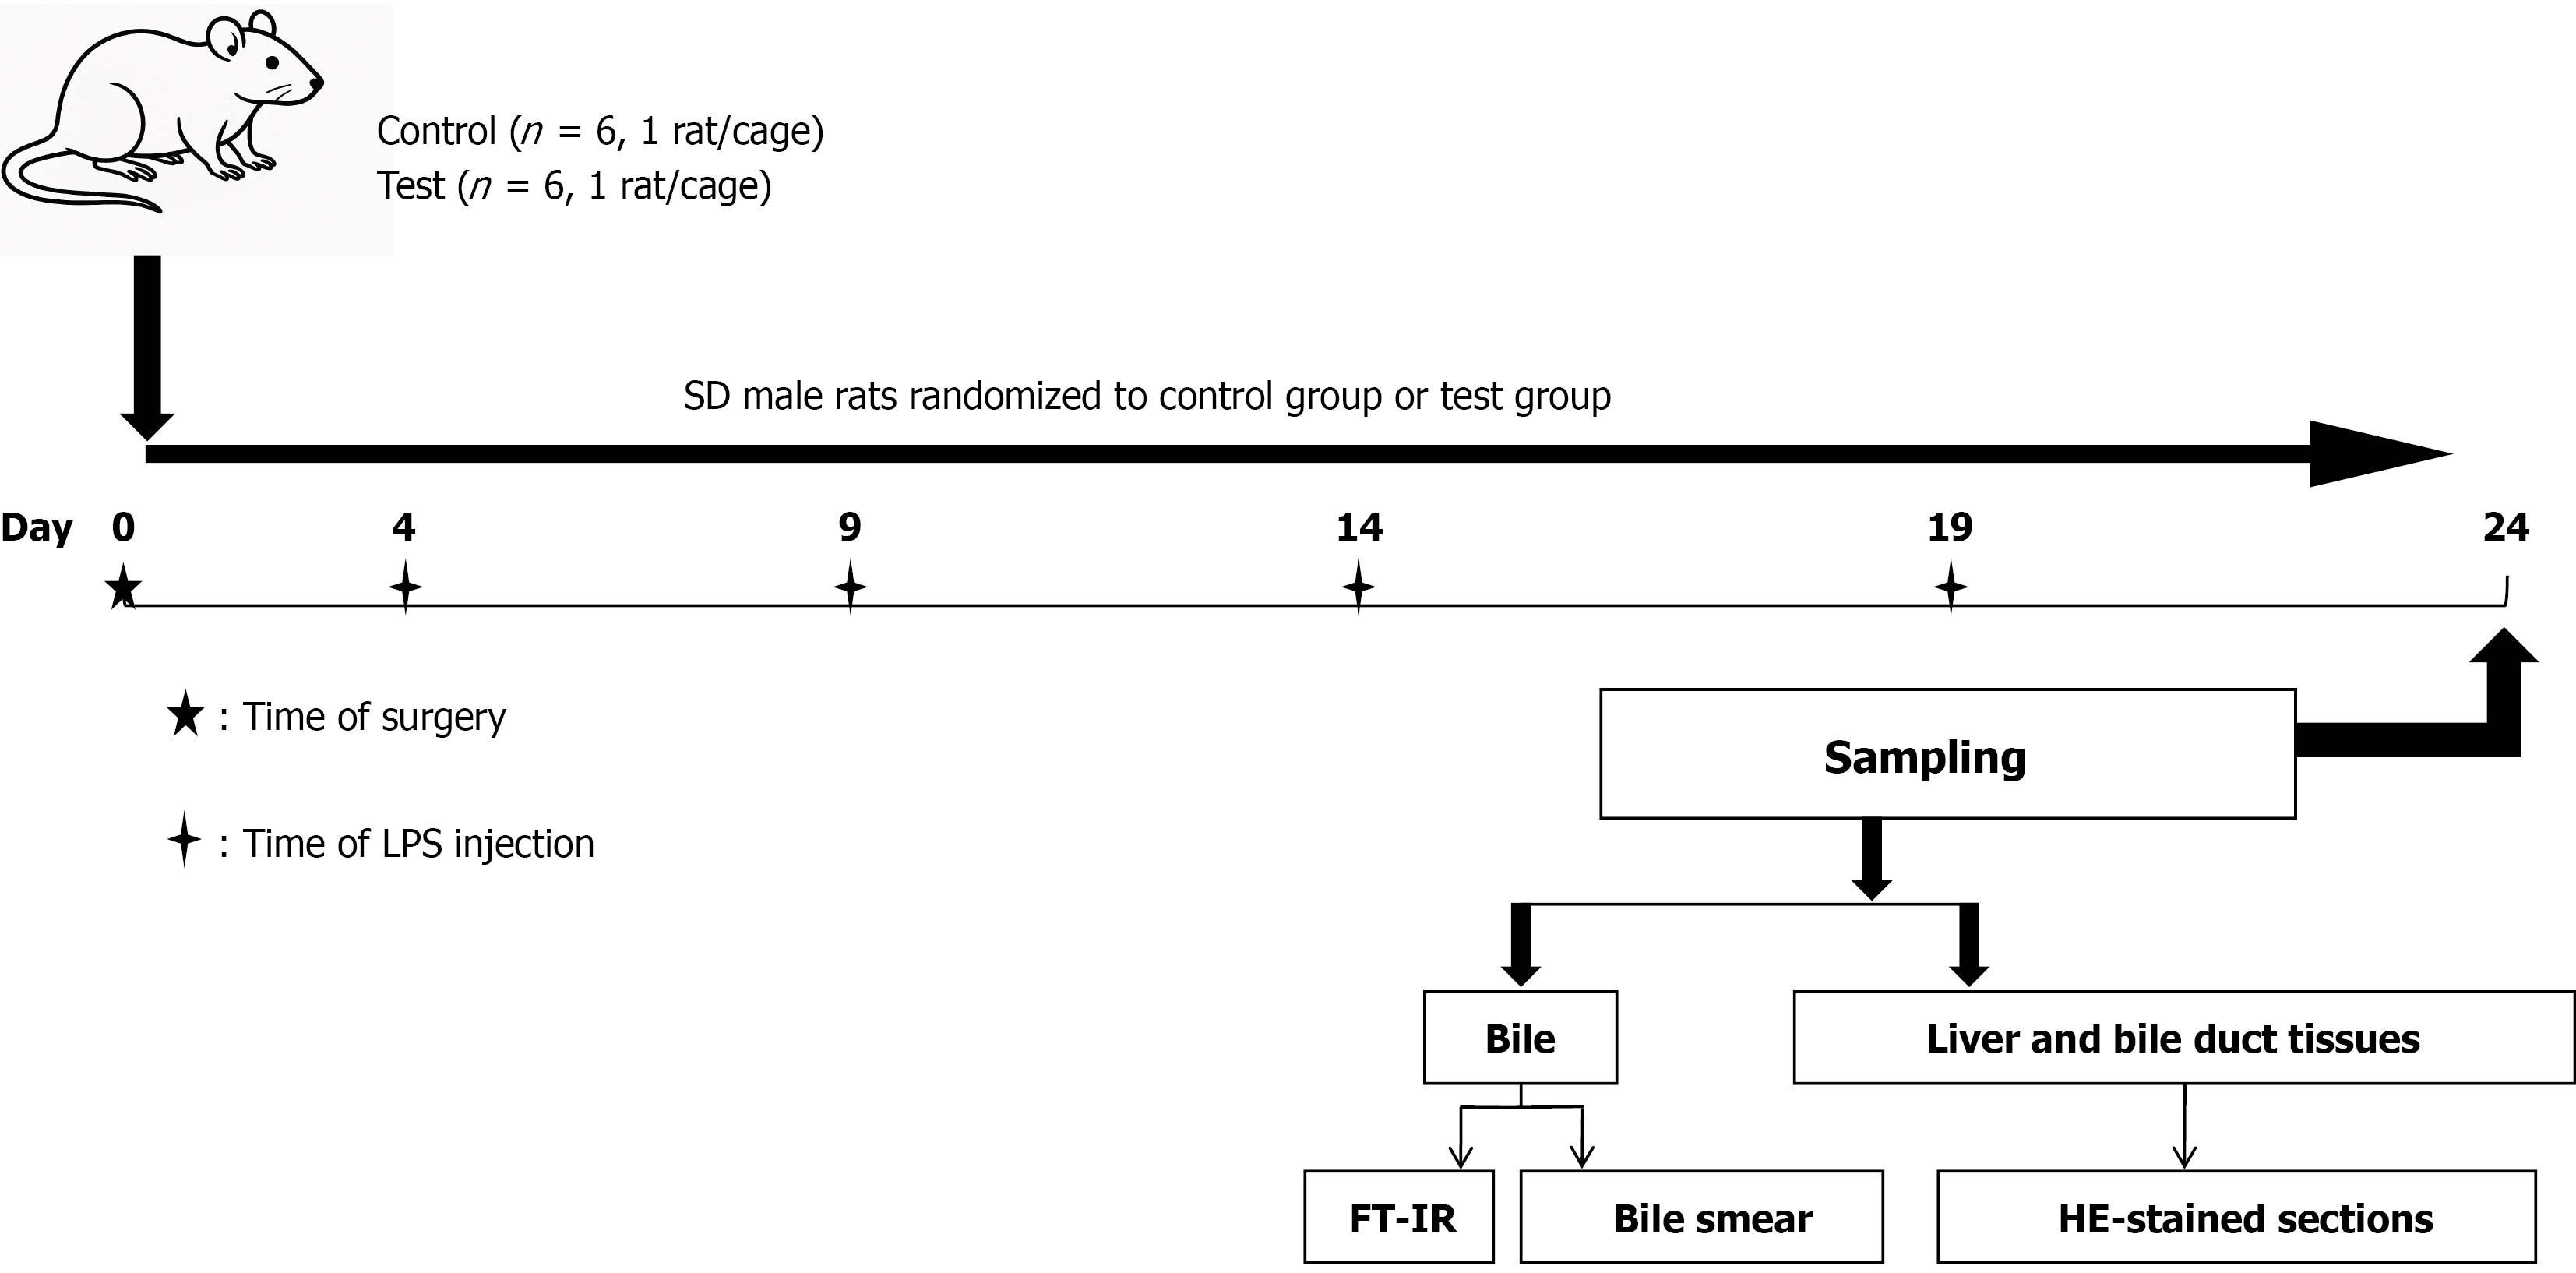
Figure 1 Experimental protocol flowchart.
SD male rats were randomized to the control group (n = 6, 1 rat/cage) or the LPS test group (n = 6, 1 rat/cage). Surgery was performed on day 0. LPS or equal-volume saline was injected intraductally on days 4, 9, 14, and 19. All animals were sampled on day 24. Bile was collected for FT-IR analysis and bile smear examination; liver and bile duct tissues were collected for HE-stained paraffin sections. FT-IR: Fourier transform infrared spectroscopy; HE: Hematoxylin and eosin; LPS: Lipopolysaccharide; SD: Sprague-Dawley.
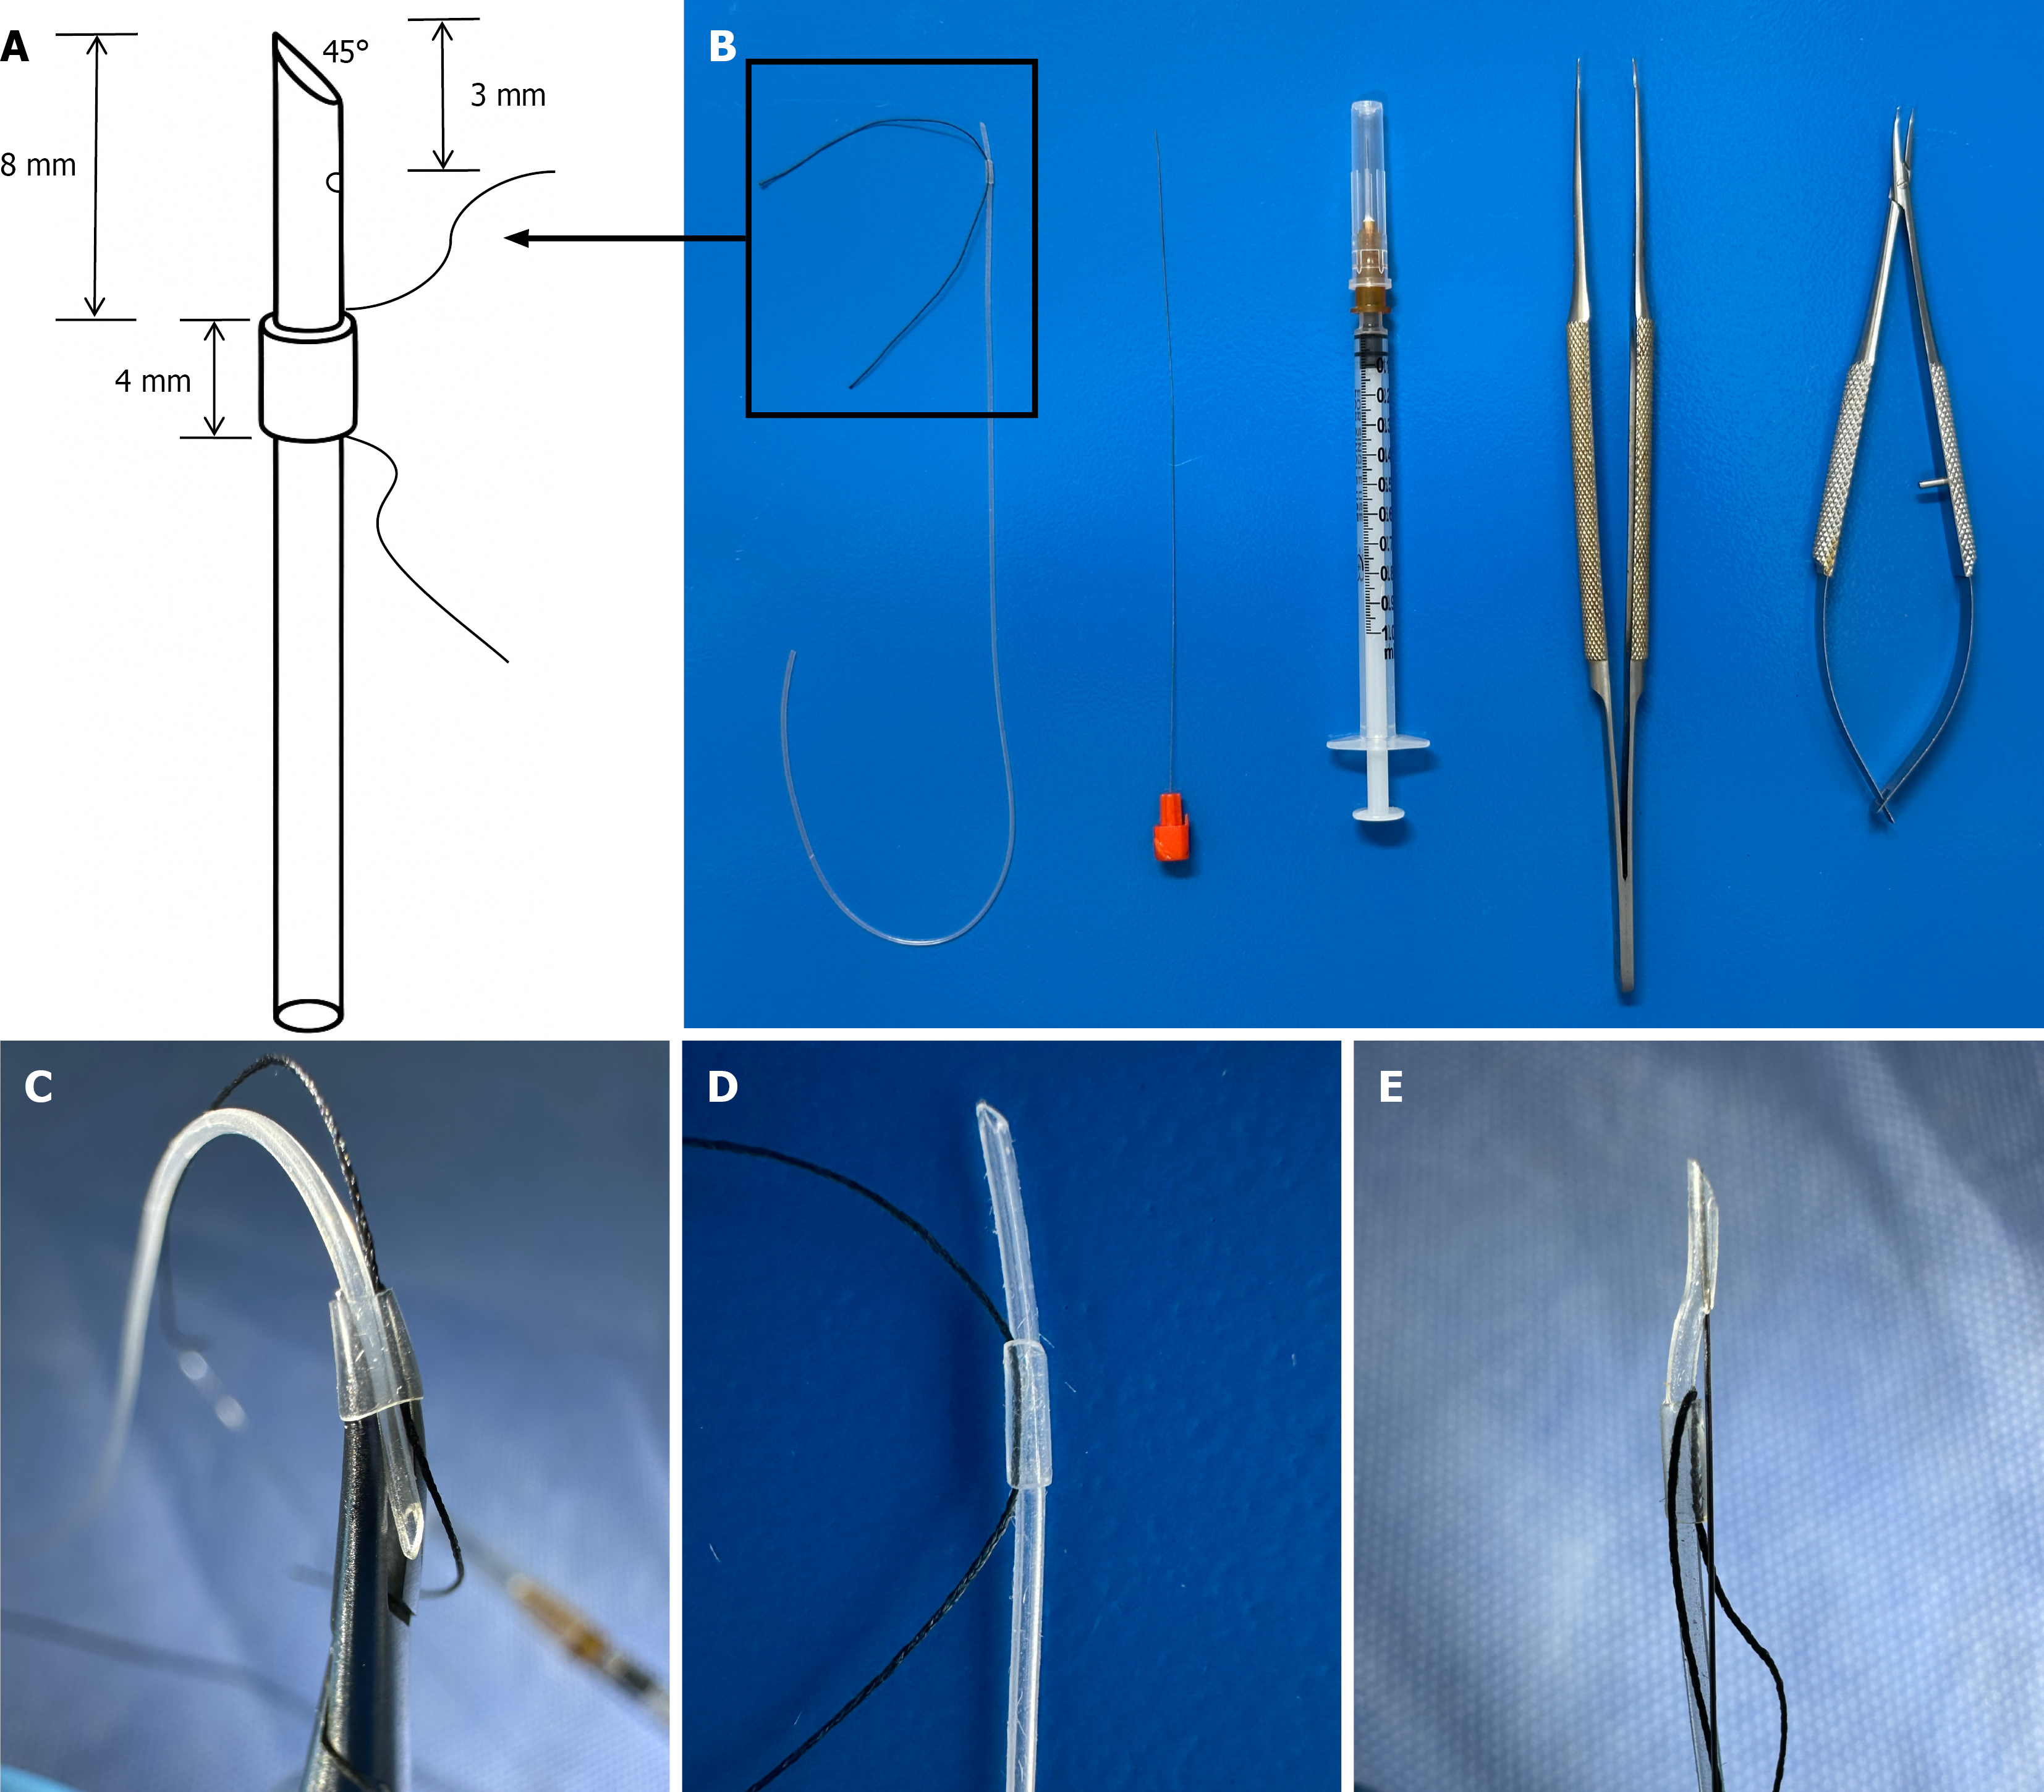
Figure 2 Catheter assembly.
A: Schematic of the 20-cm silicone tube tip: 45° bevel cut, side hole within 3 mm of the tip, and 4-mm sleeve mounted 8 mm from the tip with threaded 5-0 Mersilk suture; B: Components from left to right: Finished silicone tube assembly with guidewire, 1-mL syringe with needle, microsurgical curved forceps, and microsurgical needle holder; C: Method for fitting the 4-mm silicone sleeve onto the 20-cm tube; D: Appearance of the completed sleeve assembly; E: Complete catheter tip before insertion, with guidewire in place.
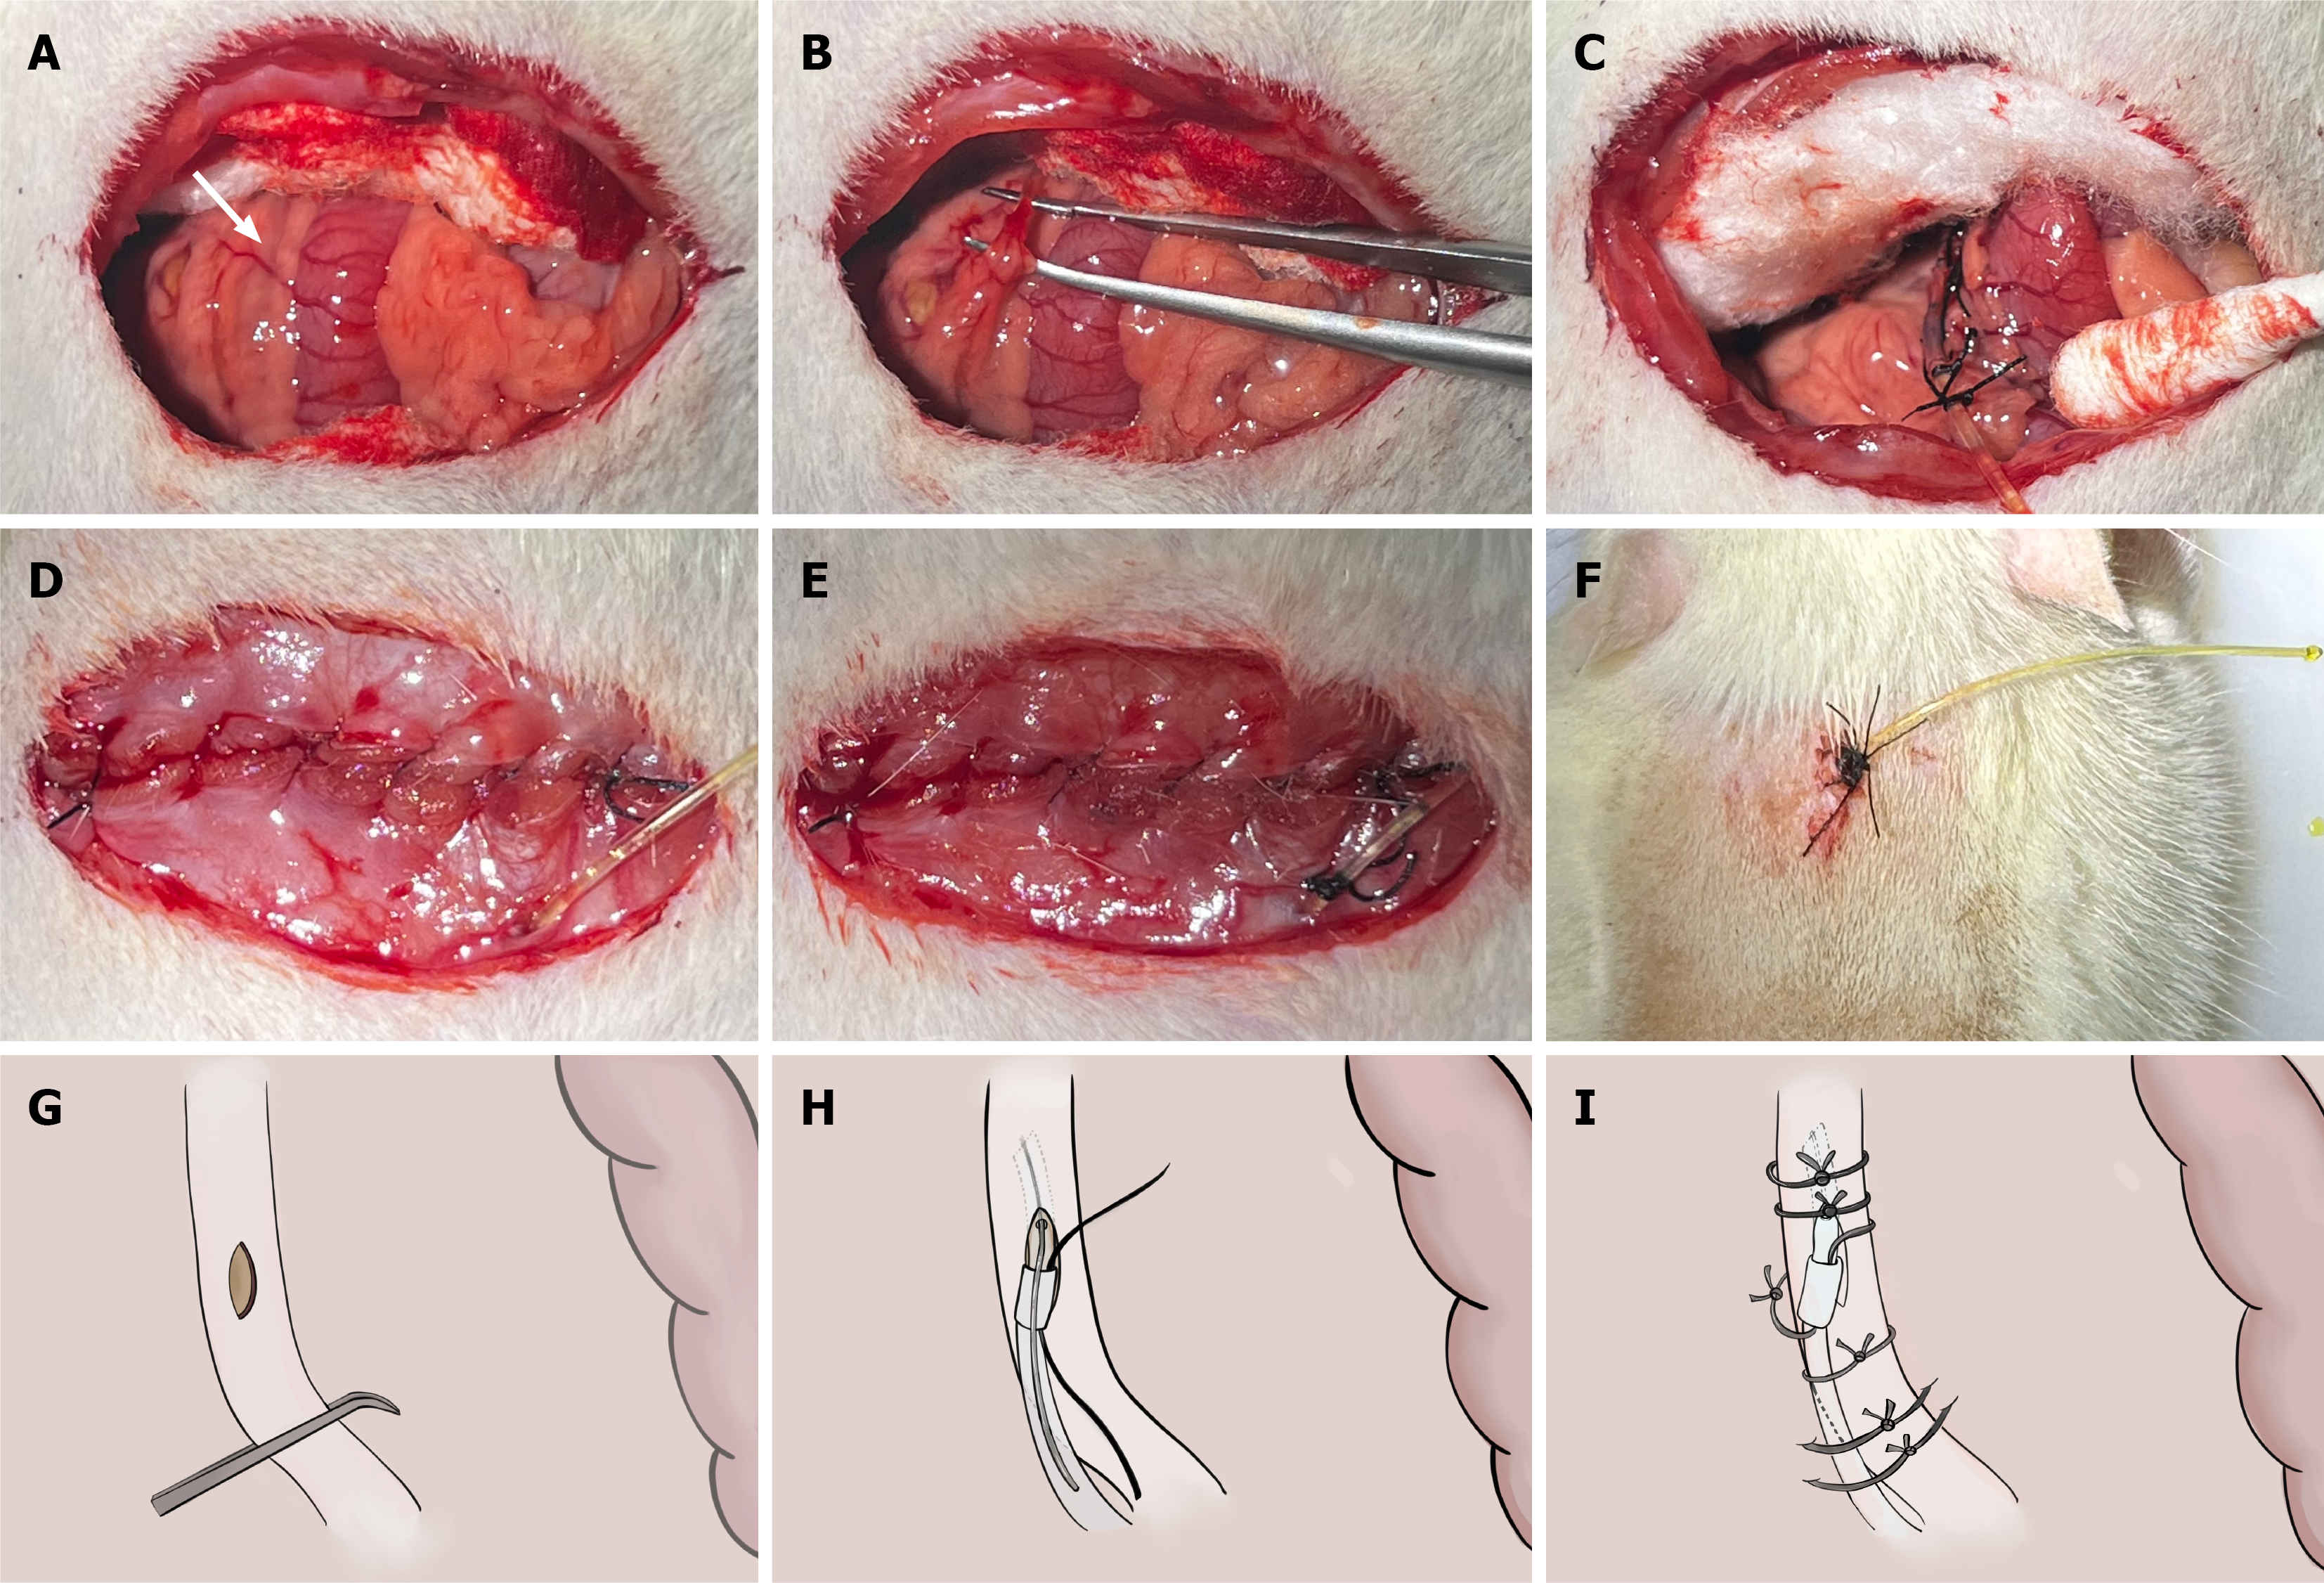
Figure 3 Common bile duct catheterization: Operative steps.
A: Exposure of the common bile duct (white arrow); the duct runs alongside the portal vein and hepatic artery; B: Blunt dissection of the common bile duct using microsurgical forceps; C: Catheter in situ with initial fixation sutures in place and bile flowing freely from the tube; D: Abdominal closure; the catheter passes through the peritoneum and muscle layer; E: Catheter fixed to the abdominal wall before skin closure; F: External catheter externalized and fixed to the back of the neck, leaving 3 cm of the tube exposed; G: Schematic of a 1-mm-long longitudinal incision in the wall of the common bile duct made using a 26-G needle; H: Schematic of insertion of the silicone tube through the incision in the bile duct using a curved clamp while the guidewire is removed; I: Schematic of the final fixation configuration: Bile duct sutures, sleeve suture to the mesentery, and back fixation suture to the mesentery.
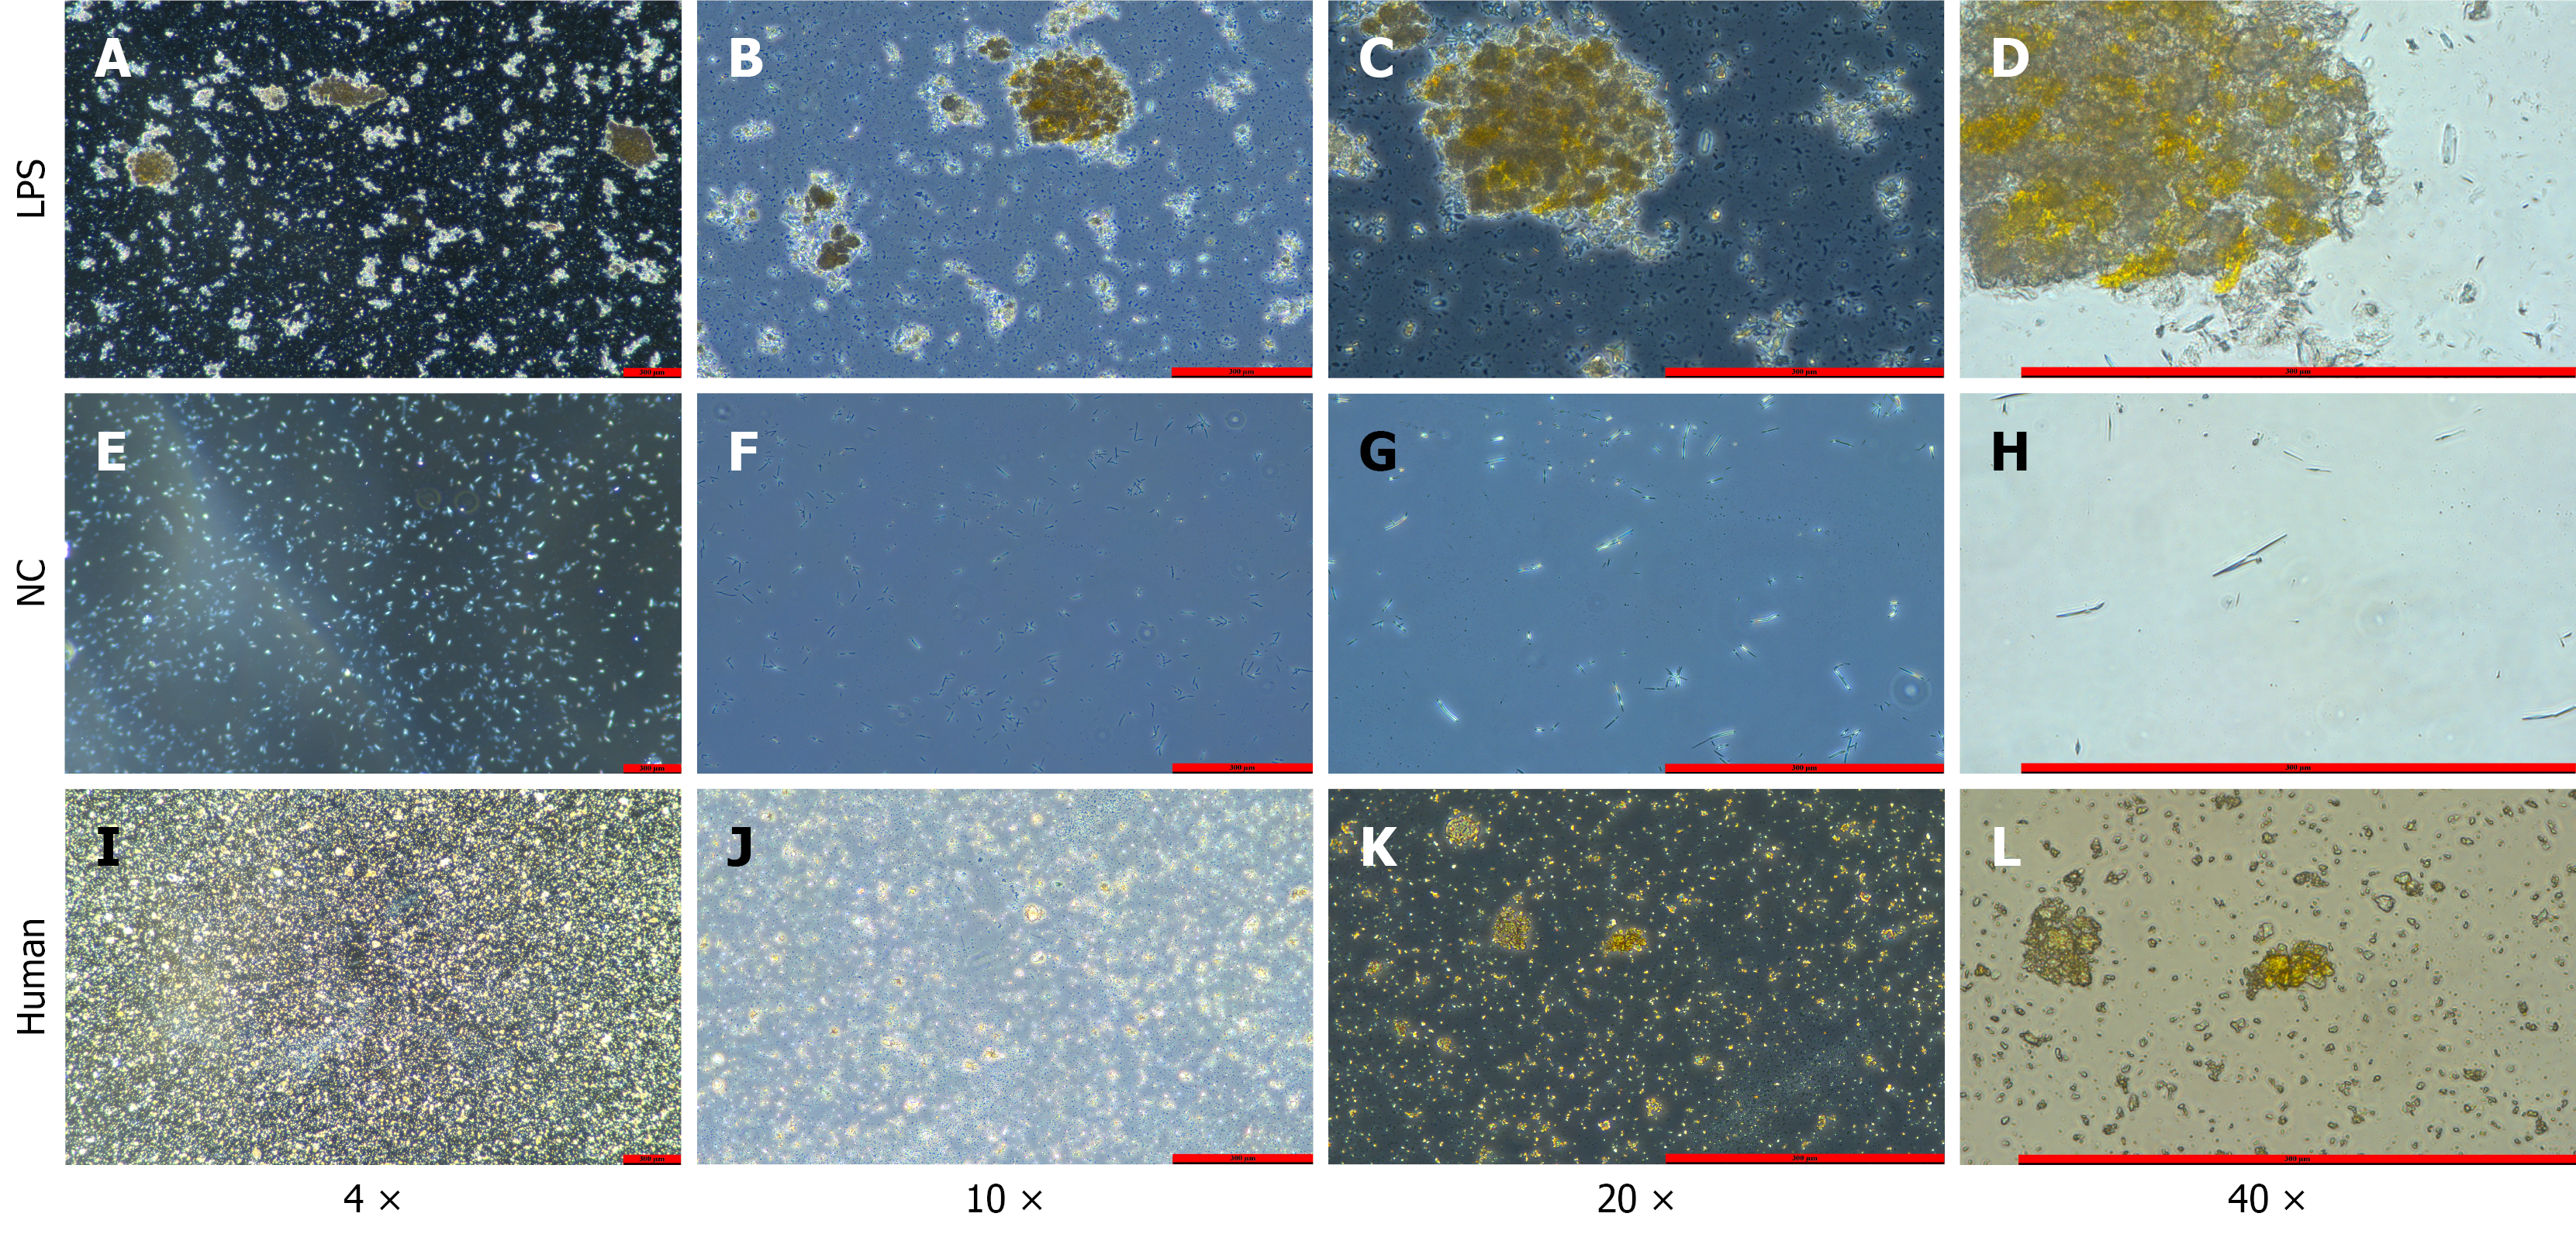
Figure 4 Microscopic bile smears.
A-D: Experimental group (LPS-treated) bile sediment smears at increasing magnifications, showing clearly visible yellow stone-like crystal aggregates with increasing detail at higher magnification; E-H: Control group bile smears after centrifugation at magnifications of 4 ×, 10 ×, 20 ×, and 40 ×, respectively, showing no crystals; I-L: Smears of ground clinical hepatolithiasis stone specimens at the same magnifications, showing yellow crystal morphology essentially consistent with that of the LPS group. LPS: Lipopolysaccharide; NC: Negative control.
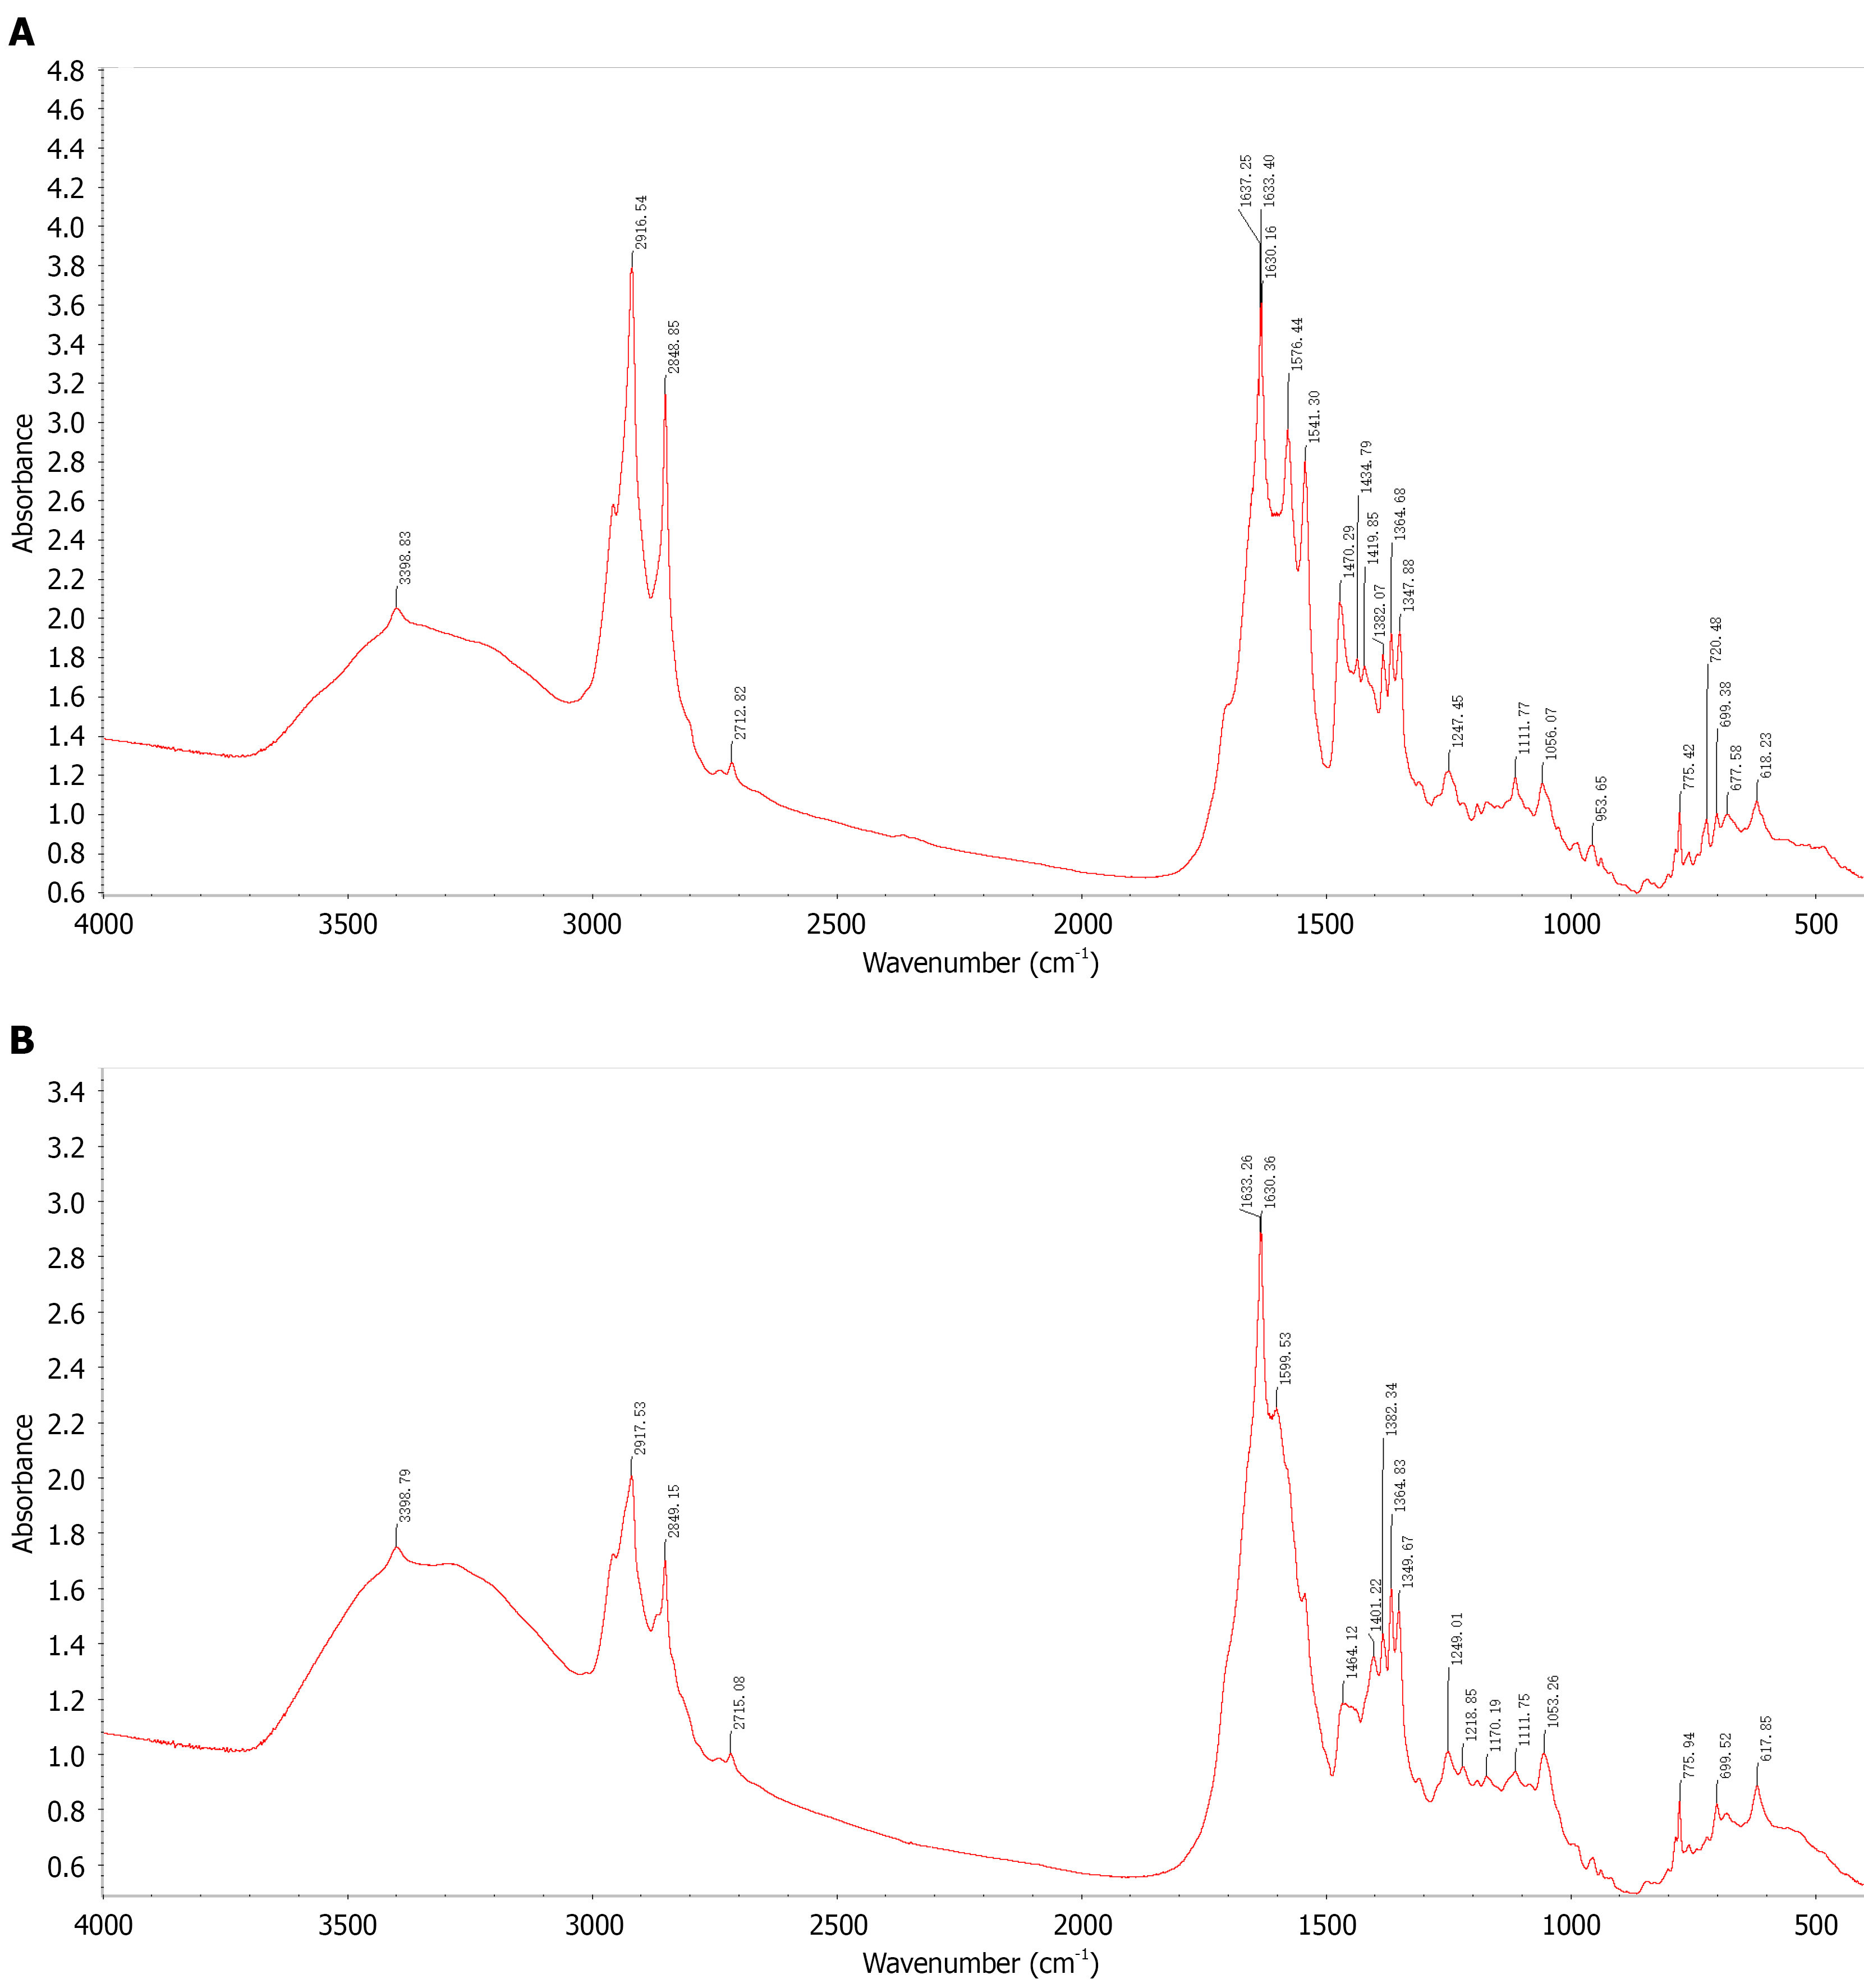
Figure 5 Fourier transform infrared spectroscopy.
A: FT-IR spectrum of clinically confirmed calcium bilirubinate hepatolithiasis specimens. Key absorption bands: Broad peak at 3600-2400 cm-1 (bound water); 3-peak combination at approximately 1637/1633/1630 cm-1, approximately 1576 cm-1, and approximately 1541 cm-1 (characteristic calcium bilirubinate signature); C-H stretching at 2916/2849 cm-1 (cholesterol). This spectrum serves as the reference standard confirming the analytical method; B: FT-IR spectrum of bile sediment from the experimental group (LPS-treated rats). The spectrum closely matches the clinical reference (Figure 5A): Broad bound-water absorption at 3600-2400 cm-1; 3-peak combination near 1633/1630 cm-1, 1599 cm-1, and the 1500-1400 cm-1 region, confirming calcium bilirubinate; C-H stretching at 2917/2849 cm-1, indicating a minor cholesterol component. Taken together, the sediment is predominantly calcium bilirubinate with a small amount of cholesterol. FT-IR: Fourier transform infrared spectroscopy; LPS: Lipopolysaccharide.
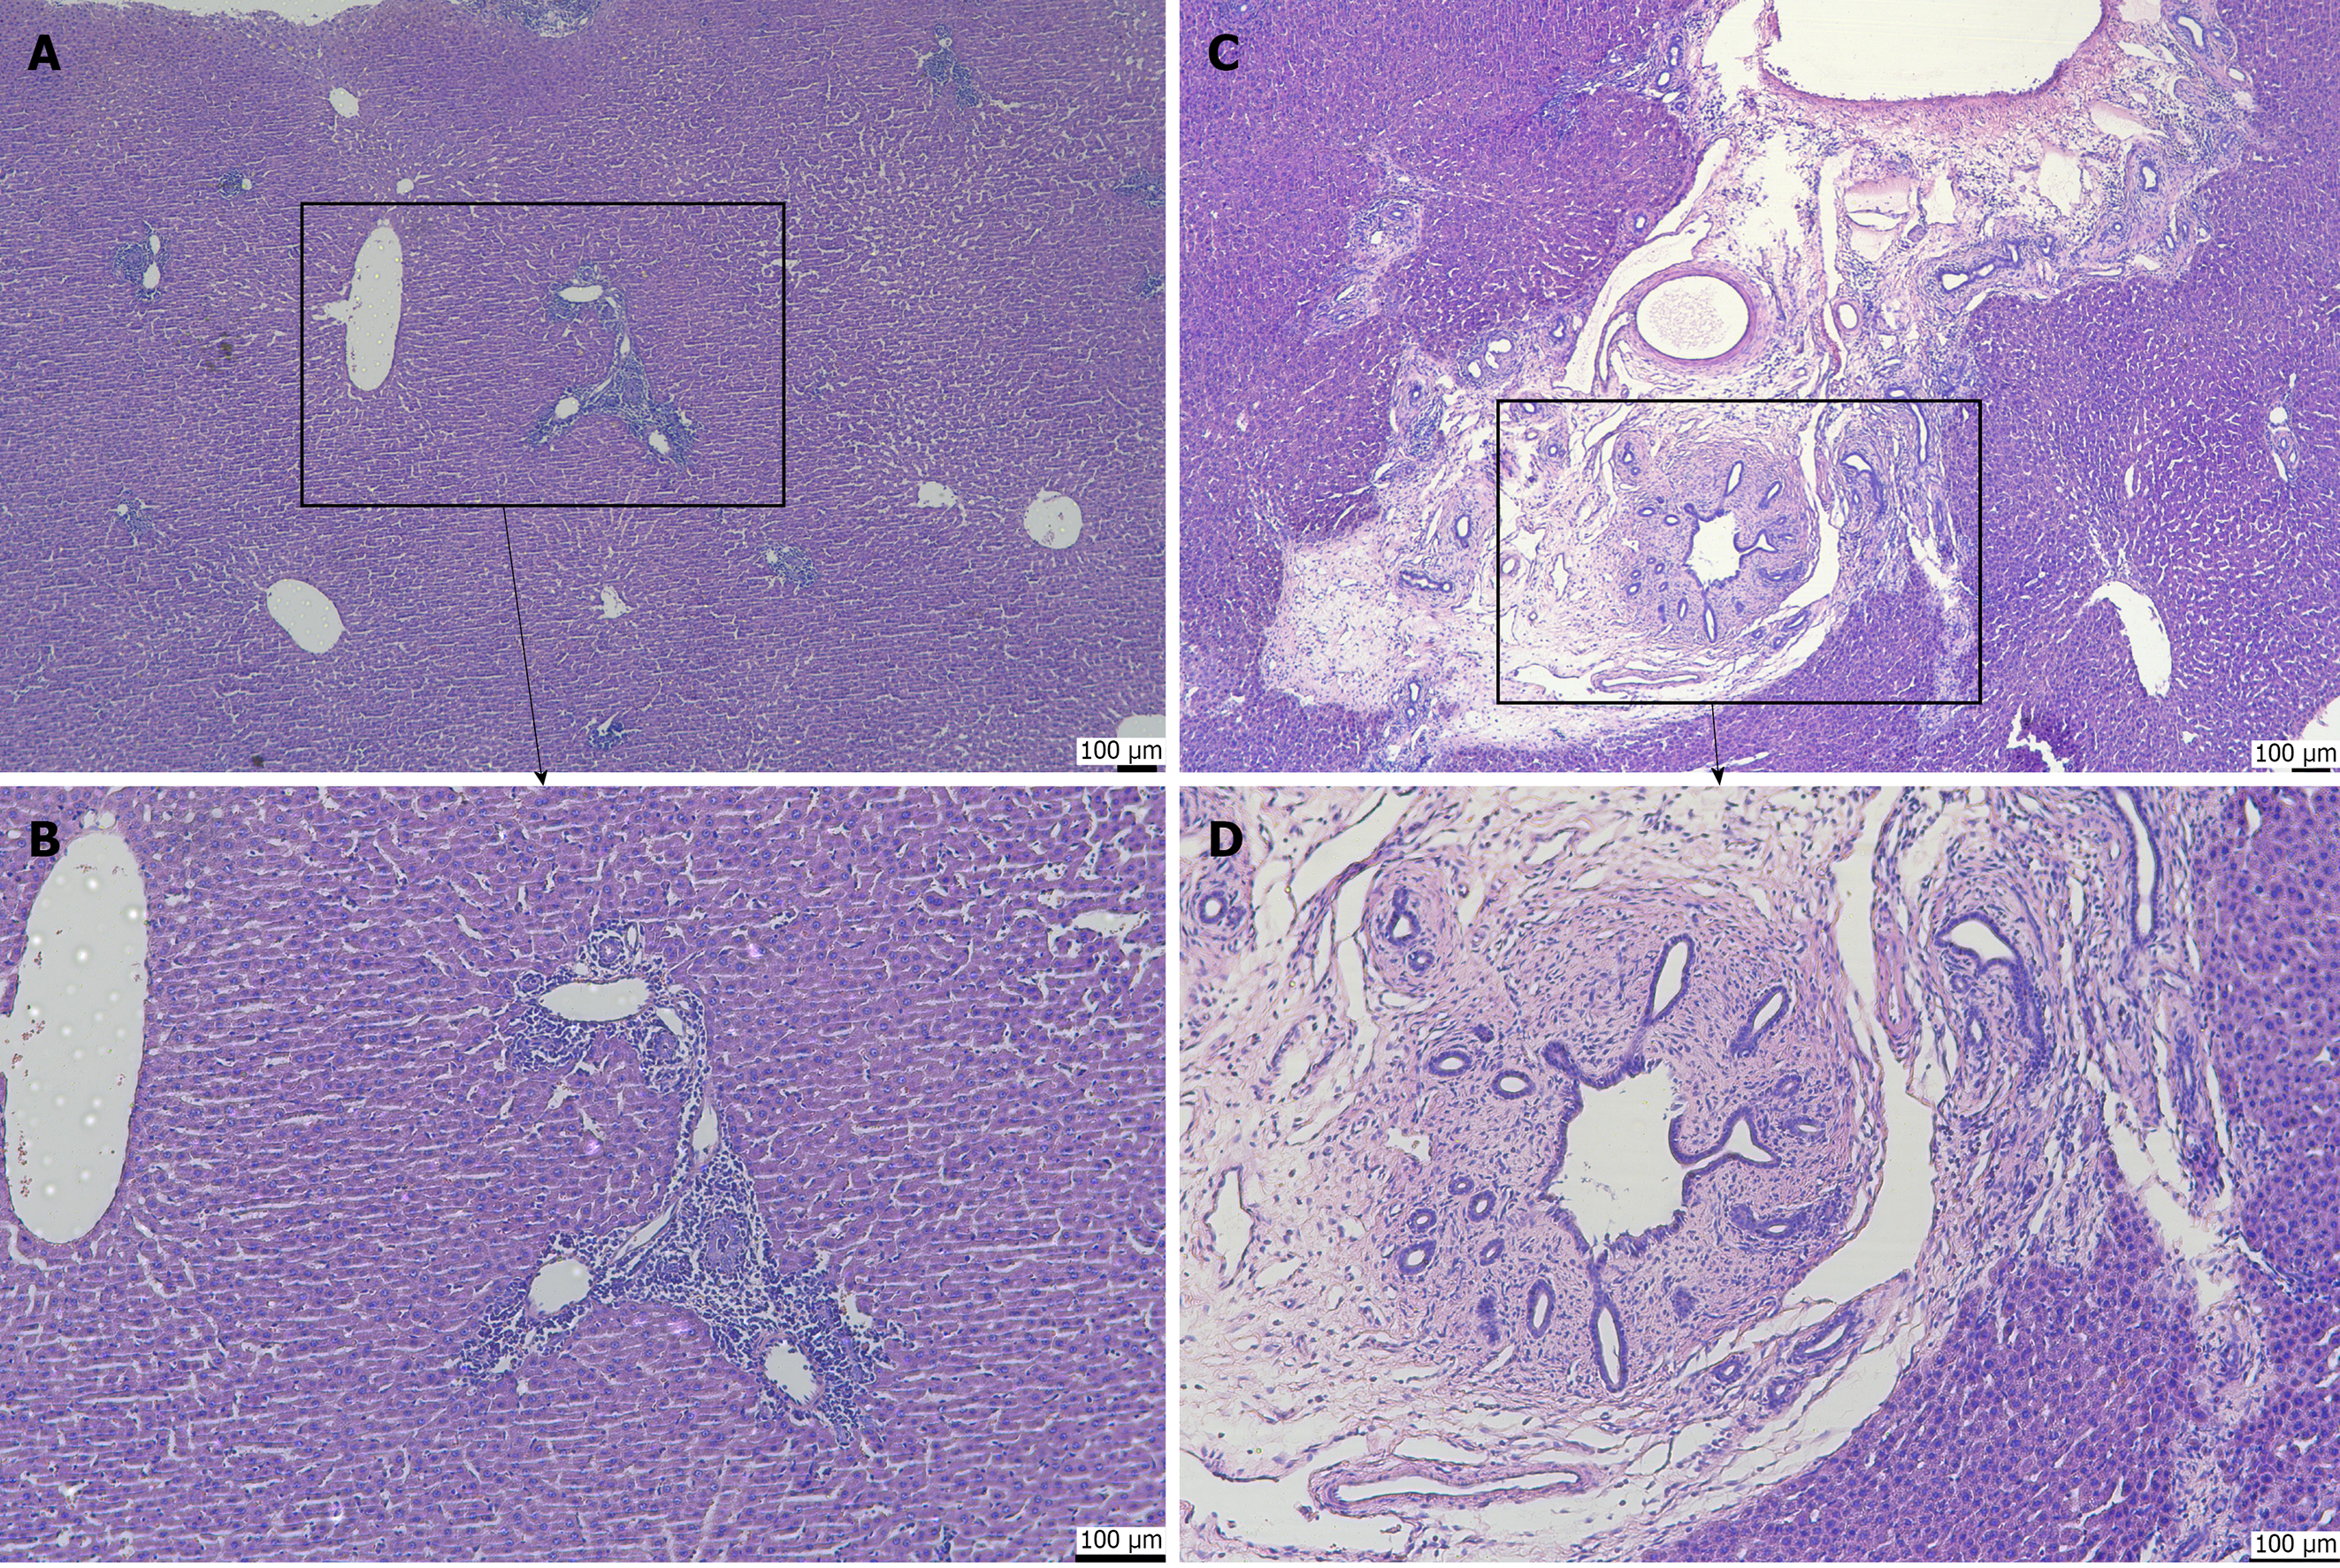
Figure 6 Hematoxylin and eosin staining of hepatobiliary tissue.
A: Portal tract at 10 × magnification, showing intact hepatic lobule architecture with minimal lymphocytes in the portal tract, no periportal extension, and no fibrosis (control group); B: Portal tract at 20 × magnification, showing the inset region from A with normal portal structures, sparse inflammatory cells, and no collagen deposition (fibrosis score S0, inflammation score G0-G1; control group); C: Portal tract at 10 × magnification, showing a markedly expanded portal tract with dense inflammatory infiltrate, prominent bile duct reaction, and periportal inflammation; the inset highlights the area shown in D (experimental group; LPS-treated); D: Portal tract at 20 × magnification, showing dense inflammatory cell infiltration, bile duct proliferation, and periductal collagen fiber deposition indicating portal-periportal fibrosis (inflammation score G1-G2, fibrosis score S1; experimental group; LPS-treated). LPS: Lipopolysaccharide.
- Citation: Shi JL, Muhammad T, He TT, Lin ZY, Zhang TG, Liu SY, Yang XL, Yang Y, Hu L, Ran P, Numan M, Li J. Establishment of a Sprague-Dawley rat model of hepatolithiasis based on common bile duct catheterization. World J Gastroenterol 2026; 32(48): 122778
- URL: https://www.wjgnet.com/1007-9327/full/v32/i48/122778.htm
- DOI: https://dx.doi.org/10.3748/wjg.122778