
















Copyright: ©Author(s) 2026.
World J Gastroenterol. Dec 28, 2026; 32(48): 122778
Published online Dec 28, 2026. doi: 10.3748/wjg.122778
Published online Dec 28, 2026. doi: 10.3748/wjg.122778
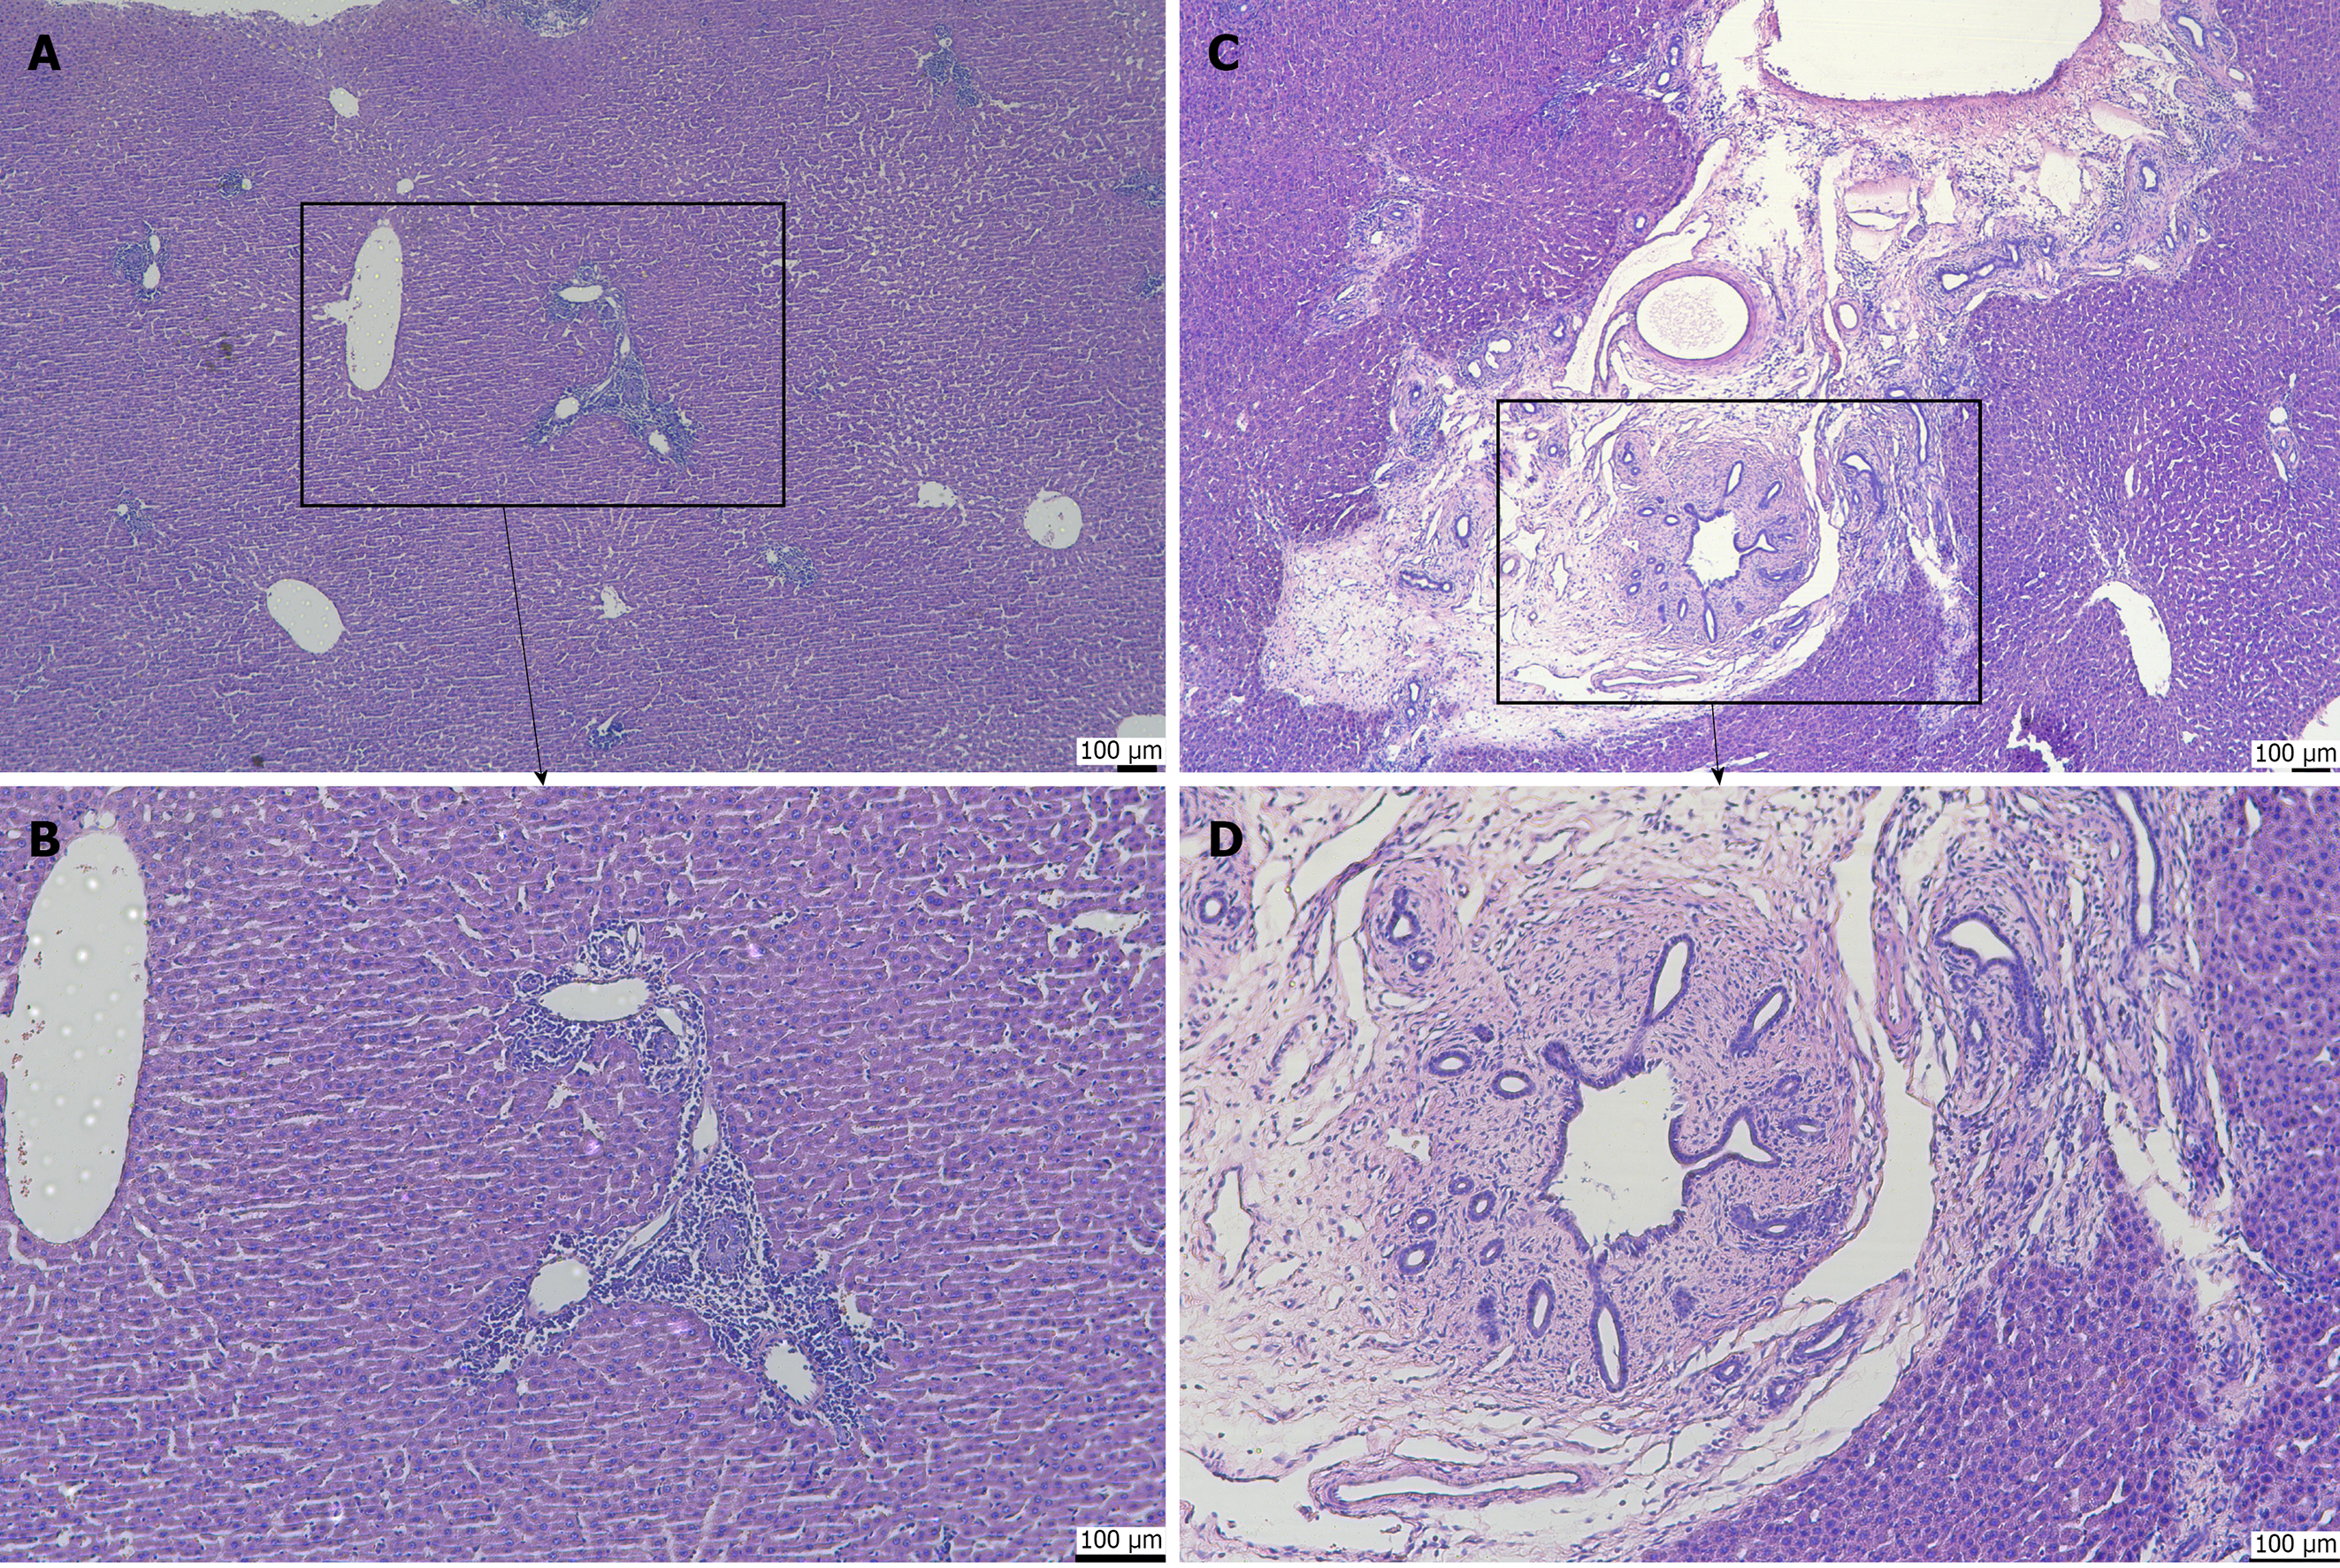
Figure 6 Hematoxylin and eosin staining of hepatobiliary tissue.
A: Portal tract at 10 × magnification, showing intact hepatic lobule architecture with minimal lymphocytes in the portal tract, no periportal extension, and no fibrosis (control group); B: Portal tract at 20 × magnification, showing the inset region from A with normal portal structures, sparse inflammatory cells, and no collagen deposition (fibrosis score S0, inflammation score G0-G1; control group); C: Portal tract at 10 × magnification, showing a markedly expanded portal tract with dense inflammatory infiltrate, prominent bile duct reaction, and periportal inflammation; the inset highlights the area shown in D (experimental group; LPS-treated); D: Portal tract at 20 × magnification, showing dense inflammatory cell infiltration, bile duct proliferation, and periductal collagen fiber deposition indicating portal-periportal fibrosis (inflammation score G1-G2, fibrosis score S1; experimental group; LPS-treated). LPS: Lipopolysaccharide.
- Citation: Shi JL, Muhammad T, He TT, Lin ZY, Zhang TG, Liu SY, Yang XL, Yang Y, Hu L, Ran P, Numan M, Li J. Establishment of a Sprague-Dawley rat model of hepatolithiasis based on common bile duct catheterization. World J Gastroenterol 2026; 32(48): 122778
- URL: https://www.wjgnet.com/1007-9327/full/v32/i48/122778.htm
- DOI: https://dx.doi.org/10.3748/wjg.122778