
















Copyright: ©Author(s) 2026.
World J Gastroenterol. Nov 7, 2026; 32(41): 120899
Published online Nov 7, 2026. doi: 10.3748/wjg.120899
Published online Nov 7, 2026. doi: 10.3748/wjg.120899
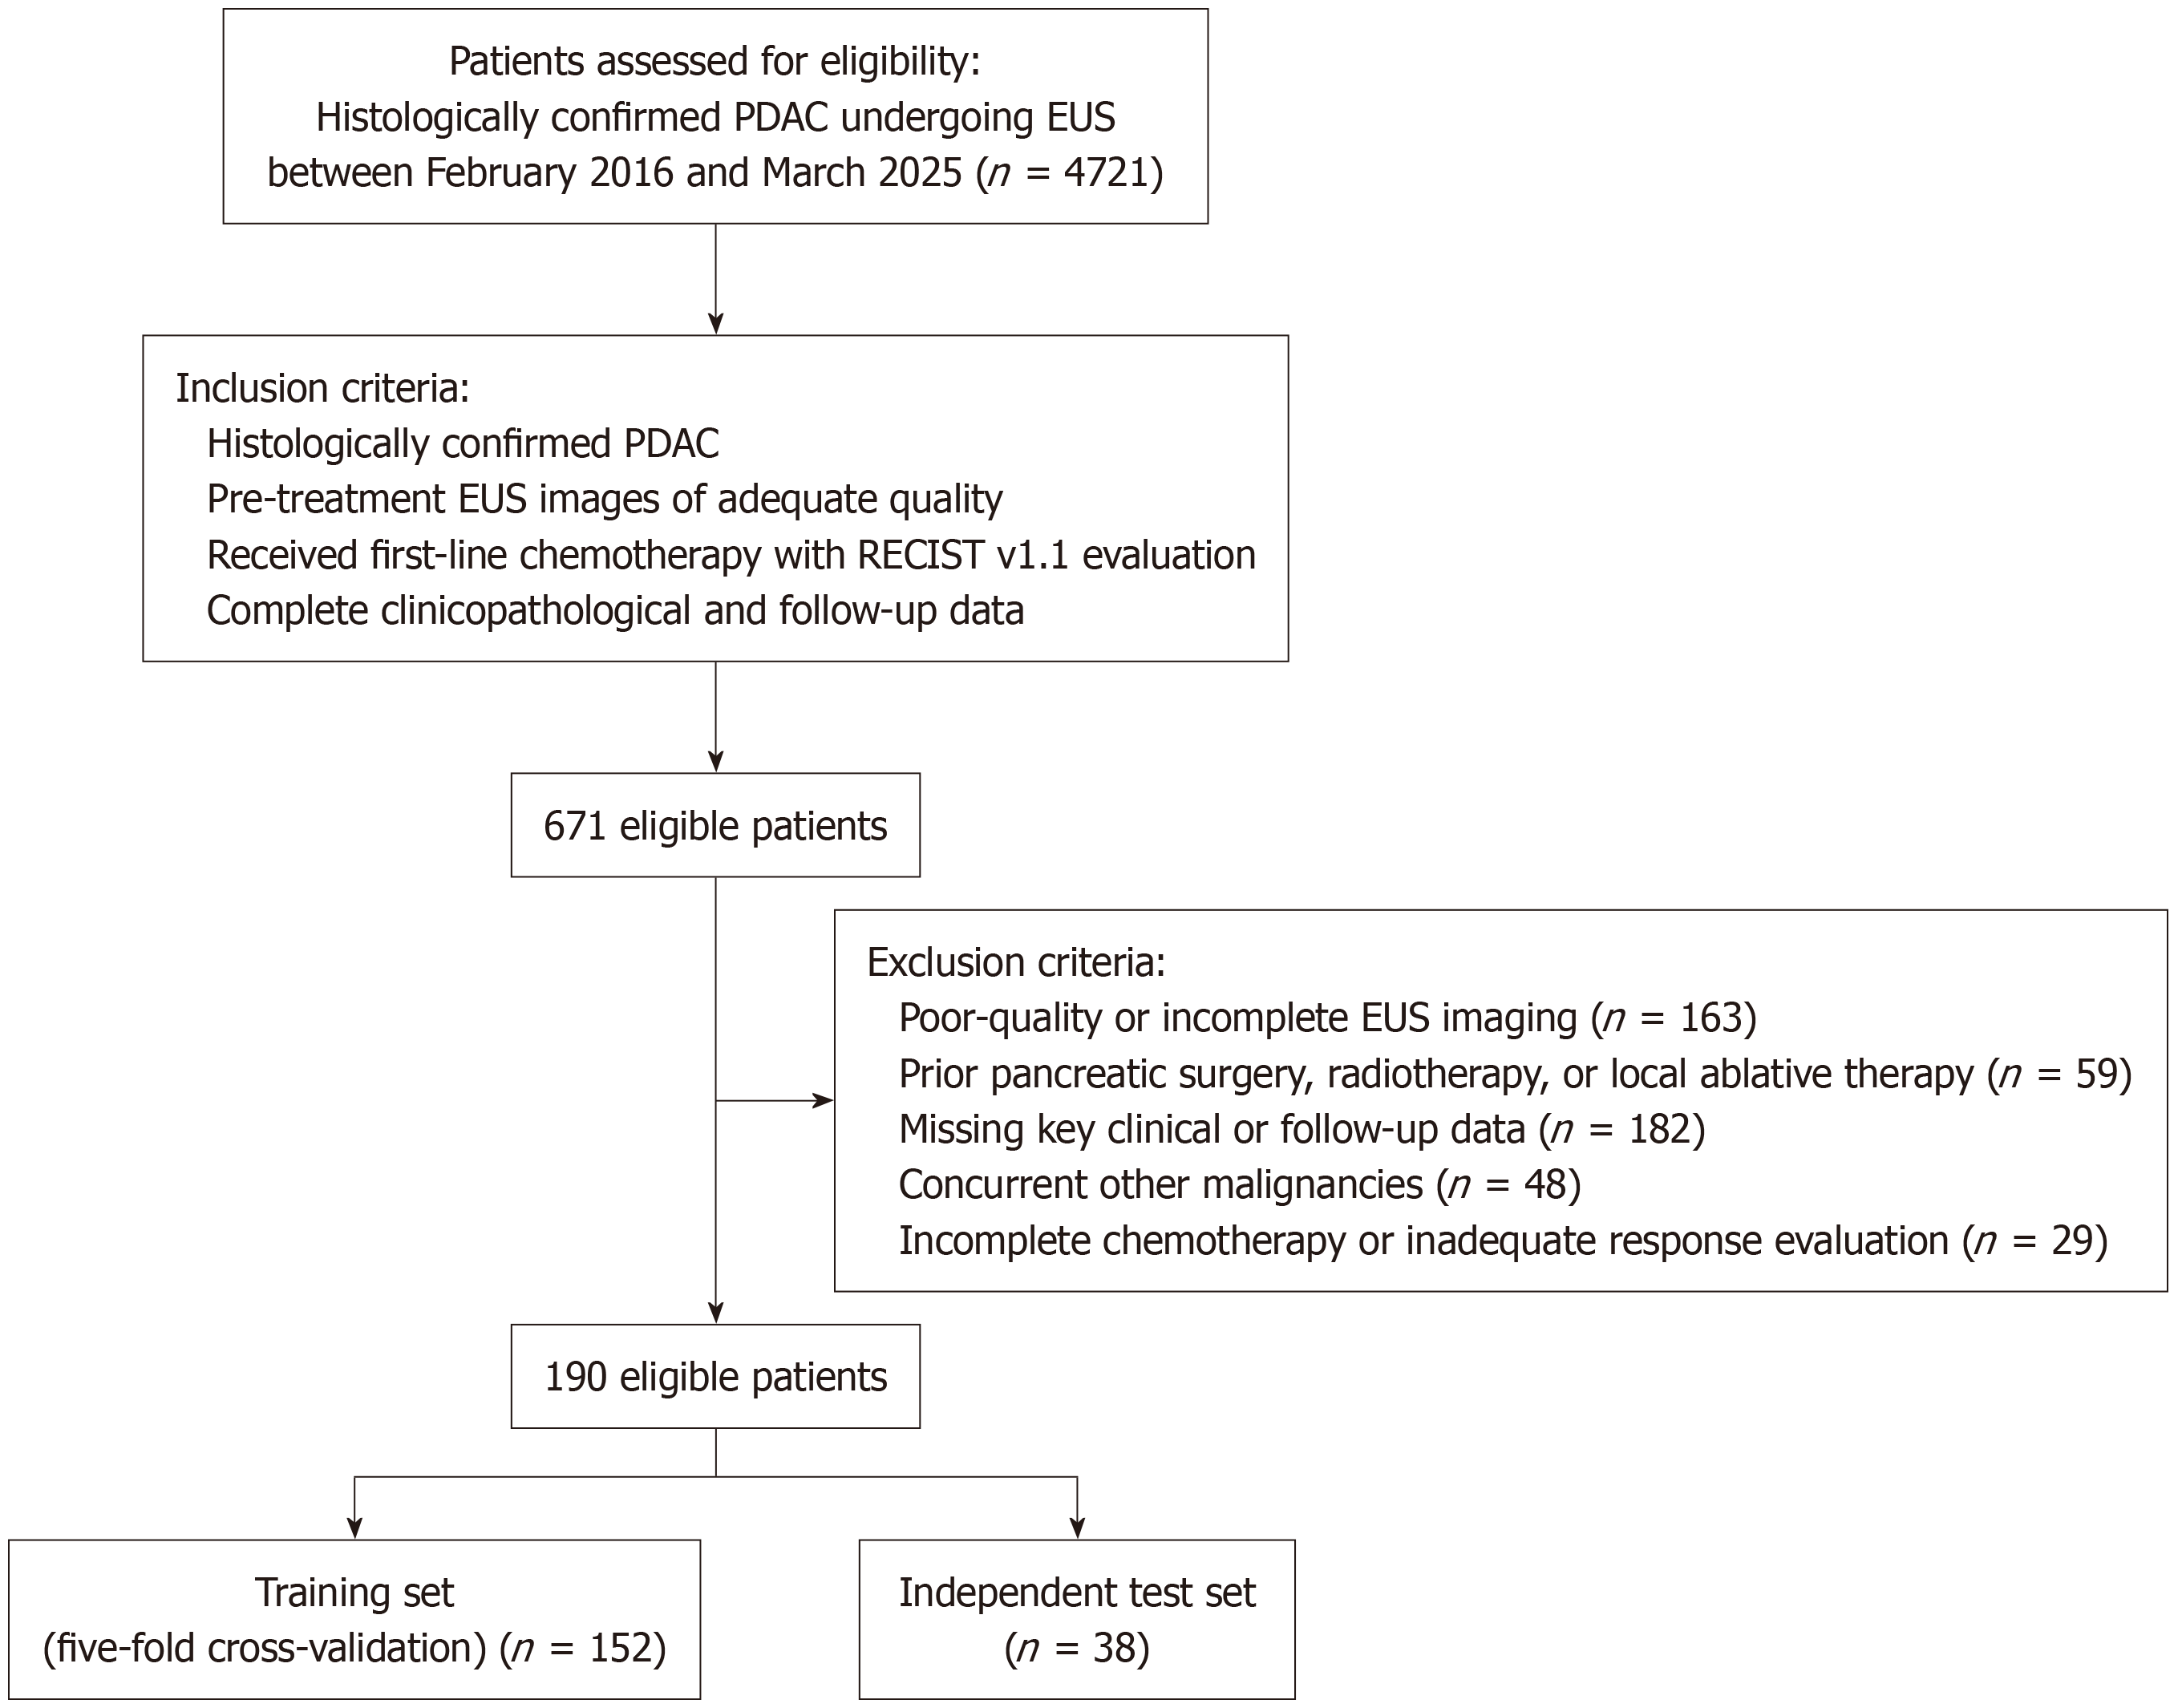
Figure 1 Flowchart of patient selection and cohort allocation.
This flowchart illustrates the screening and selection process of patients with histologically confirmed pancreatic ductal adenocarcinoma who underwent endoscopic ultrasound between February 2016 and March 2025. Of the 4721 patients initially screened, predefined inclusion and exclusion criteria were applied, resulting in 190 eligible patients. These patients were subsequently allocated to a training and internal validation cohort with five-fold cross-validation (n = 152) and a temporally independent test cohort (n = 38). EUS: Endoscopic ultrasound; PDAC: Pancreatic ductal adenocarcinoma.
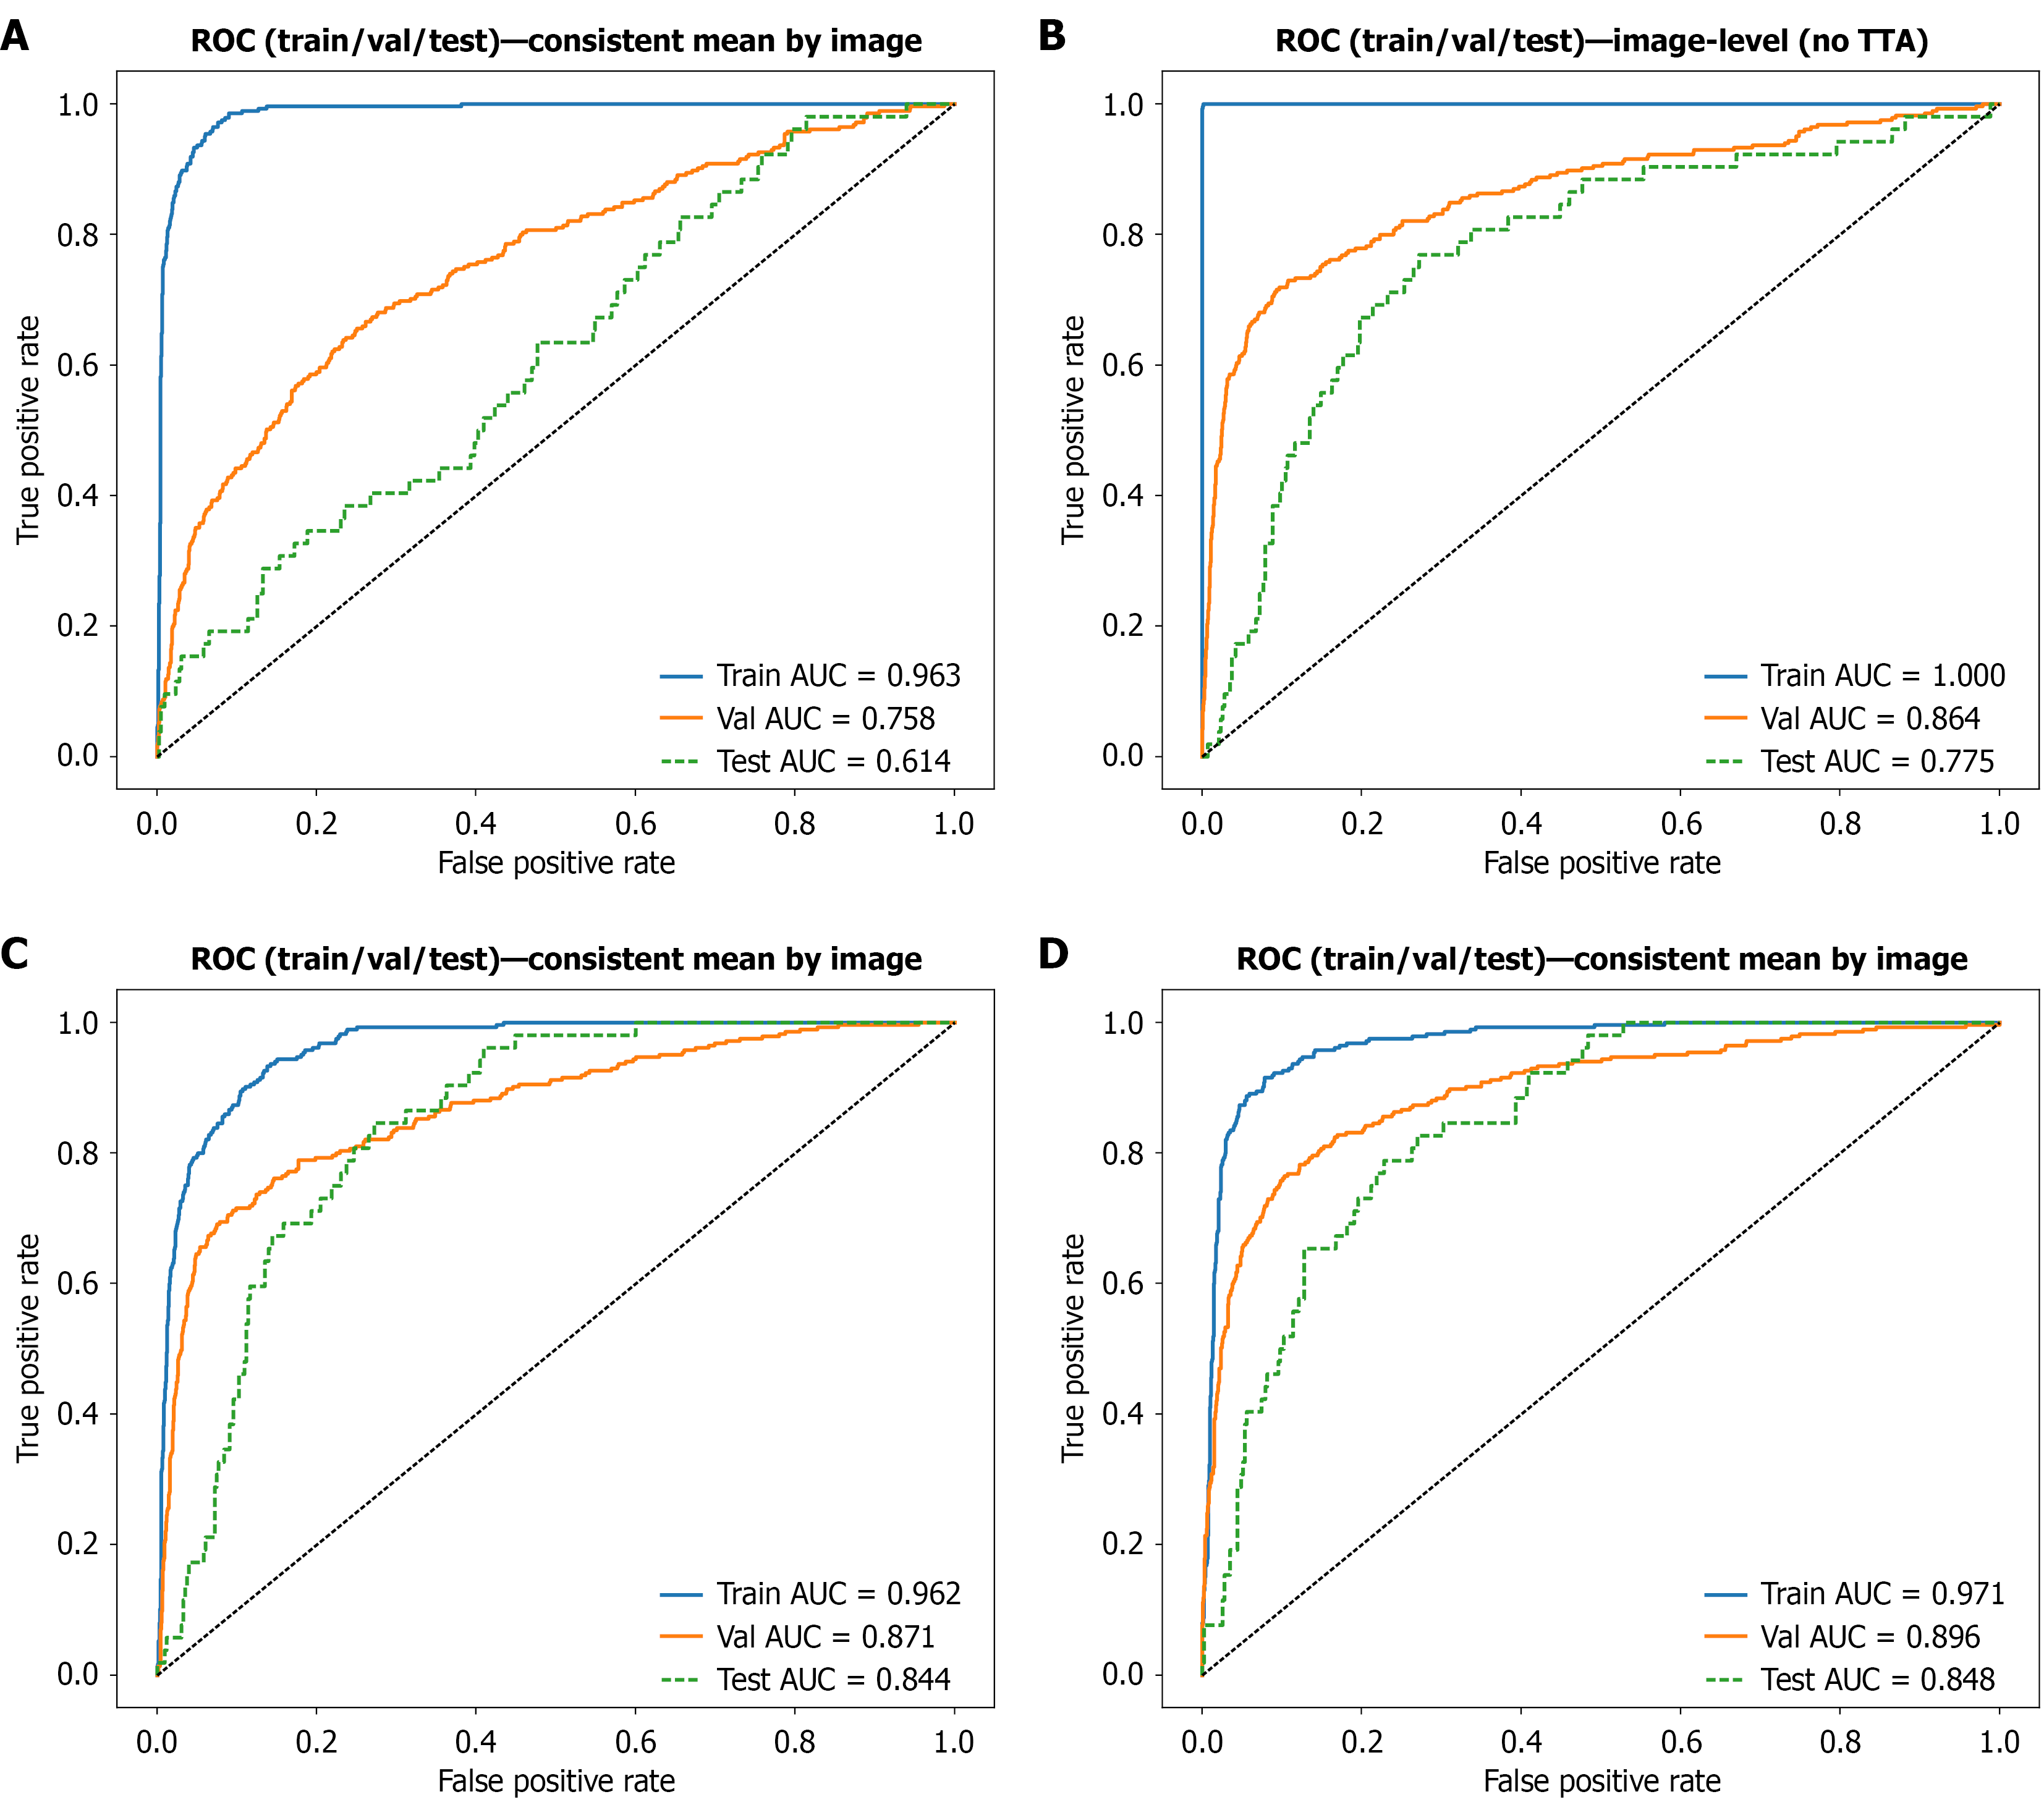
Figure 2 Receiver operating characteristic curves of the four convolutional neural network models for chemotherapy response predic
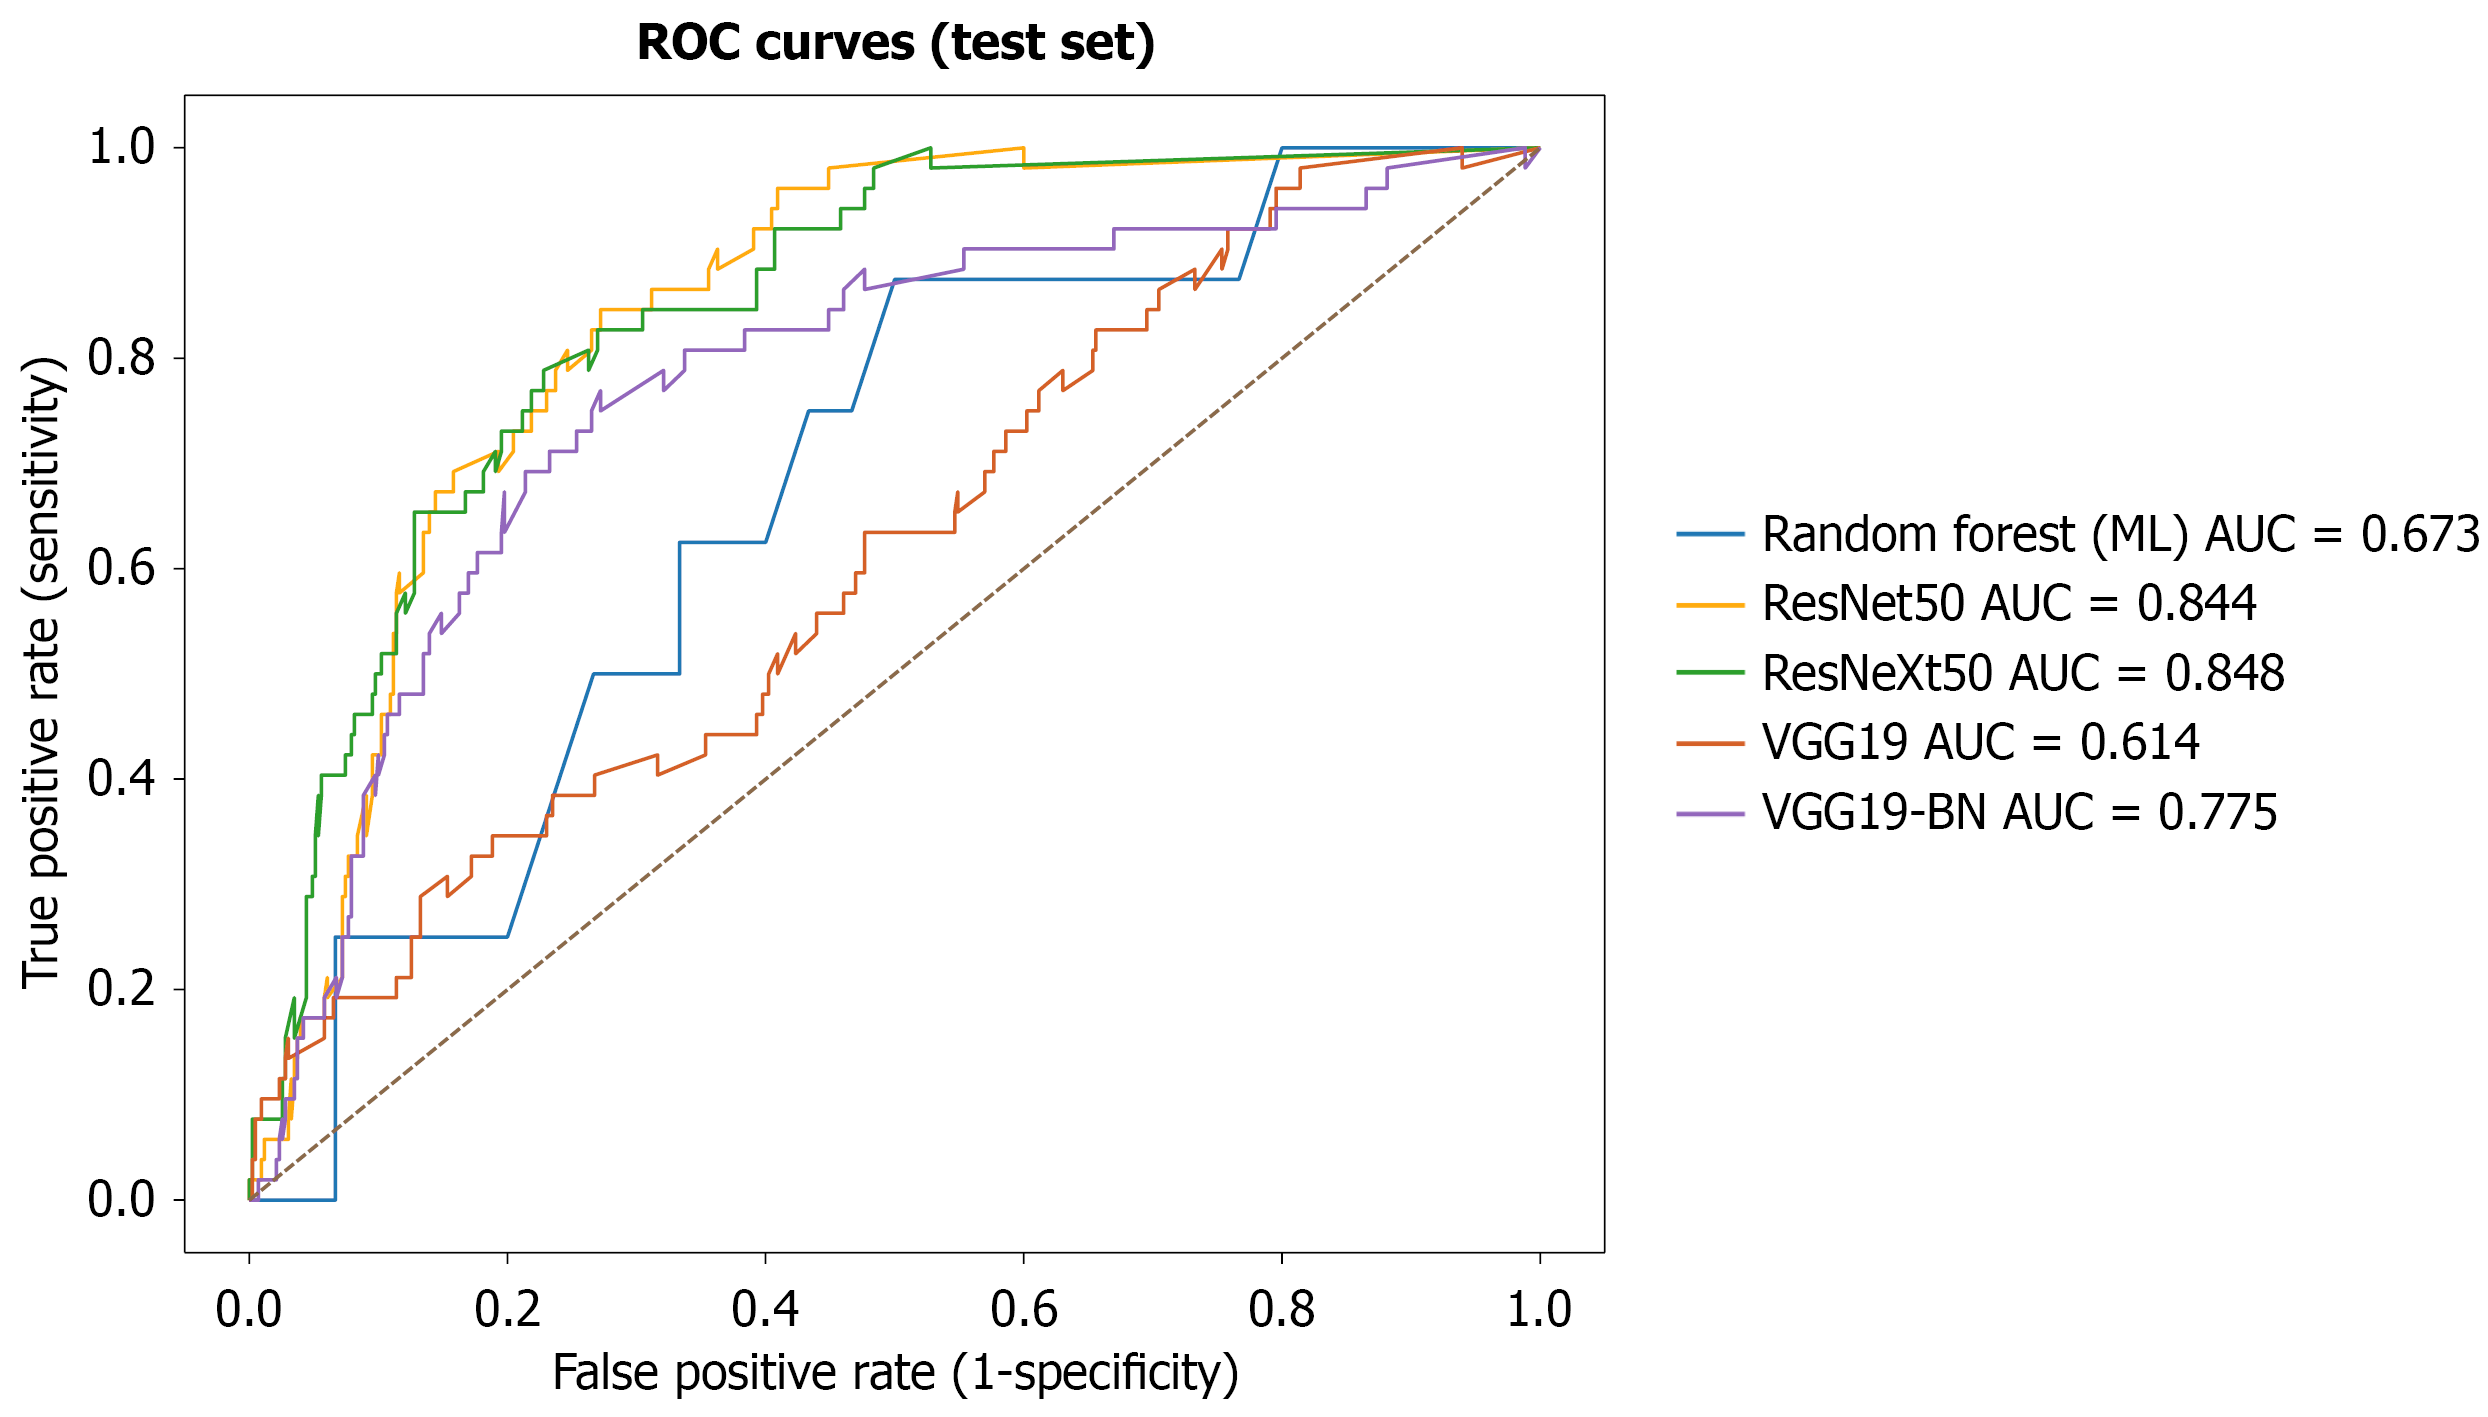
Figure 3 Comparison of receiver operating characteristic performance between the deep learning models and the carbohydrate antigen 19-9-based model.
Receiver operating characteristic curves comparing the predictive performance of four endoscopic ultrasound-based convolutional neural network models and the carbohydrate antigen 19-9-based model (random forest) in the independent test cohort are shown. The corresponding area under the receiver operating characteristic curve (AUC) values for each model are indicated in the figure legend. ResNet50 (AUC = 0.844) and ResNeXt50 (AUC = 0.848) achieved higher AUC values than the carbohydrate antigen 19-9-based random forest model (AUC = 0.673), indicating superior discriminatory performance for predicting chemotherapy response. AUC: Area under the receiver operating characteristic curve; ML: Machine learning; ROC: Receiver operating characteristic.
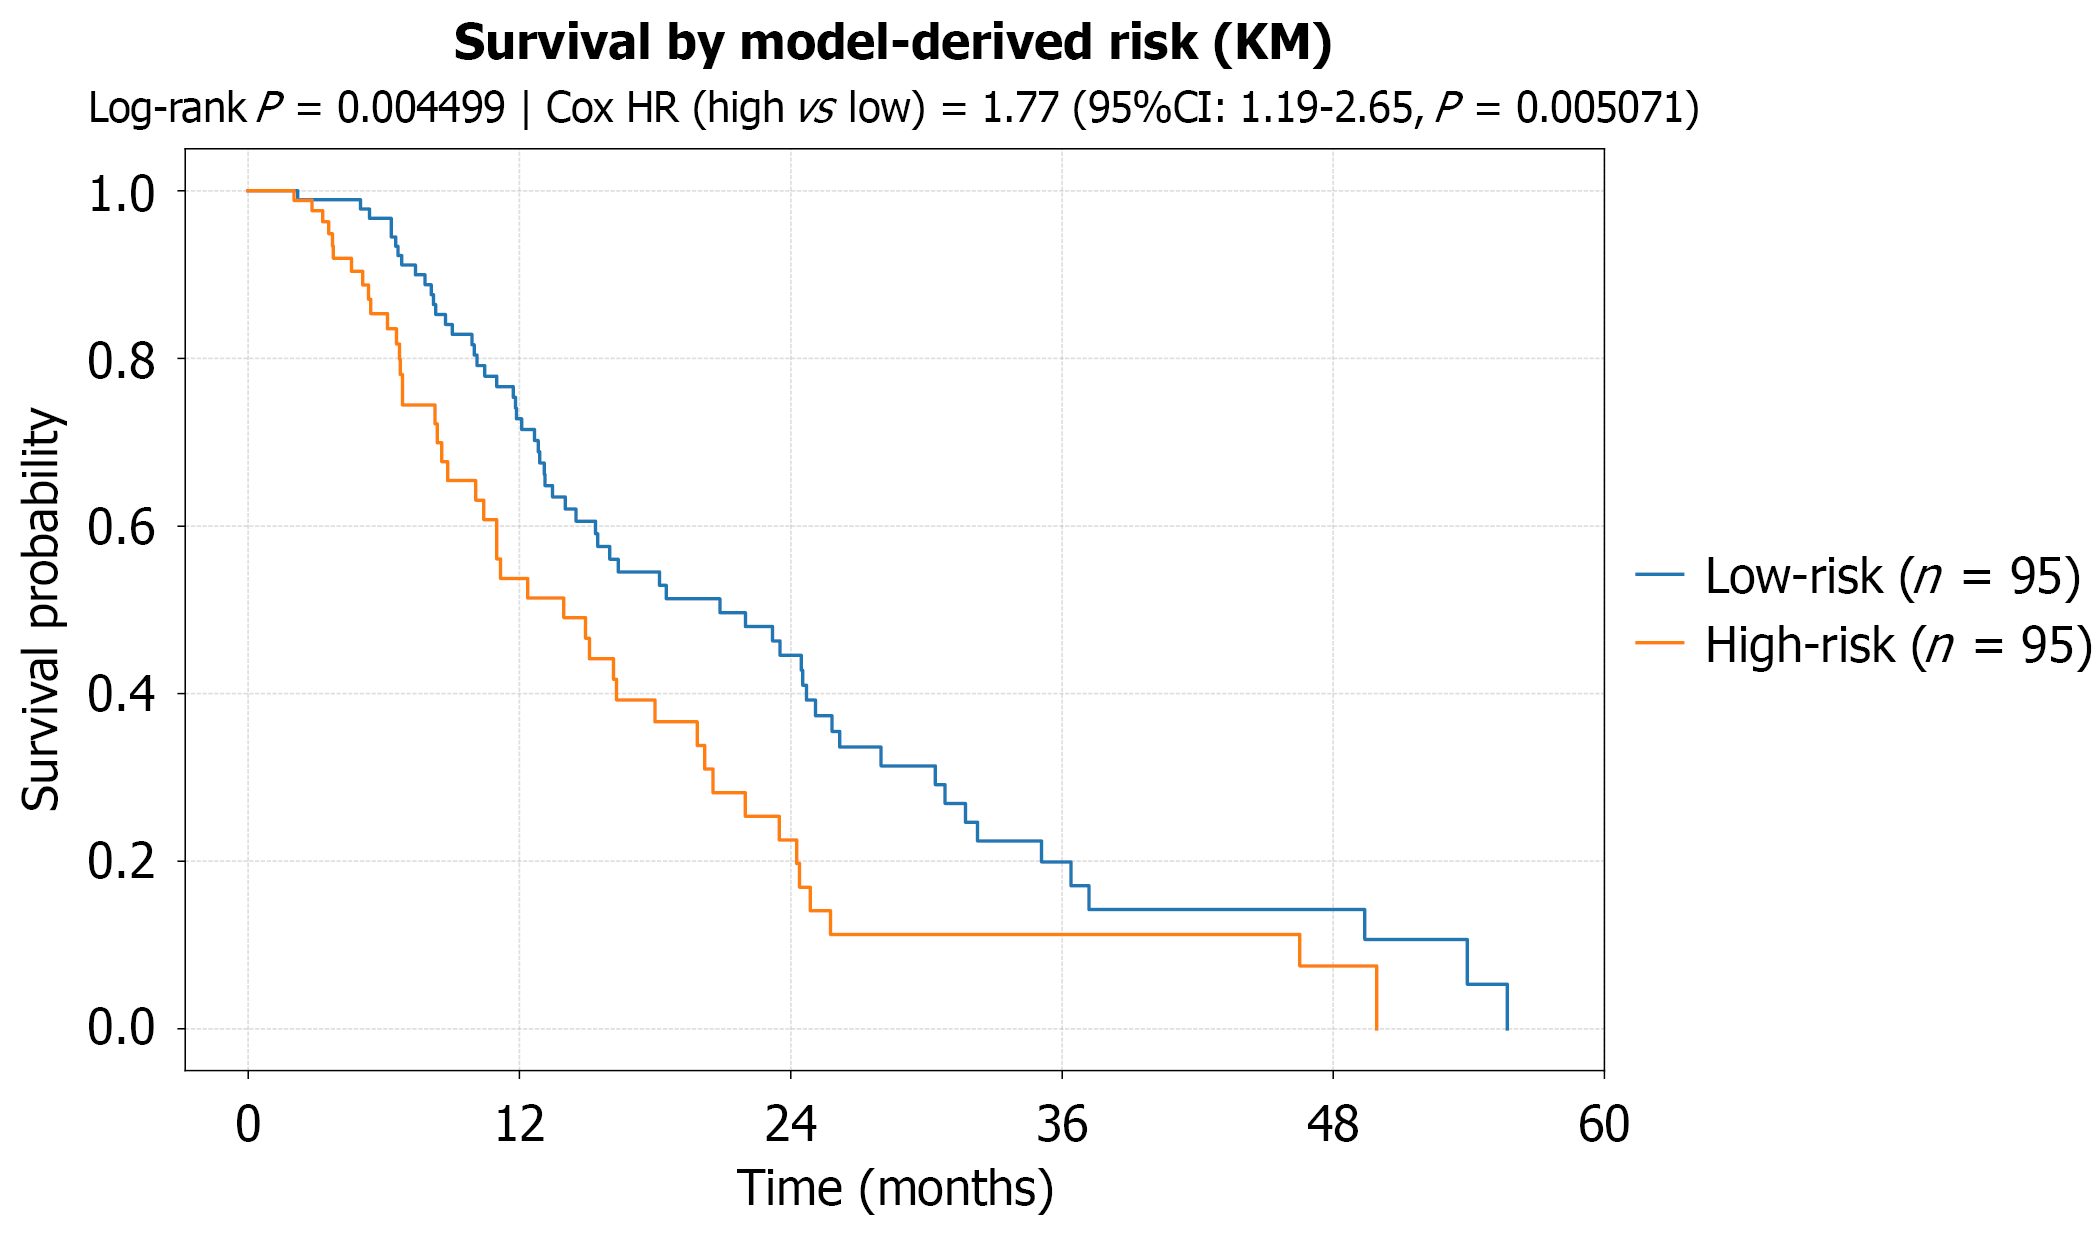
Figure 4 Kaplan–Meier overall survival curves stratified by ResNeXt50-derived risk groups.
Kaplan–Meier curves show overall survival for patients classified into low-risk (n = 95) and high-risk (n = 95) groups based on ResNeXt50-derived predicted probabilities using the median patient-level risk score of the full cohort as the cutoff. The equal group sizes reflect the use of the cohort median as the predefined cutoff and do not correspond to the RECIST-based non-progressive disease/progressive disease classification presented in Table 1. Overall survival differed significantly between the two groups (log-rank P = 0.0045). Cox proportional hazards regression analysis demonstrated a significantly higher risk of death in the high-risk group (hazard ratio = 1.77; 95% confidence interval: 1.19-2.65; P = 0.0051). CI: Confidence interval; HR: Hazard ratio; KM: Kaplan–Meier.
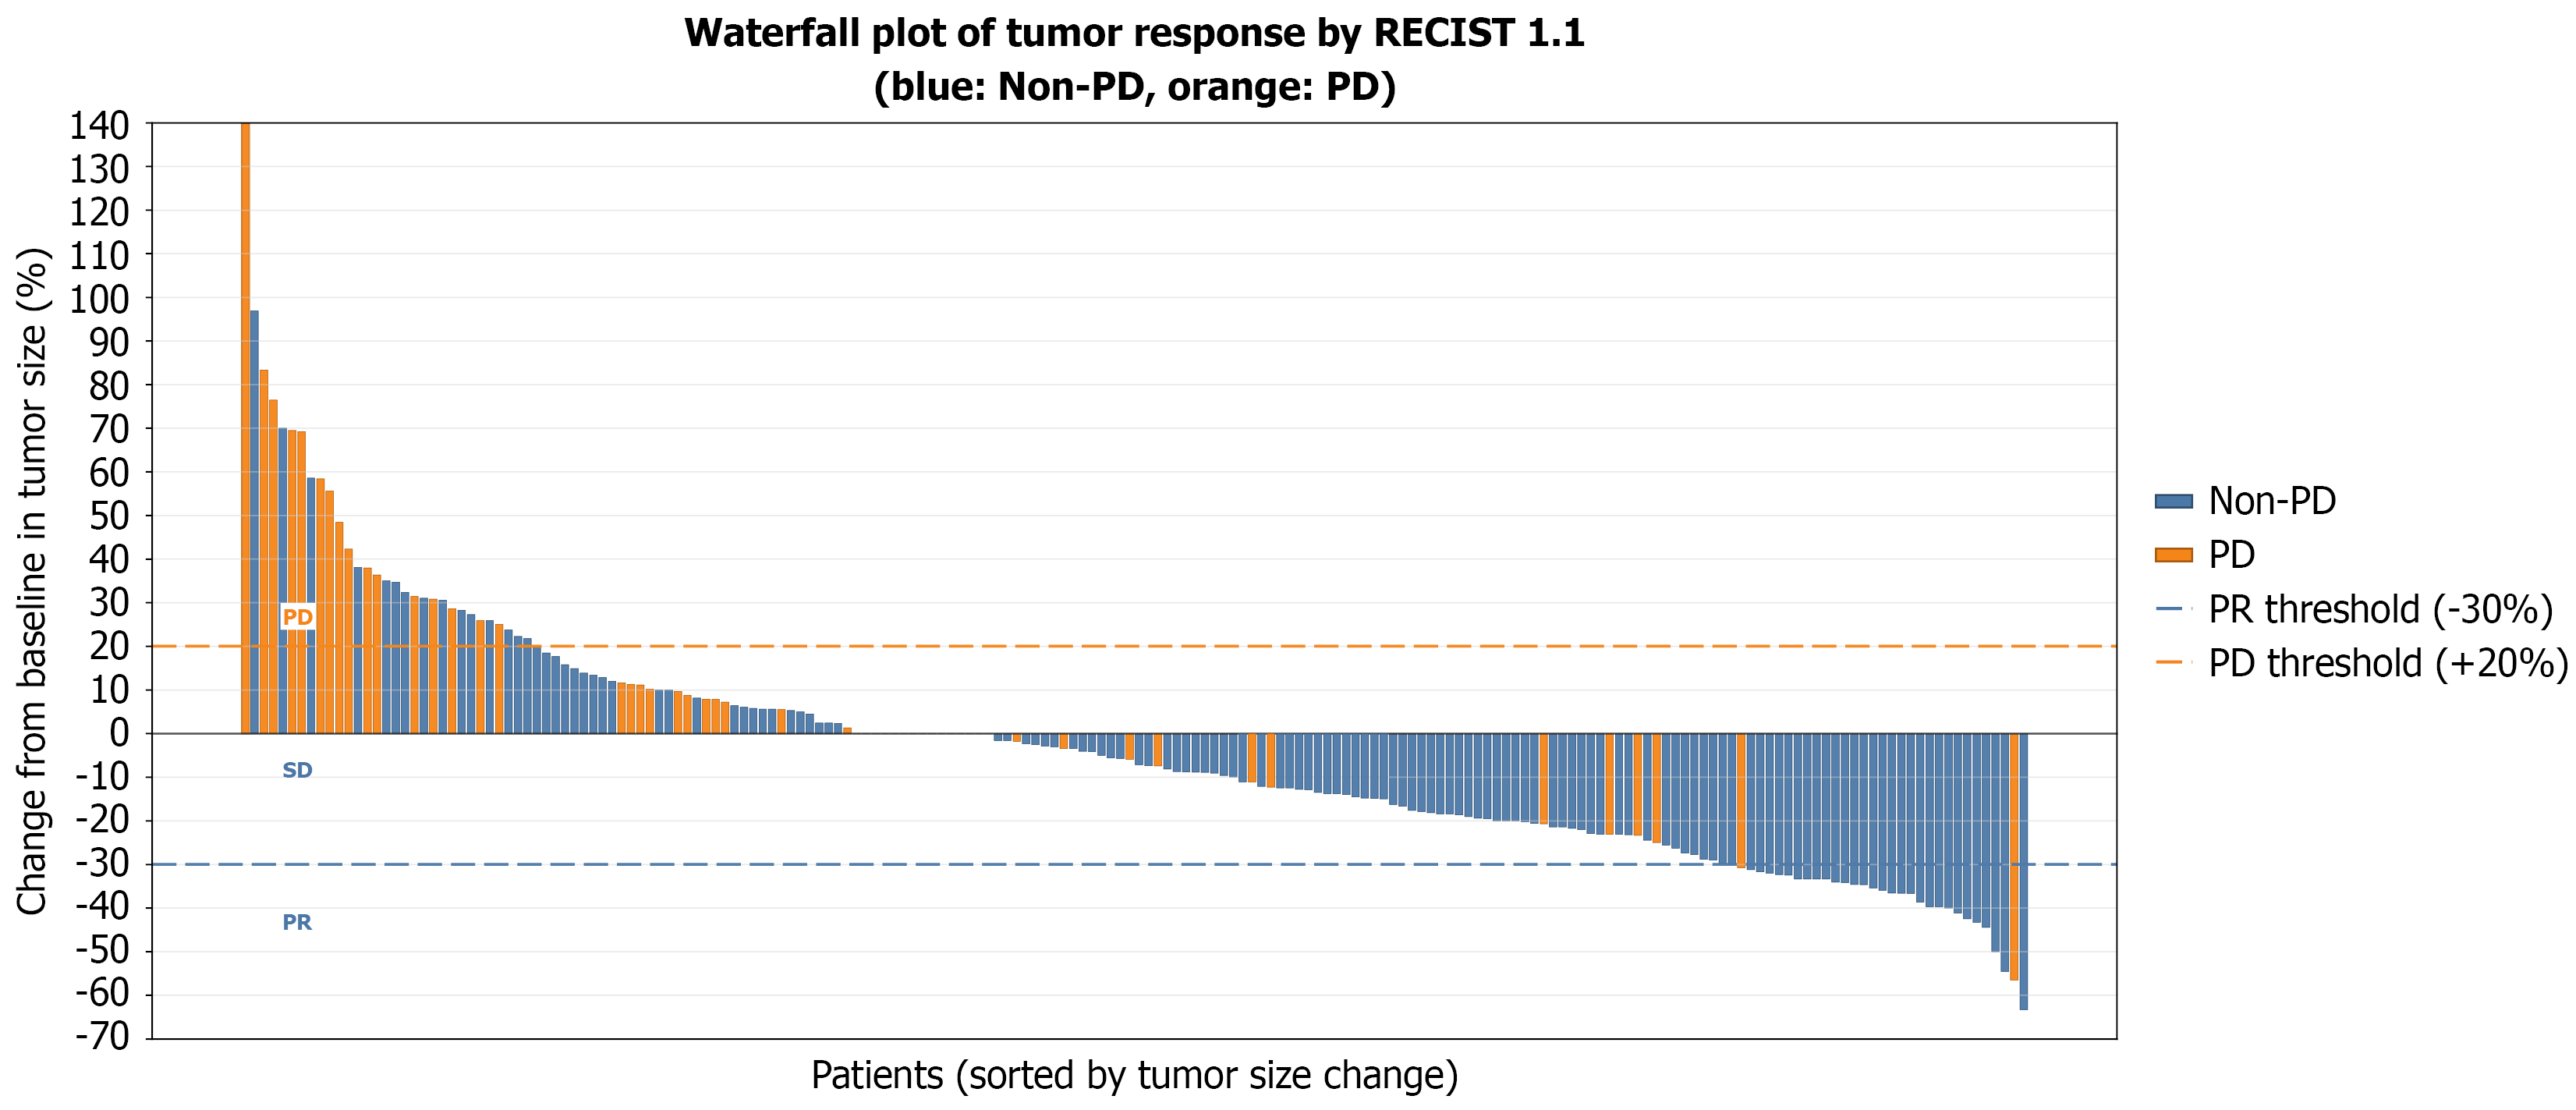
Figure 5 Waterfall plot of tumor response according to RECIST version 1.
1 stratified by chemotherapy response classification. The waterfall plot illustrates the percentage change in target lesion size from baseline for individual patients, ordered from the greatest increase to the greatest decrease in tumor size. Bars are color-coded according to the RECIST-based chemotherapy response classification (blue, non-progressive disease [non-PD; disease control]; orange, progressive disease [PD]). Dashed horizontal lines indicate the RECIST version 1.1 thresholds for partial response (−30%) and PD (+20%). The distribution of tumor size changes differed between the response groups, with a higher proportion of progressive disease observed in the PD group and a higher proportion of disease control (stable disease and partial response) observed in the non-PD group. PD: Progressive disease; PR: Partial response; RECIST: Response Evaluation Criteria in Solid Tumors.
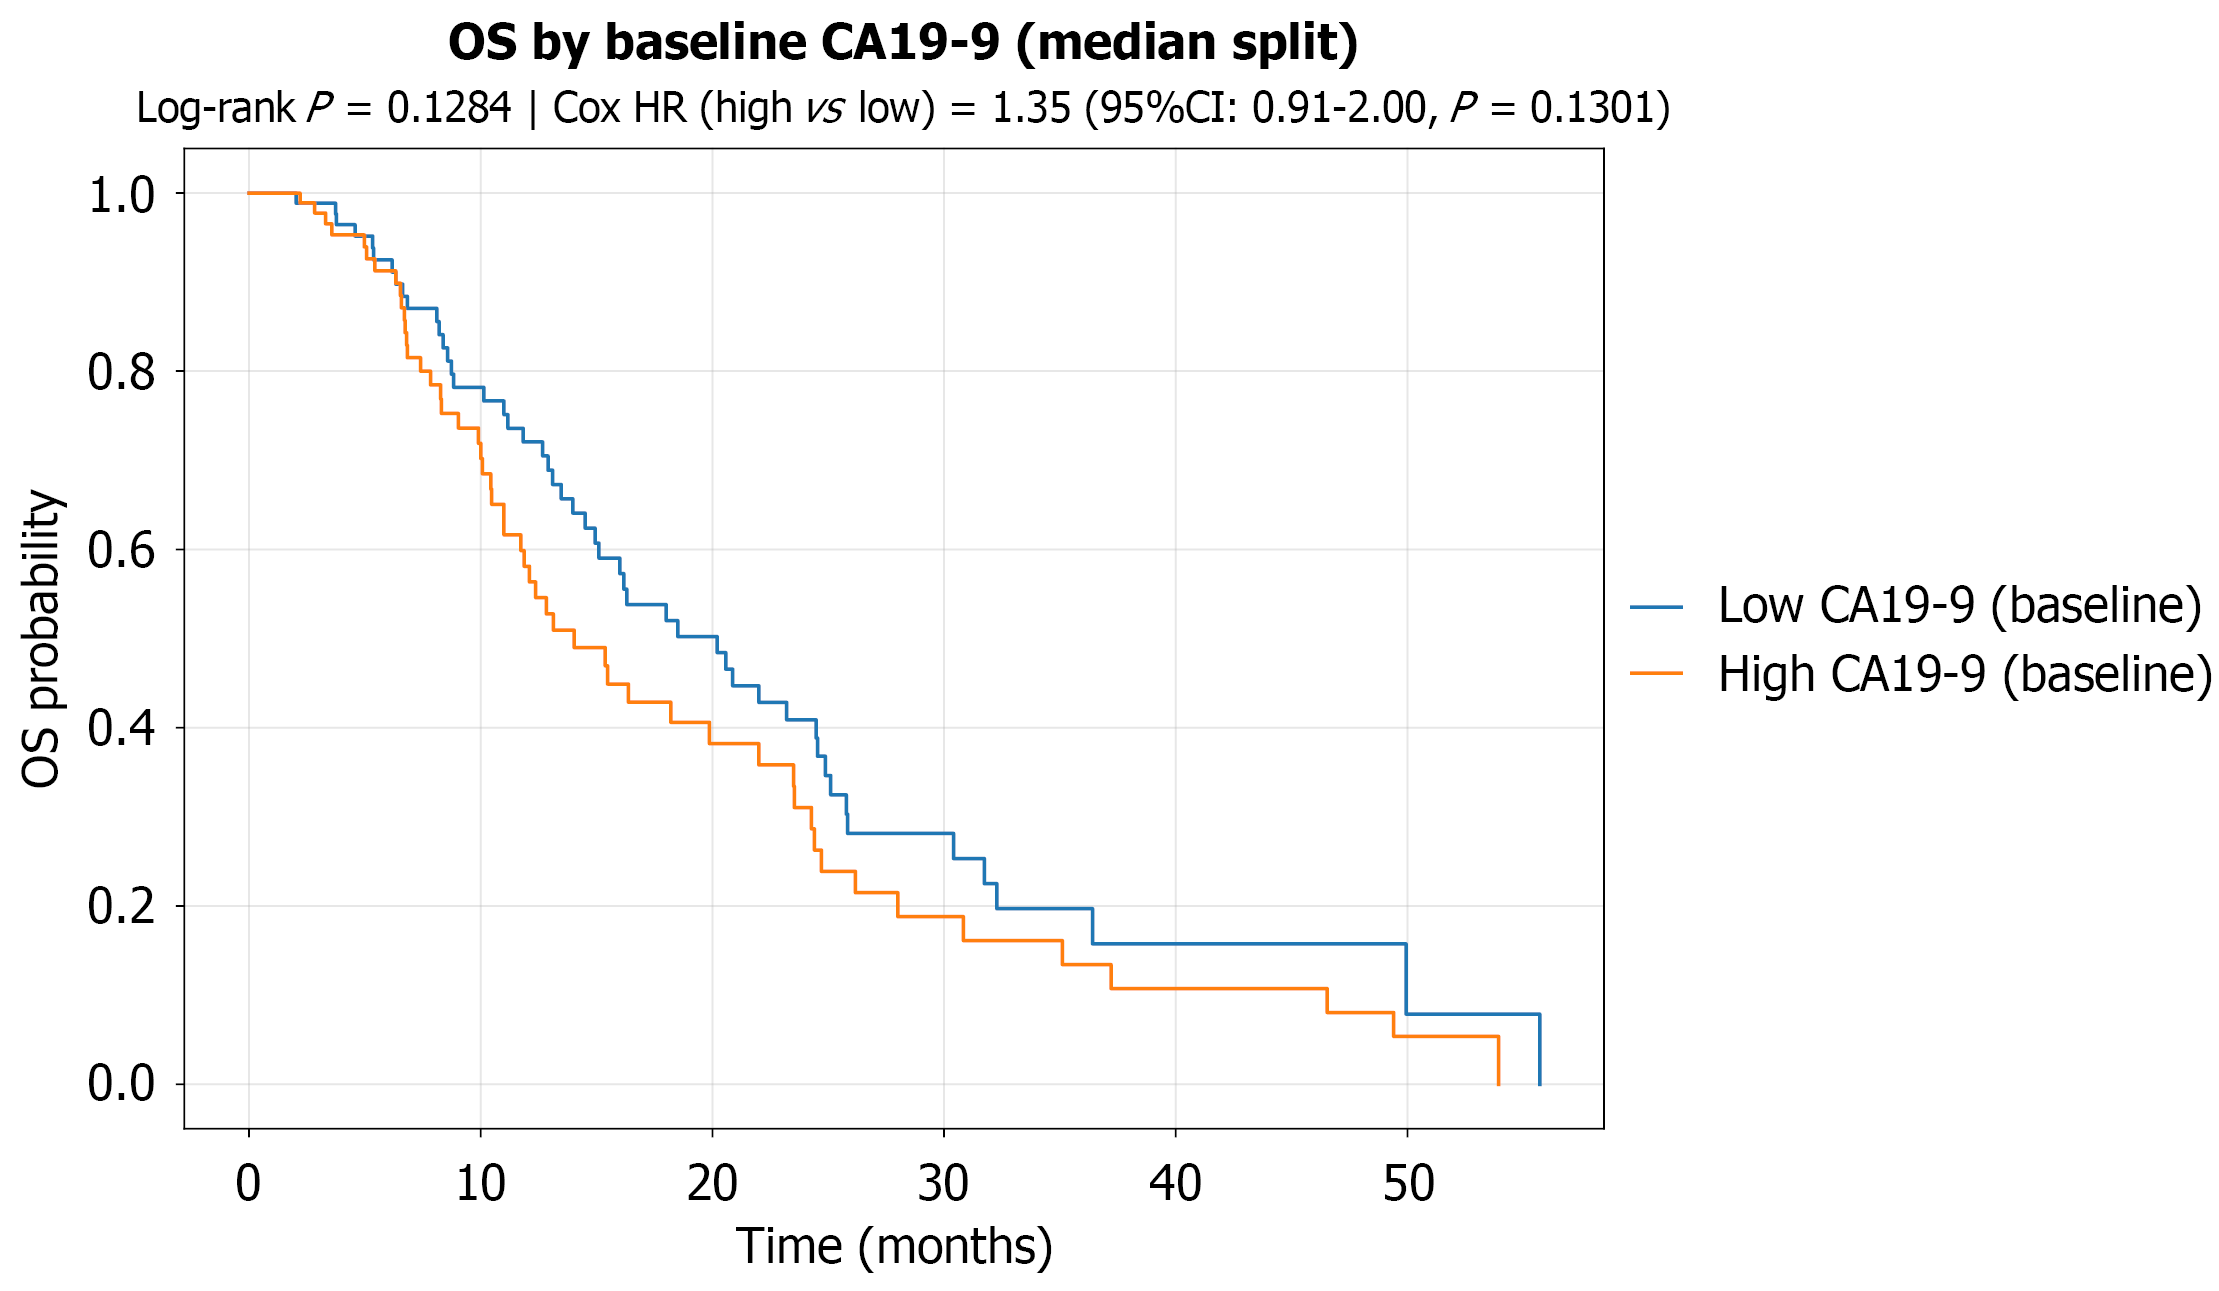
Figure 6 Kaplan–Meier overall survival curves stratified by baseline carbohydrate antigen 19-9 levels.
Kaplan–Meier overall survival curves are shown for patients stratified according to the median baseline serum carbohydrate antigen 19-9 (CA19-9) level. Overall survival did not differ significantly between the high and low CA19-9 groups (log-rank P = 0.128). Cox proportional hazards regression analysis showed no significant association between baseline CA19-9 levels and overall survival (hazard ratio = 1.35; 95% confidence interval: 0.91-2.00; P = 0.130). CA19-9: Carbohydrate antigen 19-9; CI: Confidence interval; HR: Hazard ratio; OS: Overall survival.
- Citation: Li ZH, Weng J, Zeng YH, Lin SY, Li S, Bai KH, Xu GL. Endoscopic ultrasound-based deep learning for predicting chemotherapy response in unresectable pancreatic ductal adenocarcinoma. World J Gastroenterol 2026; 32(41): 120899
- URL: https://www.wjgnet.com/1007-9327/full/v32/i41/120899.htm
- DOI: https://dx.doi.org/10.3748/wjg.120899