
















Copyright: ©Author(s) 2026.
World J Gastroenterol. Nov 7, 2026; 32(41): 120899
Published online Nov 7, 2026. doi: 10.3748/wjg.120899
Published online Nov 7, 2026. doi: 10.3748/wjg.120899
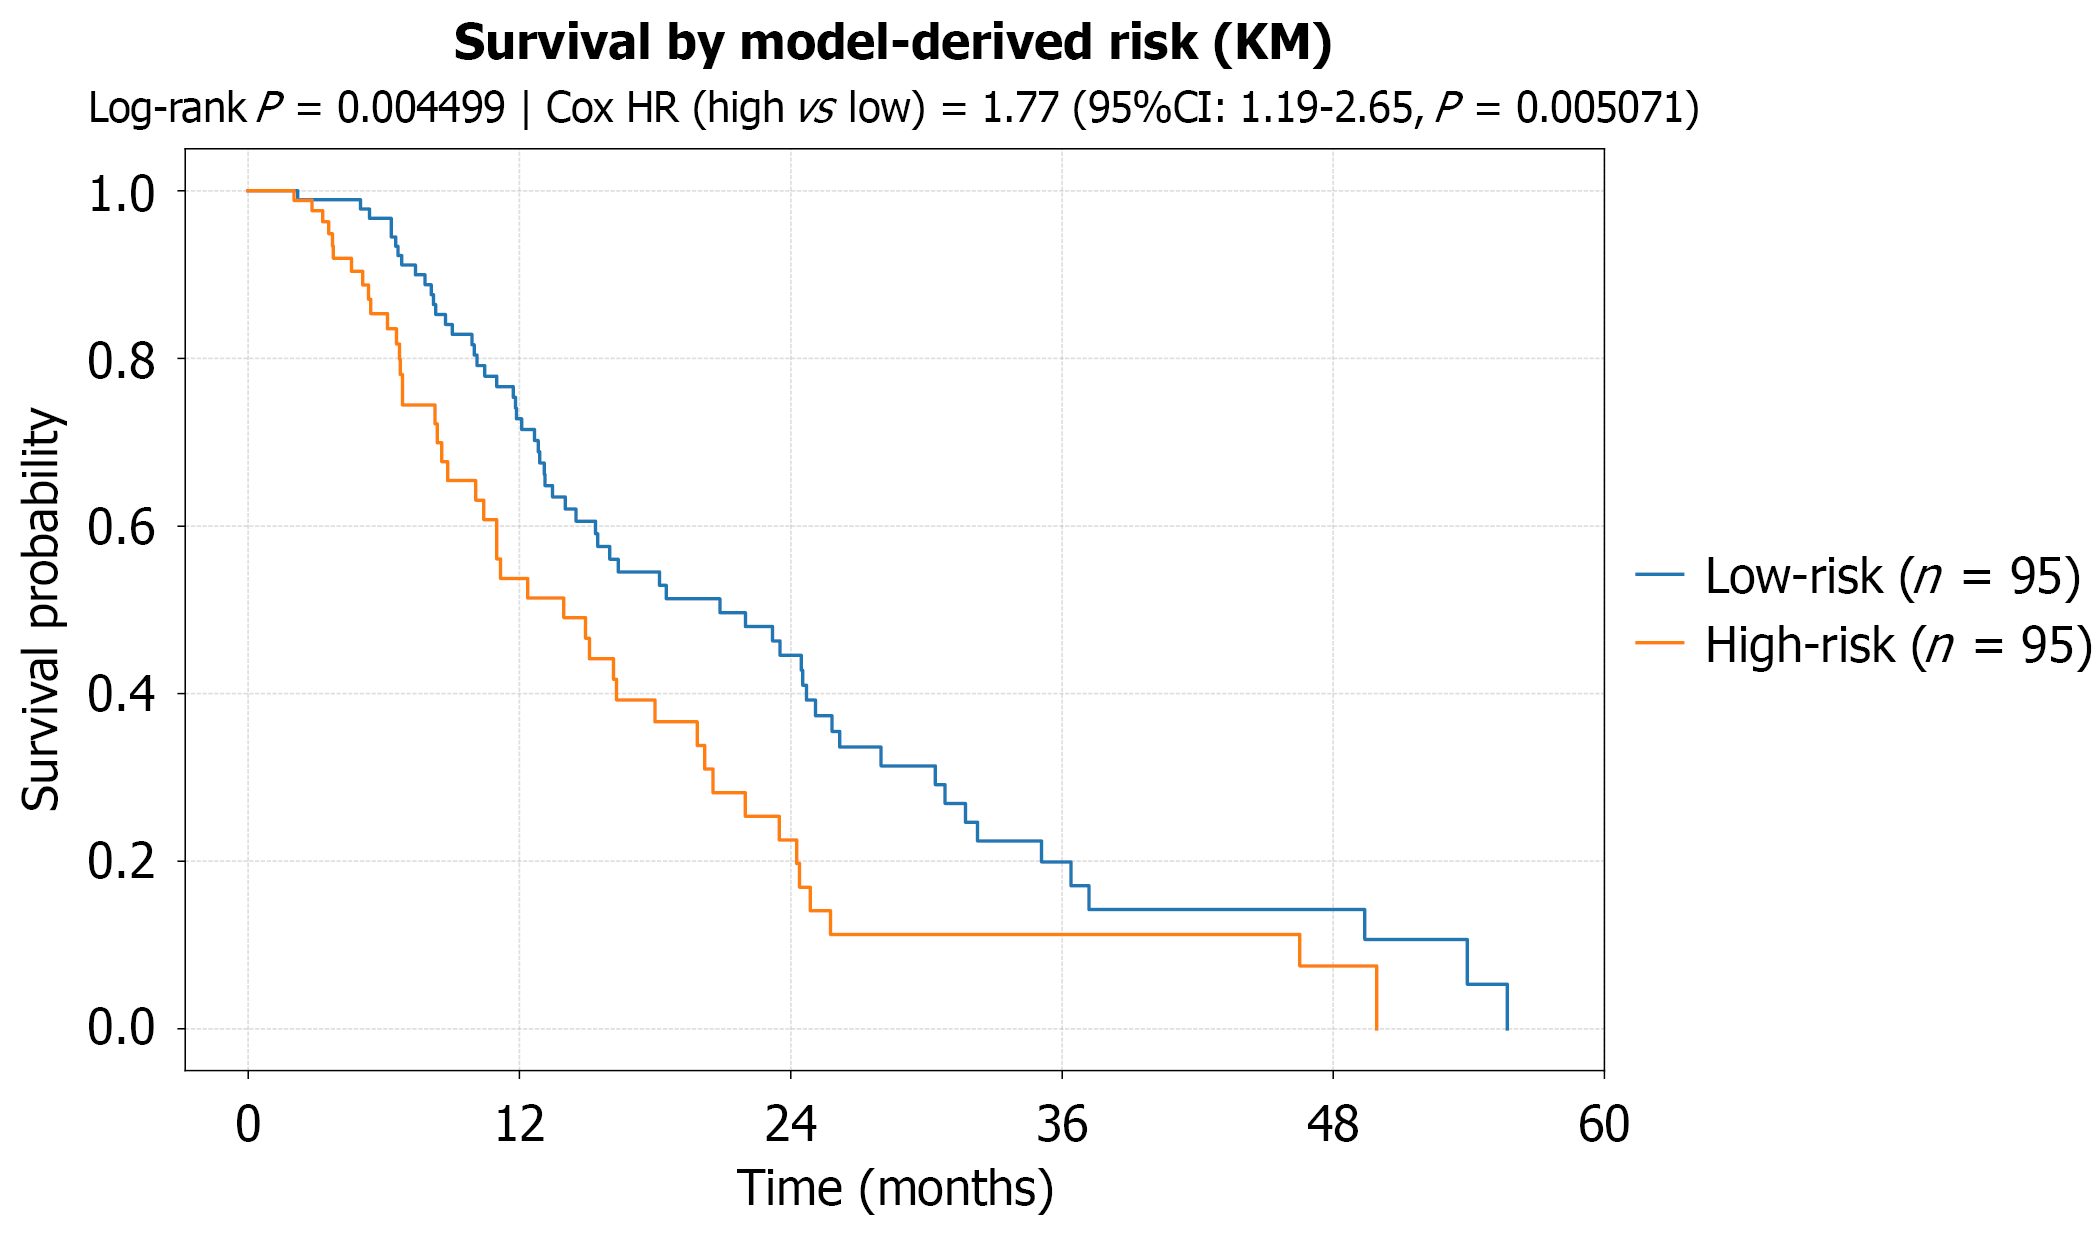
Figure 4 Kaplan–Meier overall survival curves stratified by ResNeXt50-derived risk groups.
Kaplan–Meier curves show overall survival for patients classified into low-risk (n = 95) and high-risk (n = 95) groups based on ResNeXt50-derived predicted probabilities using the median patient-level risk score of the full cohort as the cutoff. The equal group sizes reflect the use of the cohort median as the predefined cutoff and do not correspond to the RECIST-based non-progressive disease/progressive disease classification presented in Table 1. Overall survival differed significantly between the two groups (log-rank P = 0.0045). Cox proportional hazards regression analysis demonstrated a significantly higher risk of death in the high-risk group (hazard ratio = 1.77; 95% confidence interval: 1.19-2.65; P = 0.0051). CI: Confidence interval; HR: Hazard ratio; KM: Kaplan–Meier.
- Citation: Li ZH, Weng J, Zeng YH, Lin SY, Li S, Bai KH, Xu GL. Endoscopic ultrasound-based deep learning for predicting chemotherapy response in unresectable pancreatic ductal adenocarcinoma. World J Gastroenterol 2026; 32(41): 120899
- URL: https://www.wjgnet.com/1007-9327/full/v32/i41/120899.htm
- DOI: https://dx.doi.org/10.3748/wjg.120899