
















Copyright: ©Author(s) 2026.
World J Gastroenterol. Nov 7, 2026; 32(41): 120899
Published online Nov 7, 2026. doi: 10.3748/wjg.120899
Published online Nov 7, 2026. doi: 10.3748/wjg.120899
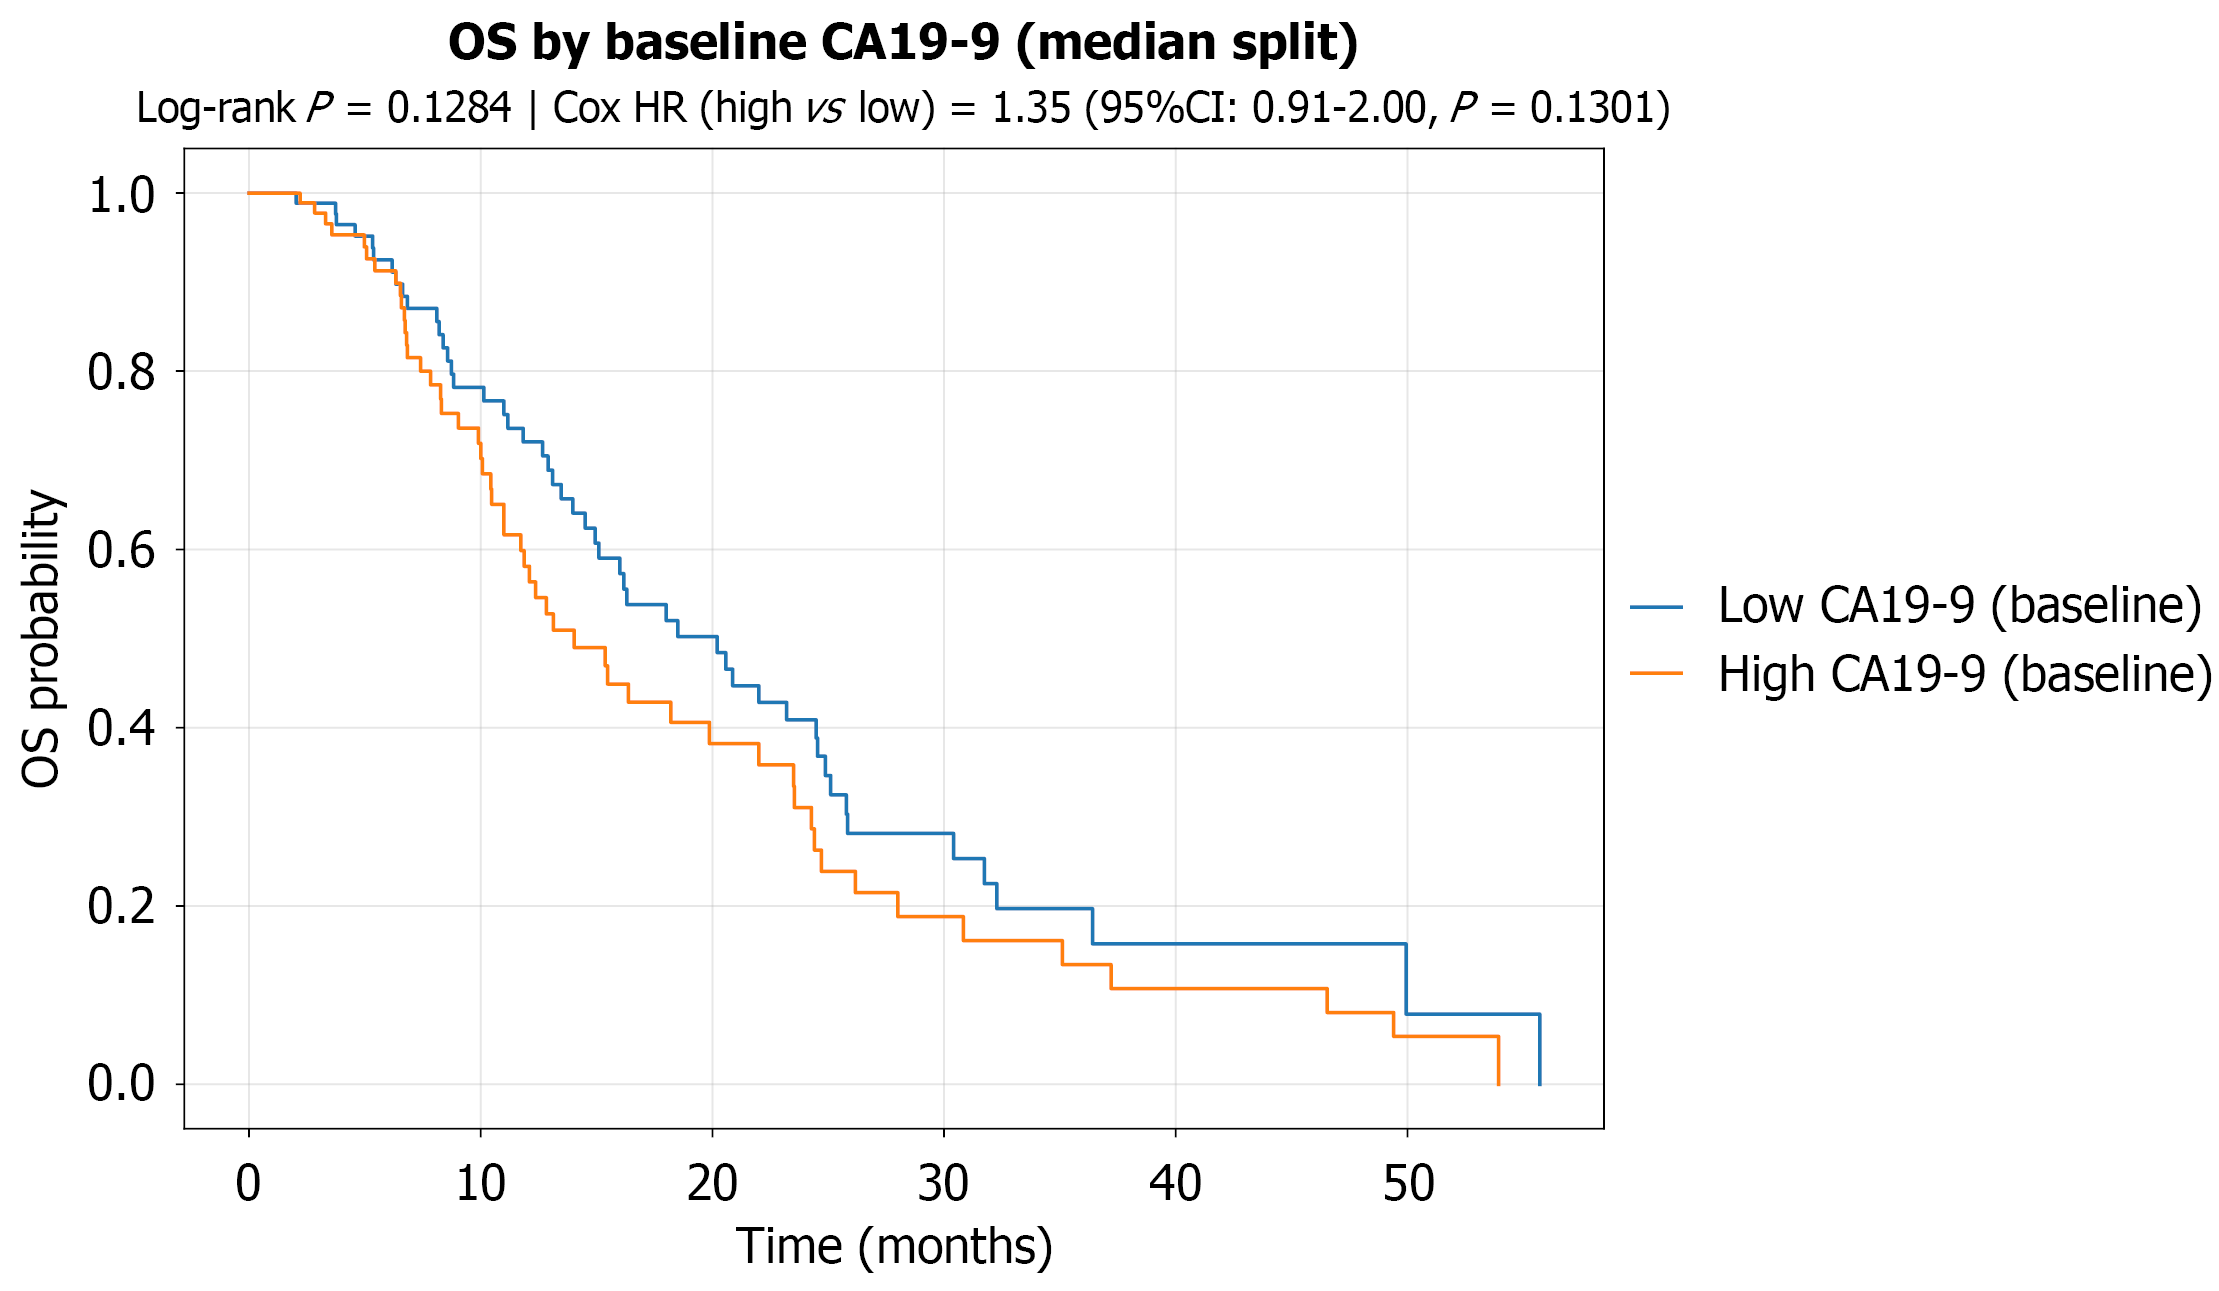
Figure 6 Kaplan–Meier overall survival curves stratified by baseline carbohydrate antigen 19-9 levels.
Kaplan–Meier overall survival curves are shown for patients stratified according to the median baseline serum carbohydrate antigen 19-9 (CA19-9) level. Overall survival did not differ significantly between the high and low CA19-9 groups (log-rank P = 0.128). Cox proportional hazards regression analysis showed no significant association between baseline CA19-9 levels and overall survival (hazard ratio = 1.35; 95% confidence interval: 0.91-2.00; P = 0.130). CA19-9: Carbohydrate antigen 19-9; CI: Confidence interval; HR: Hazard ratio; OS: Overall survival.
- Citation: Li ZH, Weng J, Zeng YH, Lin SY, Li S, Bai KH, Xu GL. Endoscopic ultrasound-based deep learning for predicting chemotherapy response in unresectable pancreatic ductal adenocarcinoma. World J Gastroenterol 2026; 32(41): 120899
- URL: https://www.wjgnet.com/1007-9327/full/v32/i41/120899.htm
- DOI: https://dx.doi.org/10.3748/wjg.120899