
















Copyright: ©Author(s) 2026.
World J Gastroenterol. Nov 7, 2026; 32(41): 120899
Published online Nov 7, 2026. doi: 10.3748/wjg.120899
Published online Nov 7, 2026. doi: 10.3748/wjg.120899
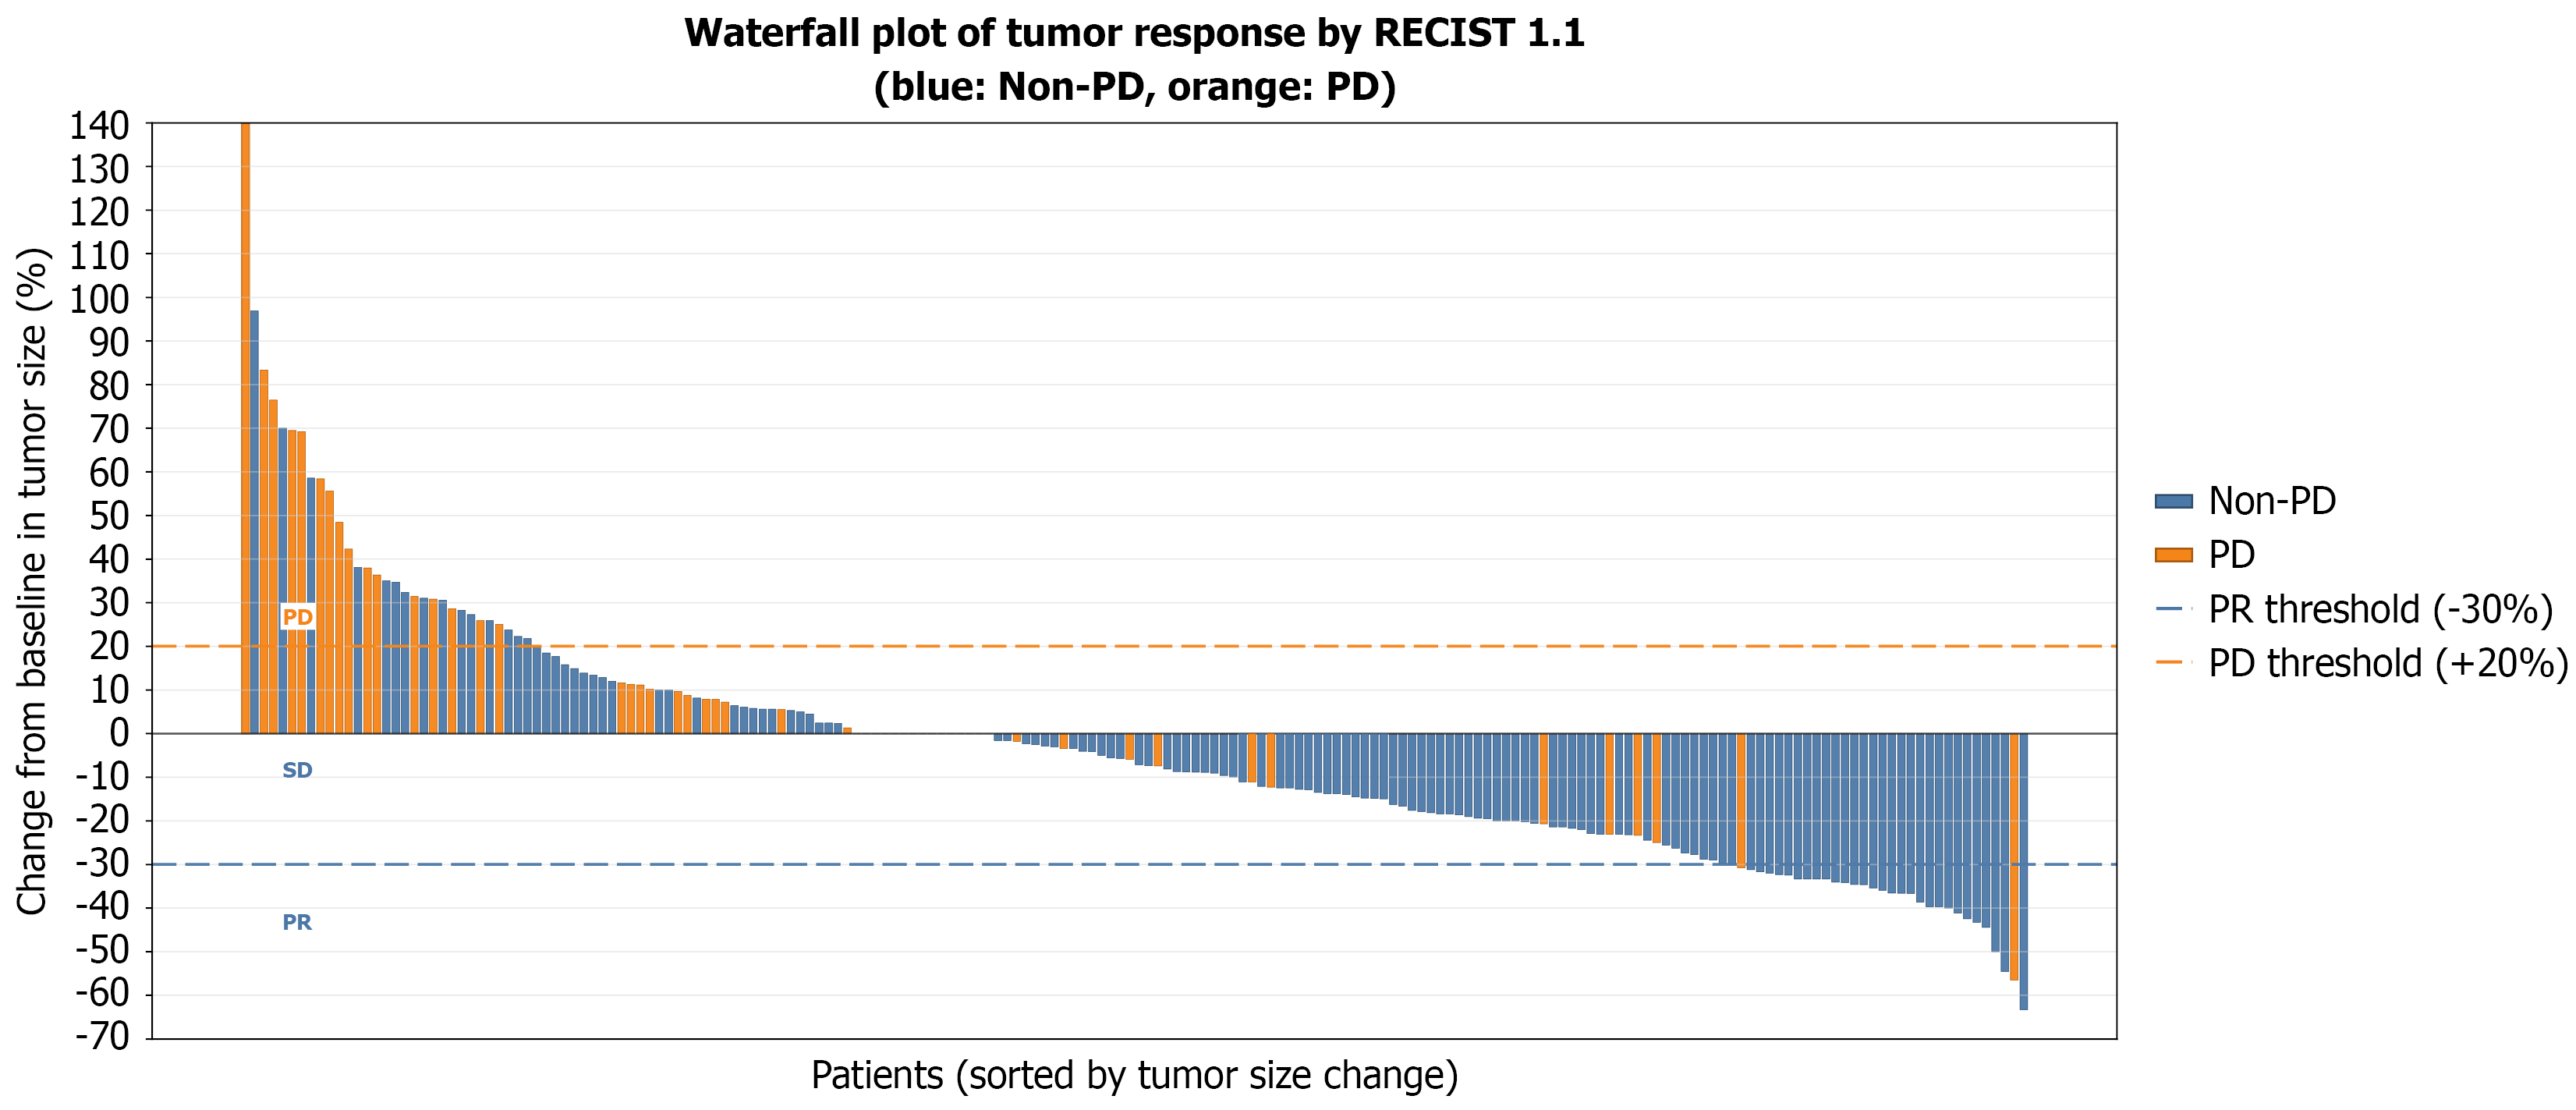
Figure 5 Waterfall plot of tumor response according to RECIST version 1.
1 stratified by chemotherapy response classification. The waterfall plot illustrates the percentage change in target lesion size from baseline for individual patients, ordered from the greatest increase to the greatest decrease in tumor size. Bars are color-coded according to the RECIST-based chemotherapy response classification (blue, non-progressive disease [non-PD; disease control]; orange, progressive disease [PD]). Dashed horizontal lines indicate the RECIST version 1.1 thresholds for partial response (−30%) and PD (+20%). The distribution of tumor size changes differed between the response groups, with a higher proportion of progressive disease observed in the PD group and a higher proportion of disease control (stable disease and partial response) observed in the non-PD group. PD: Progressive disease; PR: Partial response; RECIST: Response Evaluation Criteria in Solid Tumors.
- Citation: Li ZH, Weng J, Zeng YH, Lin SY, Li S, Bai KH, Xu GL. Endoscopic ultrasound-based deep learning for predicting chemotherapy response in unresectable pancreatic ductal adenocarcinoma. World J Gastroenterol 2026; 32(41): 120899
- URL: https://www.wjgnet.com/1007-9327/full/v32/i41/120899.htm
- DOI: https://dx.doi.org/10.3748/wjg.120899