











BPG is committed to discovery and dissemination of knowledge
Retrospective Study
Copyright: ©Author(s) 2026.
World J Gastroenterol. Nov 7, 2026; 32(41): 120899
Published online Nov 7, 2026. doi: 10.3748/wjg.120899
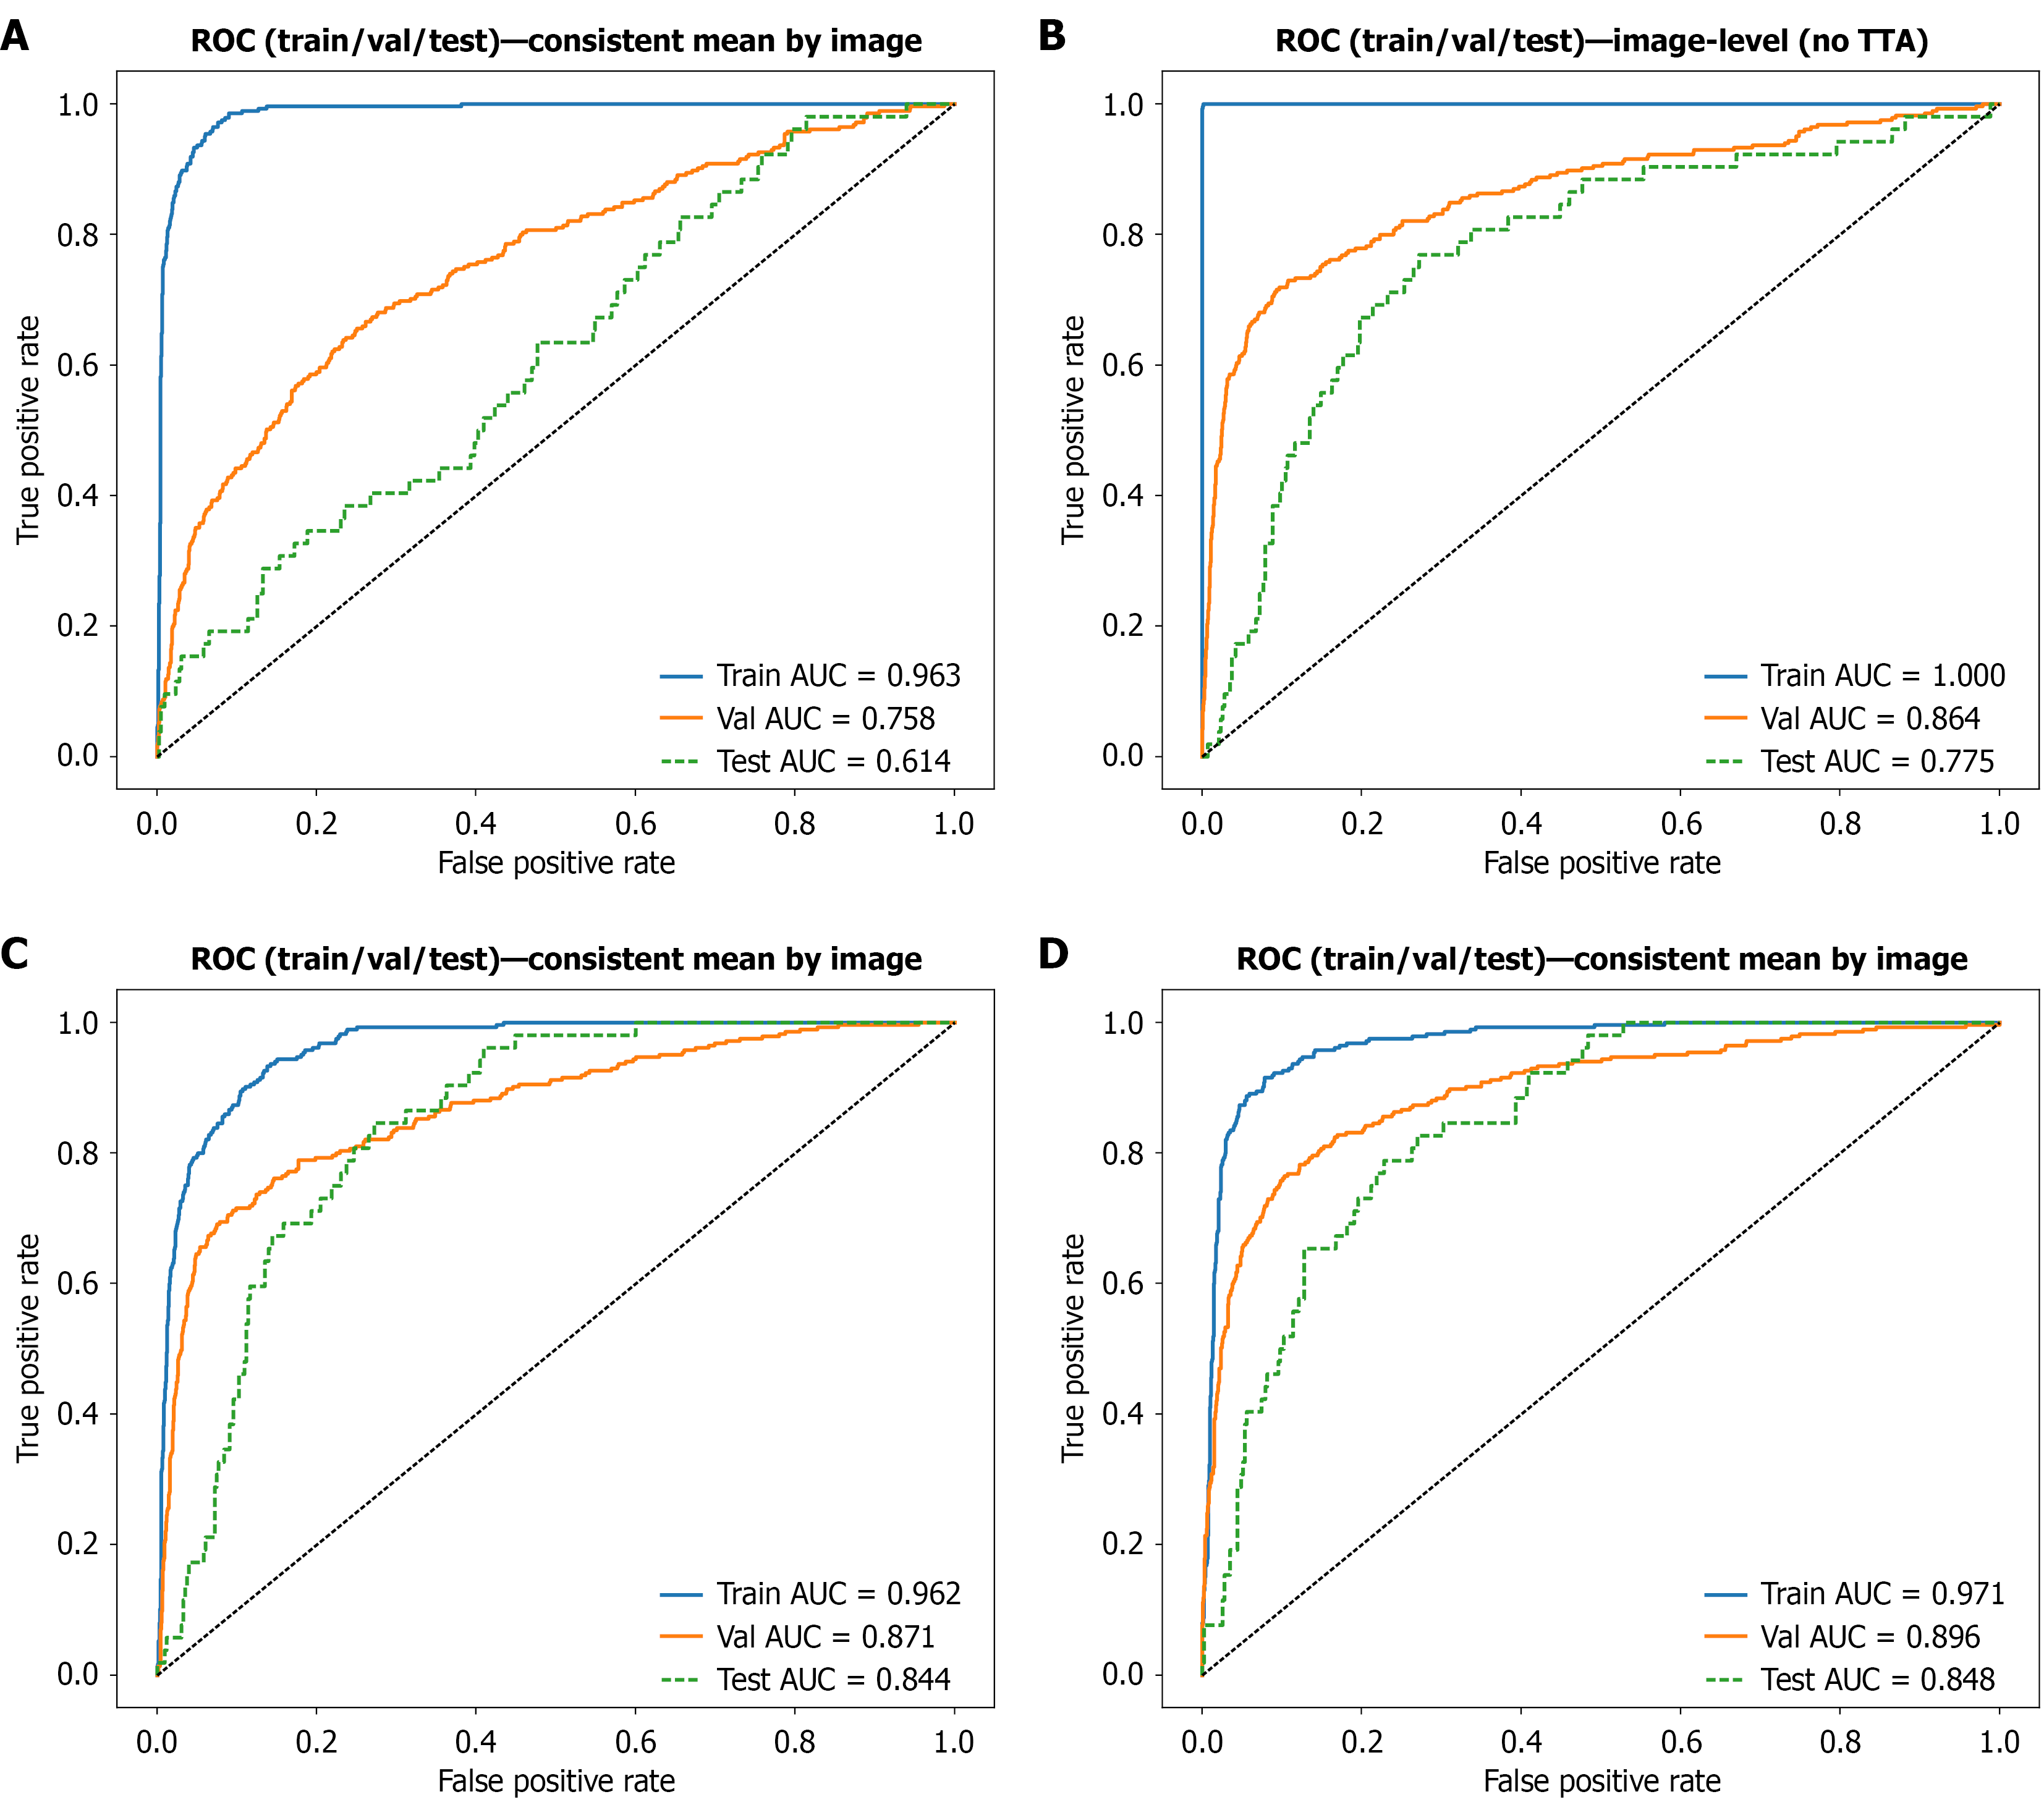
Figure 2
Figure 2 Receiver operating characteristic curves of the four convolutional neural network models for chemotherapy response prediction. Each panel displays the receiver operating characteristic curves of a single convolutional neural network architecture across the training cohort (blue solid line), internal validation cohort (orange solid line), and independent test cohort (green dashed line). All dataset splits and performance evaluations were performed at the patient level, with image-level predicted probabilities aggregated to the patient level using top-3 probability averaging, defined as the arithmetic mean of the three highest image-level predicted probabilities for each patient, or the arithmetic mean of all available image-level probabilities when fewer than three images were available. The corresponding area under the receiver operating characteristic curve values for each model and cohort are indicated within each panel. A: VGG19; B: VGG19-BN (image-level, without patient-level aggregation or test-time augmentation, shown for reference only); C: ResNet50; D: ResNeXt50. AUC: Area under the receiver operating characteristic curve; ROC: Receiver operating characteristic.


Write to the Help Desk