Copyright
©The Author(s) 2018.
World J Gastroenterol. Feb 14, 2018; 24(6): 693-705
Published online Feb 14, 2018. doi: 10.3748/wjg.v24.i6.693
Published online Feb 14, 2018. doi: 10.3748/wjg.v24.i6.693
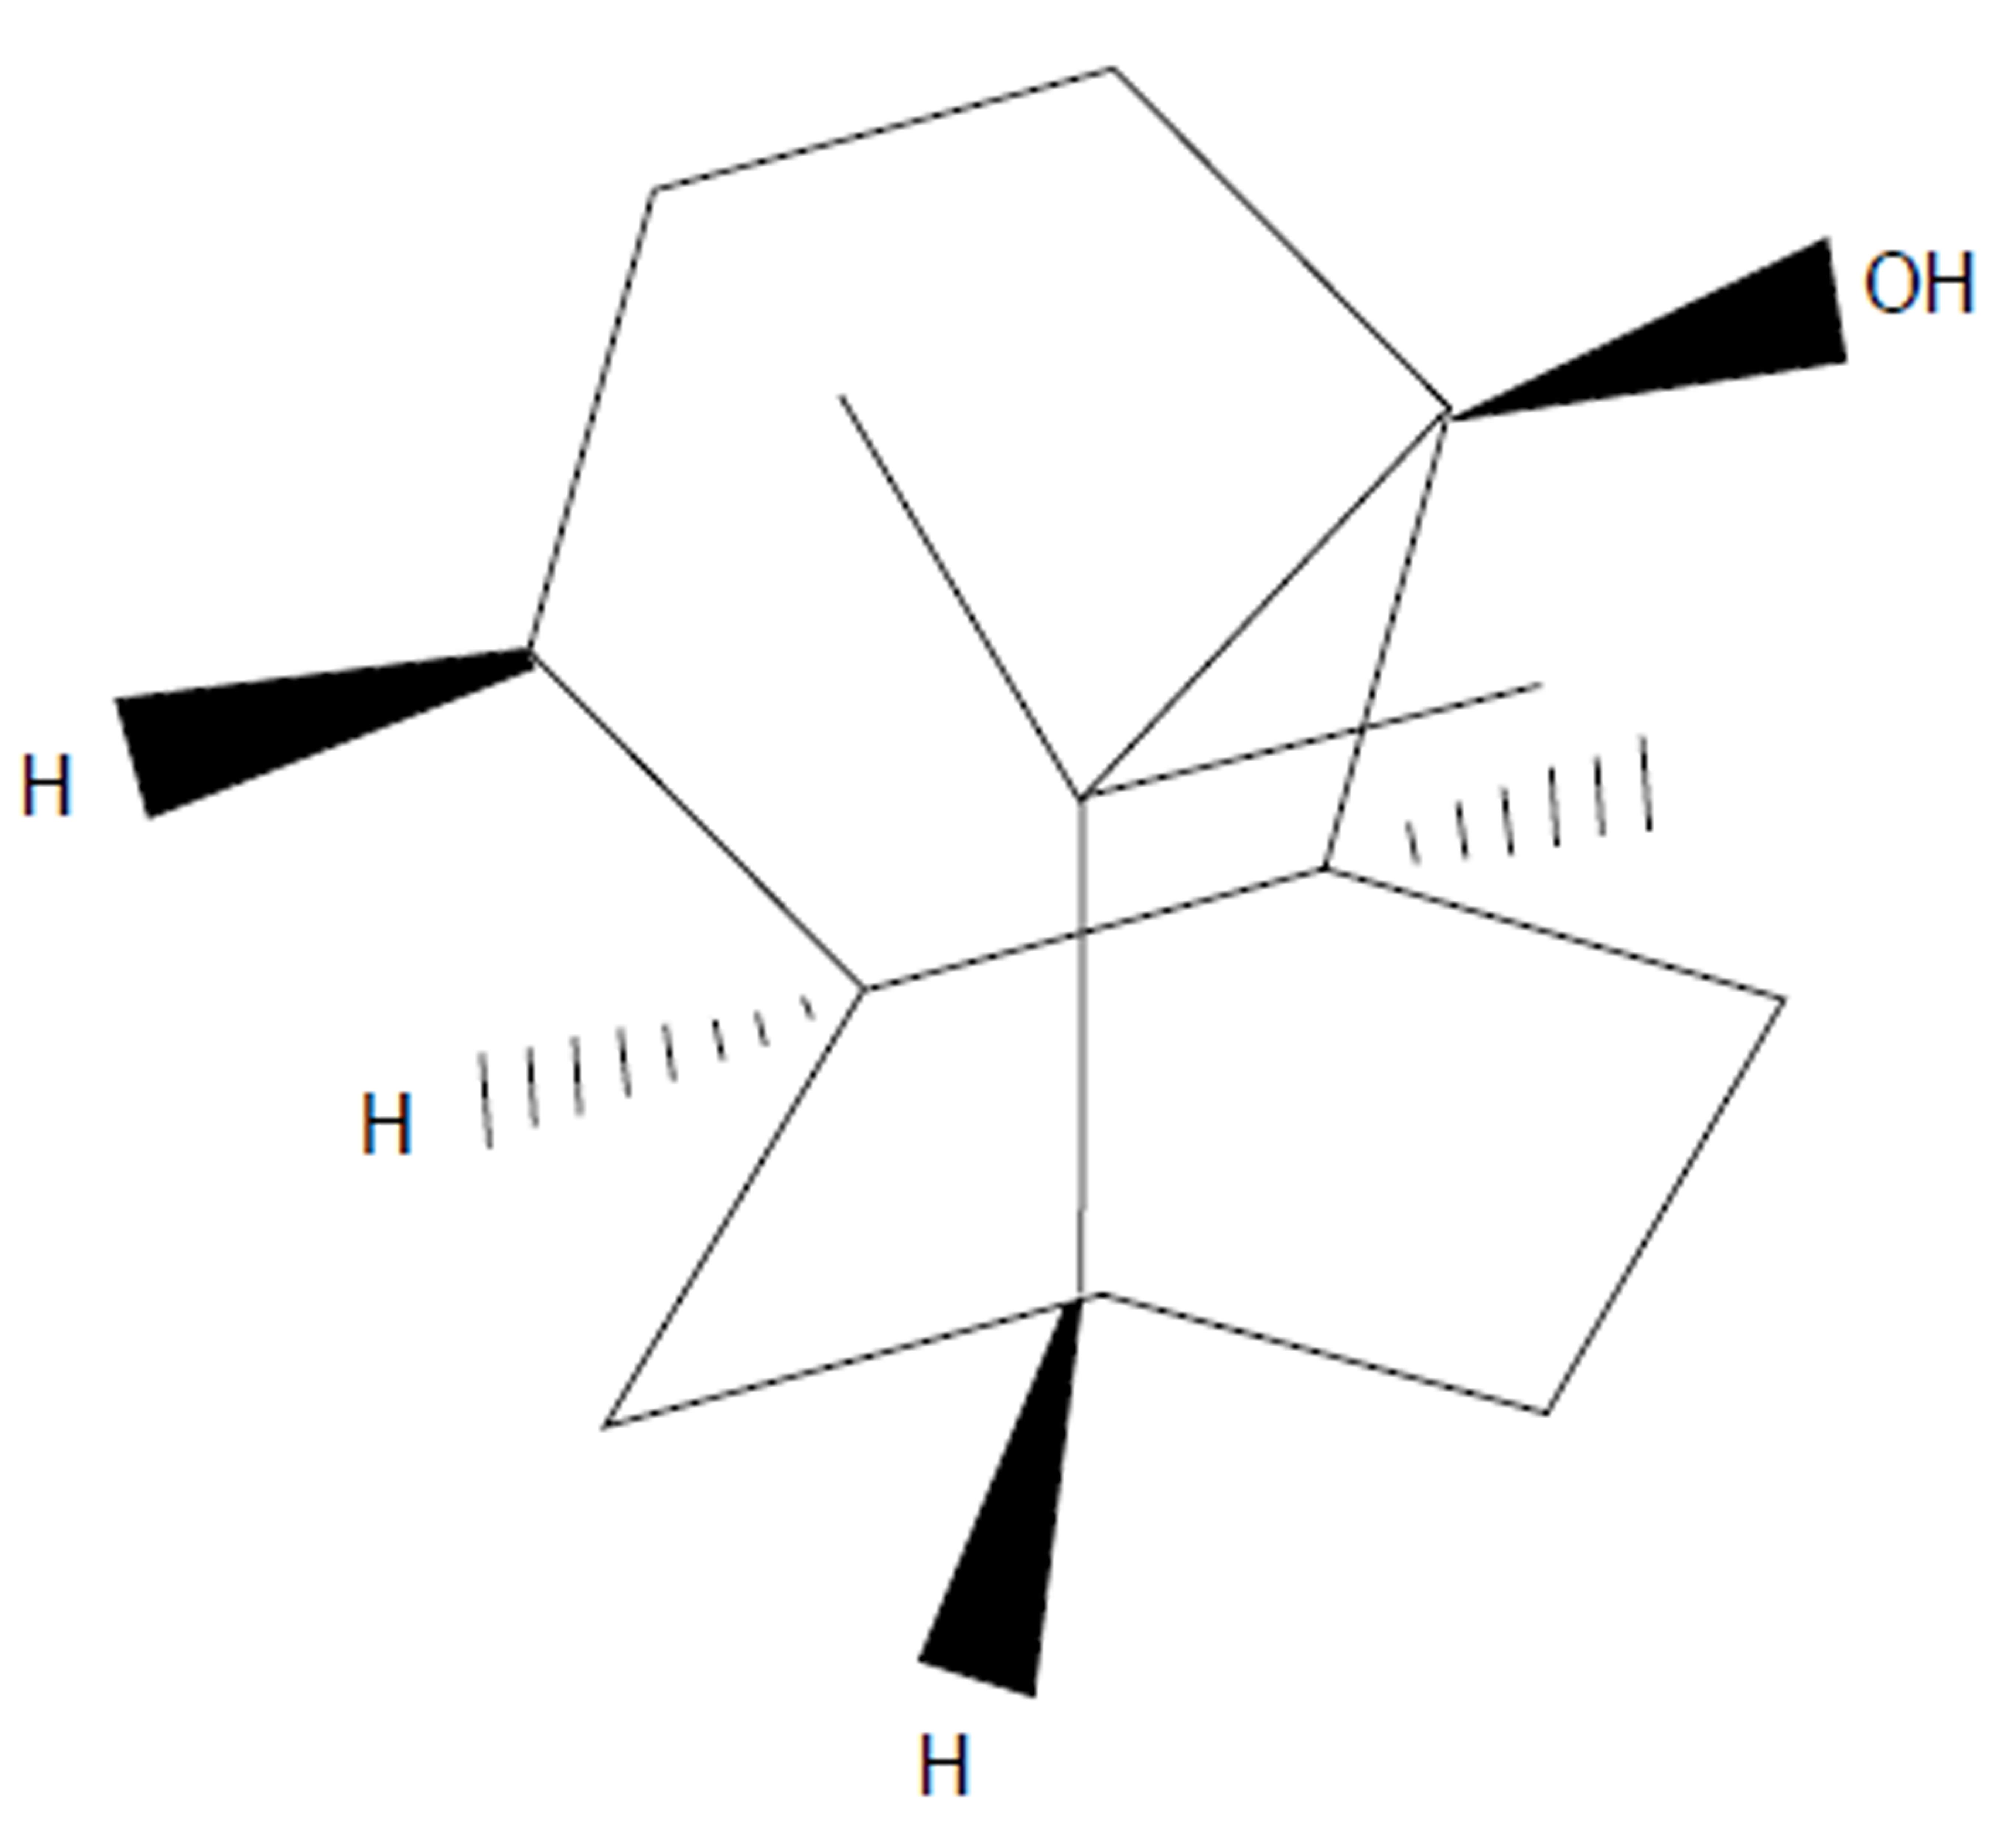
Figure 1 Structure of patchouli alcohol.
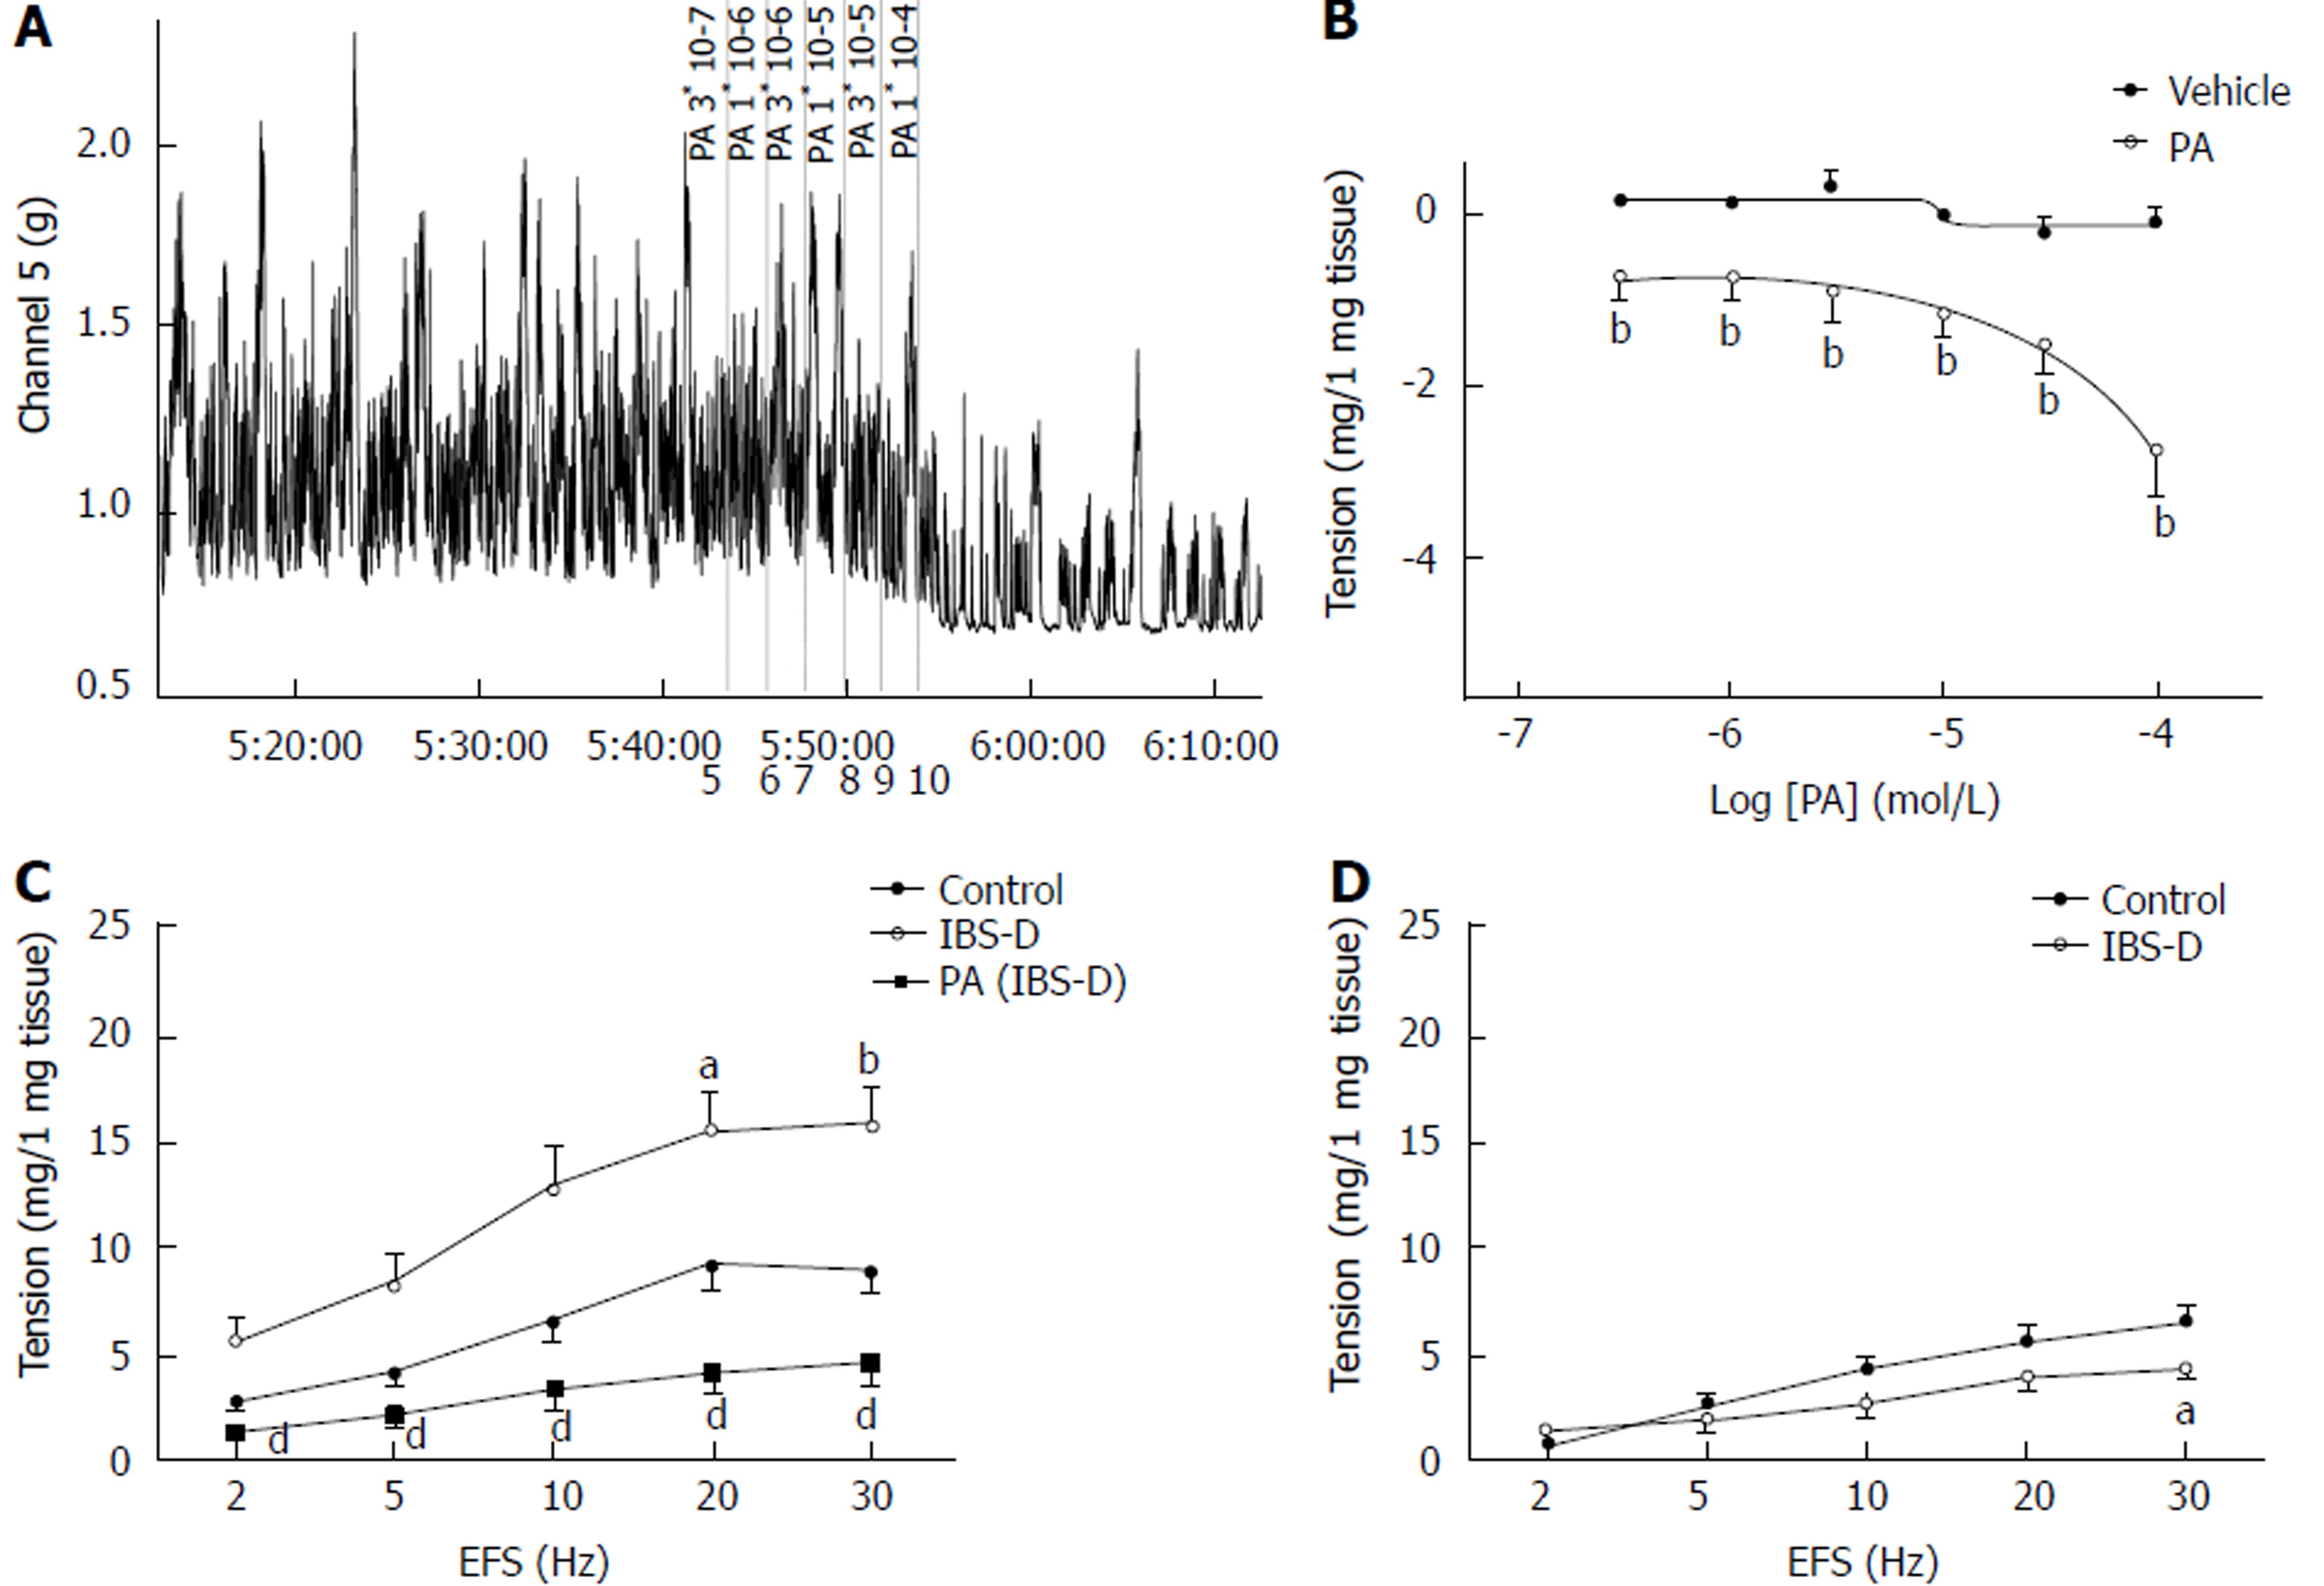
Figure 2 Inhibitory effects of patchouli alcohol on the spontaneous and EFS-induced contractions of the isolated colonic longitudinal smooth muscle.
A and B: mechanical recording and linear regression curve of the cumulative log concentration-response of PA-induced (3 × 10⁻⁷ mol/L to 1 × 10⁻⁴ mol/L) relaxation of the spontaneous contraction in the colonic longitudinal smooth muscles of the control rats (n = 8; bP < 0.01 vs vehicle DMSO group; unpaired t test). C: Relaxation effect of PA on EFS-induced contraction response of the colonic longitudinal smooth muscle in control, IBS-D, and PA-treated (100 μmol/L) IBS-D rats (control group: n = 38, IBS-D group: n = 31, PA-treated IBS-D group: n = 8. aP < 0.05 vs control, bP < 0.01 vs control, dP < 0.01 vs group IBS-D; ANOVA). D: Contraction response to EFS of the jejunal longitudinal smooth muscle (control group: n = 9, IBS-D group: n = 6. aP < 0.05 vs control; unpaired t test). Data are expressed as mean ± SE. PA: Patchouli alcohol; EFS: Electrical field stimulation, PA: Patchouli alcohol.
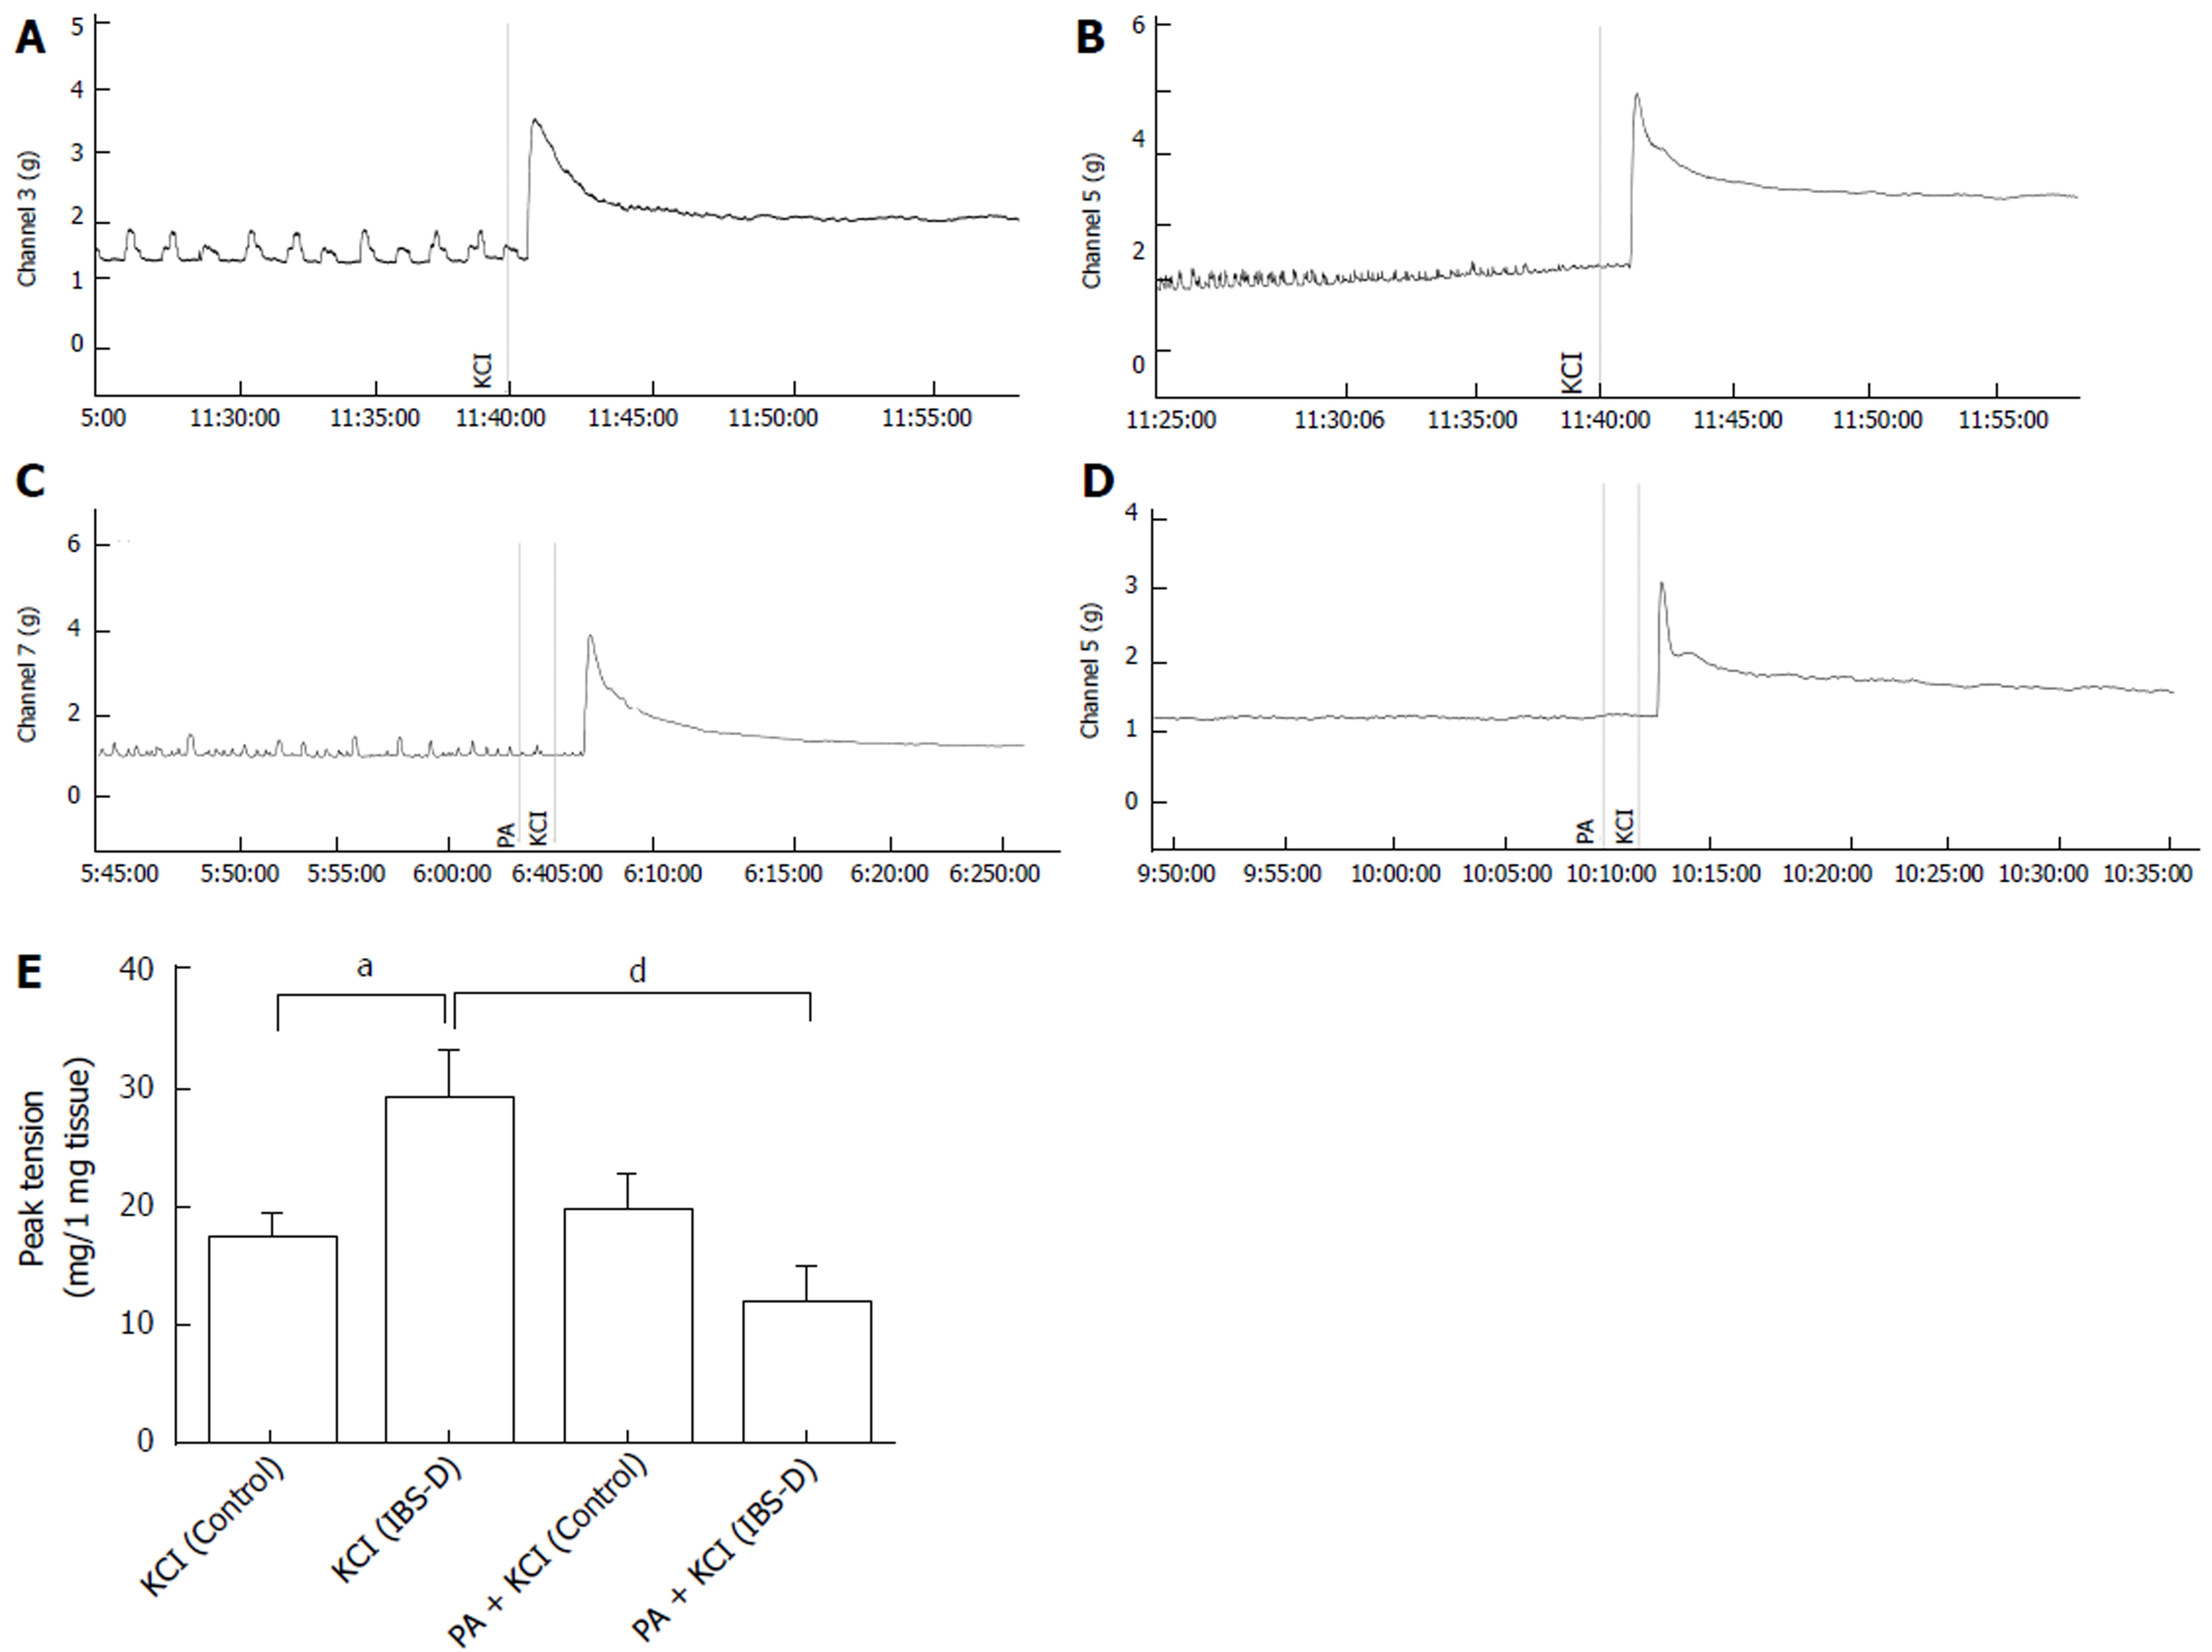
Figure 3 Inhibitory effects of patchouli alcohol on contractions induced by high extracellular KCl levels in isolated colonic longitudinal smooth muscle.
Mechanical recording (A to D) and histogram (E) of relaxation effect of PA (100 μmol/L) on colonic contractions induced by high extracellular KCl levels in IBS-D rats [KCl-treated control group A: n = 27 , KCl-treated IBS-D group B: n = 23, PA + KCl-treated control group C: n = 8, PA + KCl-treated IBS-D group D: n = 8. aP < 0.05 vs KCl-treated control group, dP < 0.01 vs KCl-treated IBS-D group; unpaired t-test]. Data are expressed as mean ± SE.
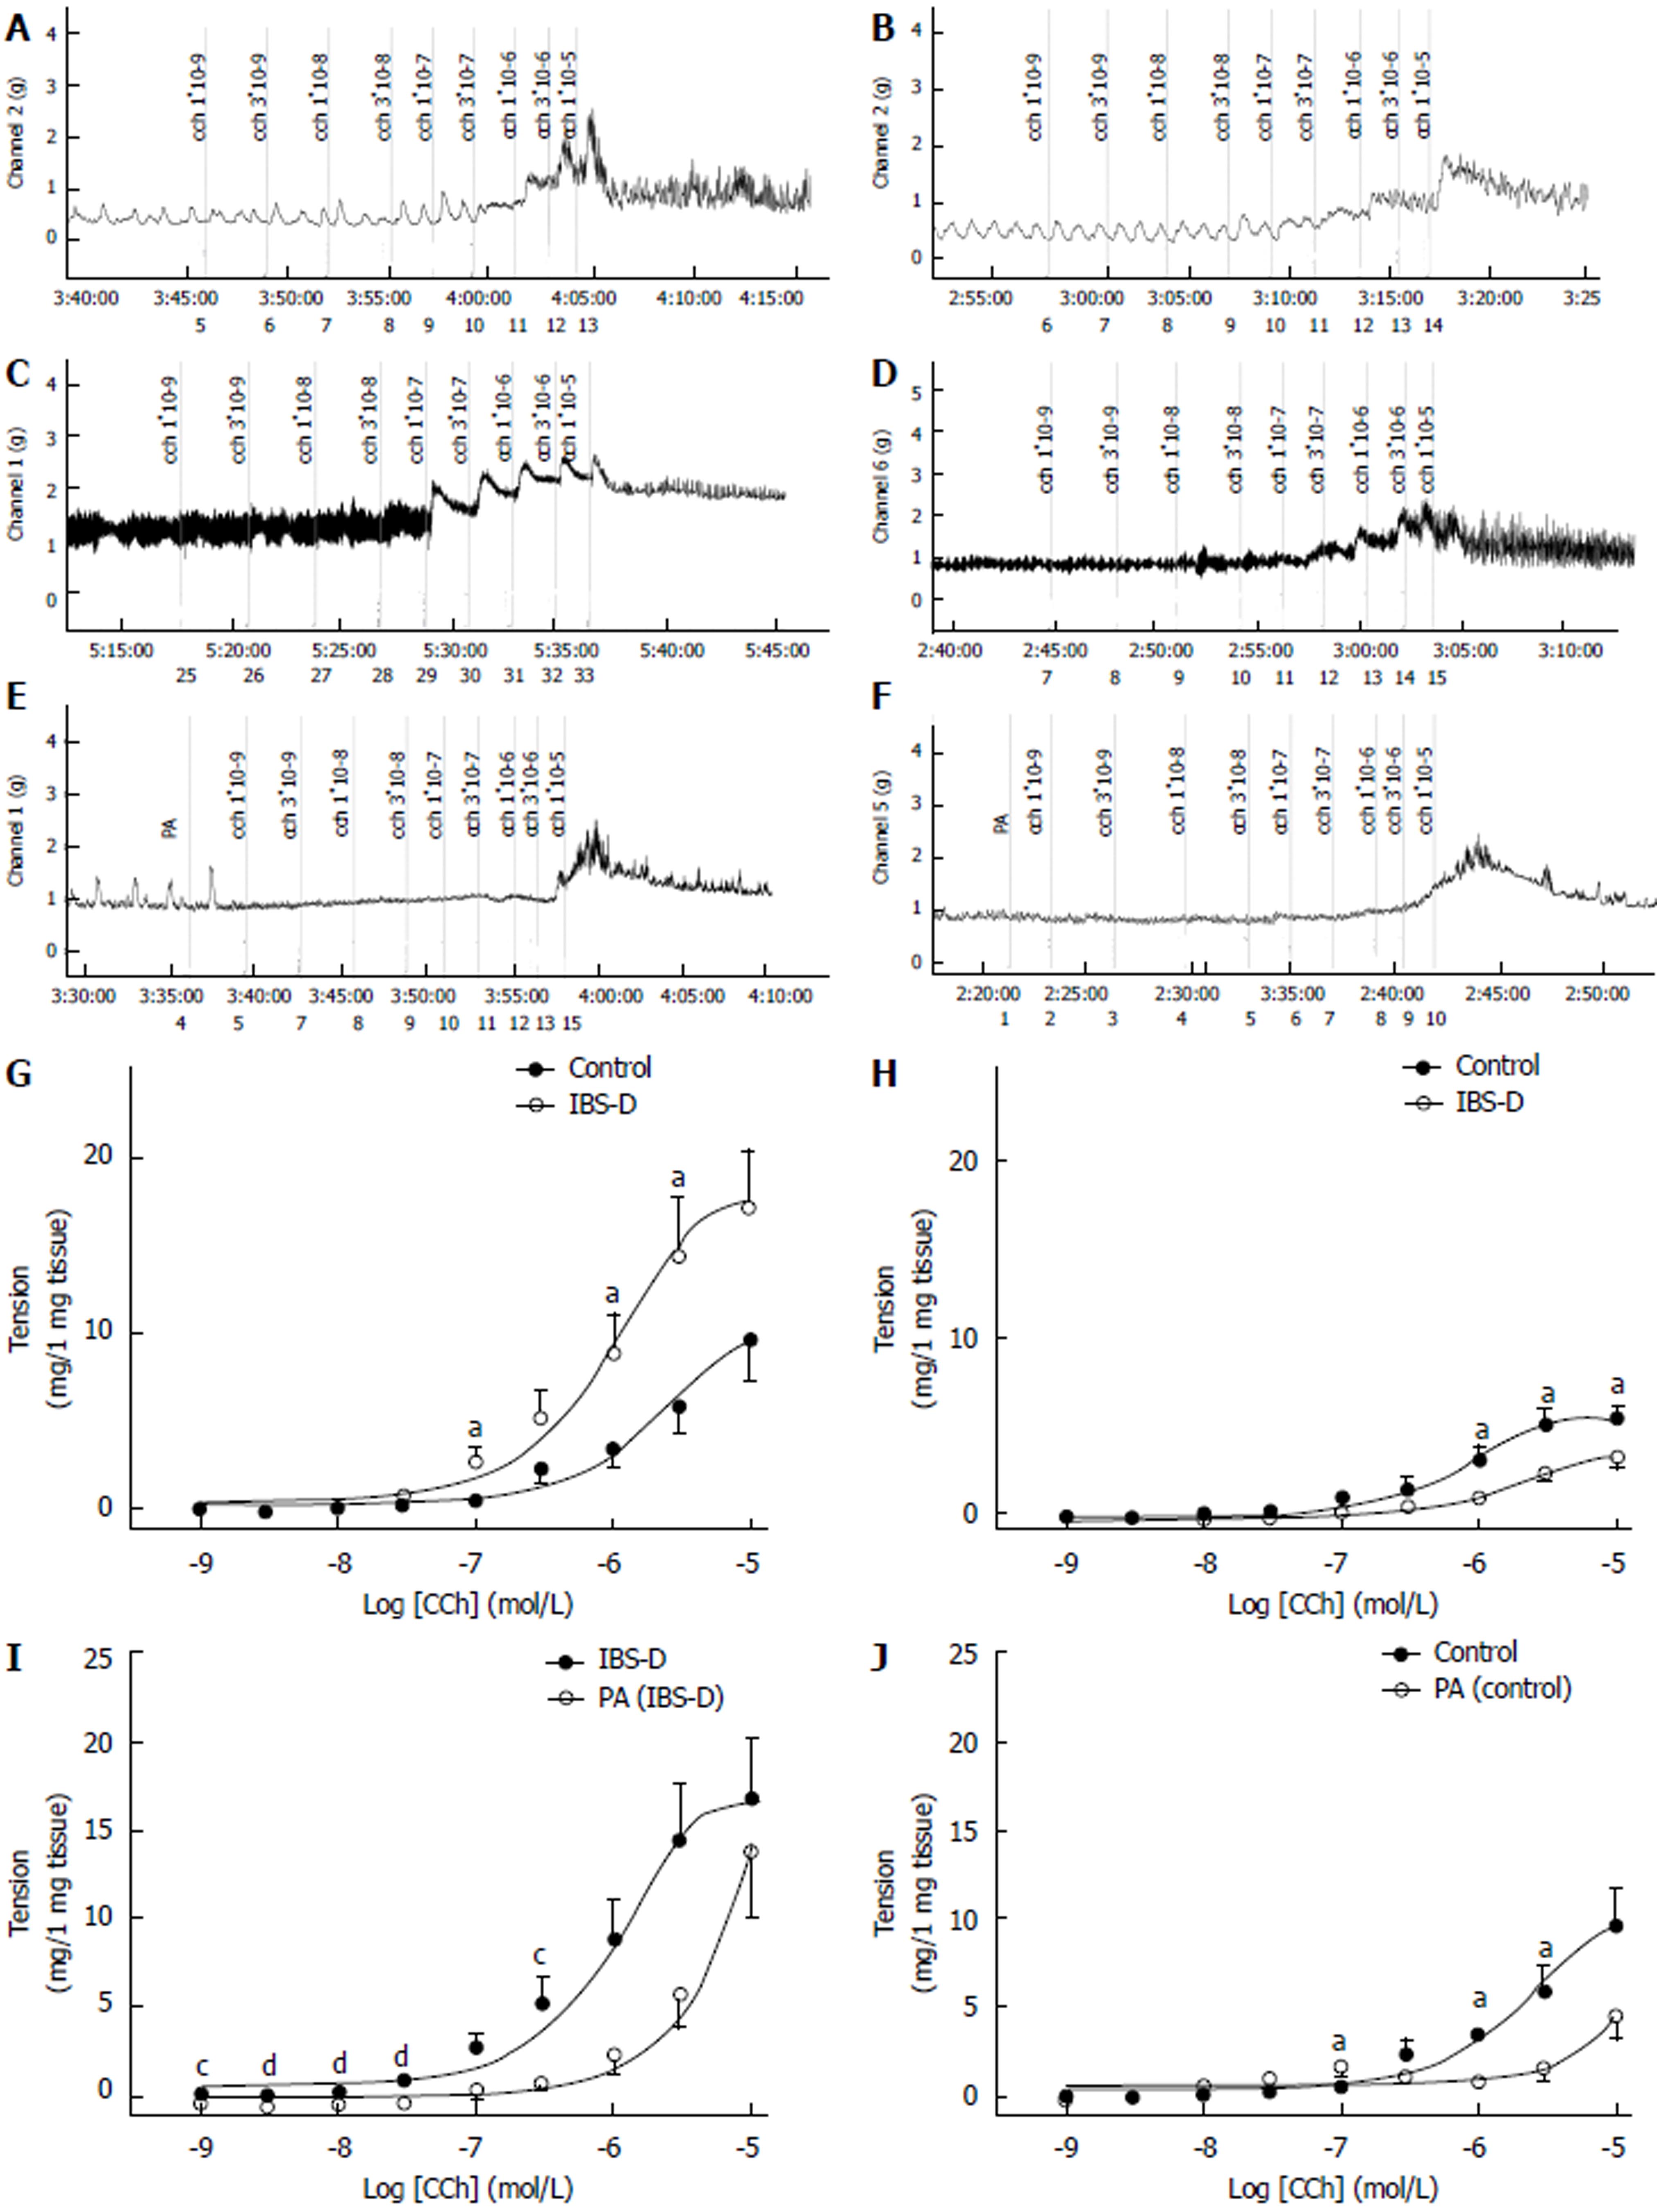
Figure 4 Inhibitory effects of PA on CCh-induced contraction in the isolated colonic longitudinal smooth muscle.
Mechanical recording (A to F) and cumulative log concentration-response curve (G) of CCh-induced contraction of the smooth muscle in IBS-D rats. Colonic tissues (control group [A]: n = 14, IBS-D group [B]: n = 16; aP < 0.05 vs control group, unpaired t test). Jejunal tissues (H) (control group [C]: n = 14, IBS-D group [D]: n = 11; aP < 0.05 vs control group, unpaired t test). Cumulative log concentration-response curve (I) of the effect of PA (100 µmol/L) on CCh-induced contraction of smooth muscle in IBS-D rats. Colonic tissues (IBS-D group: n = 16, PA-treated IBS-D group [F]: n = 8; cP < 0.05 vs group IBS-D, dP < 0.01 vs group IBS-D, unpaired t test). Cumulative log concentration-response curve (J) of the effect of PA (100 µmol/L) on CCh-induced contraction of the smooth muscle in control rats. Colonic tissues (control group: n = 14, PA-treated control group [E]: n = 8. aP < 0.05 vs control group, bP < 0.01 vs control group, unpaired t test). Data are expressed as mean ± SE. CCh: Carbachol, IBS-D: Irritable bowel syndrome; PA: Patchouli alcohol.
Figure 5 Inhibitory effects of patchouli alcohol on EFS-induced nitrergic contractile responses of isolated IBS-D rat colonic longitudinal smooth muscle.
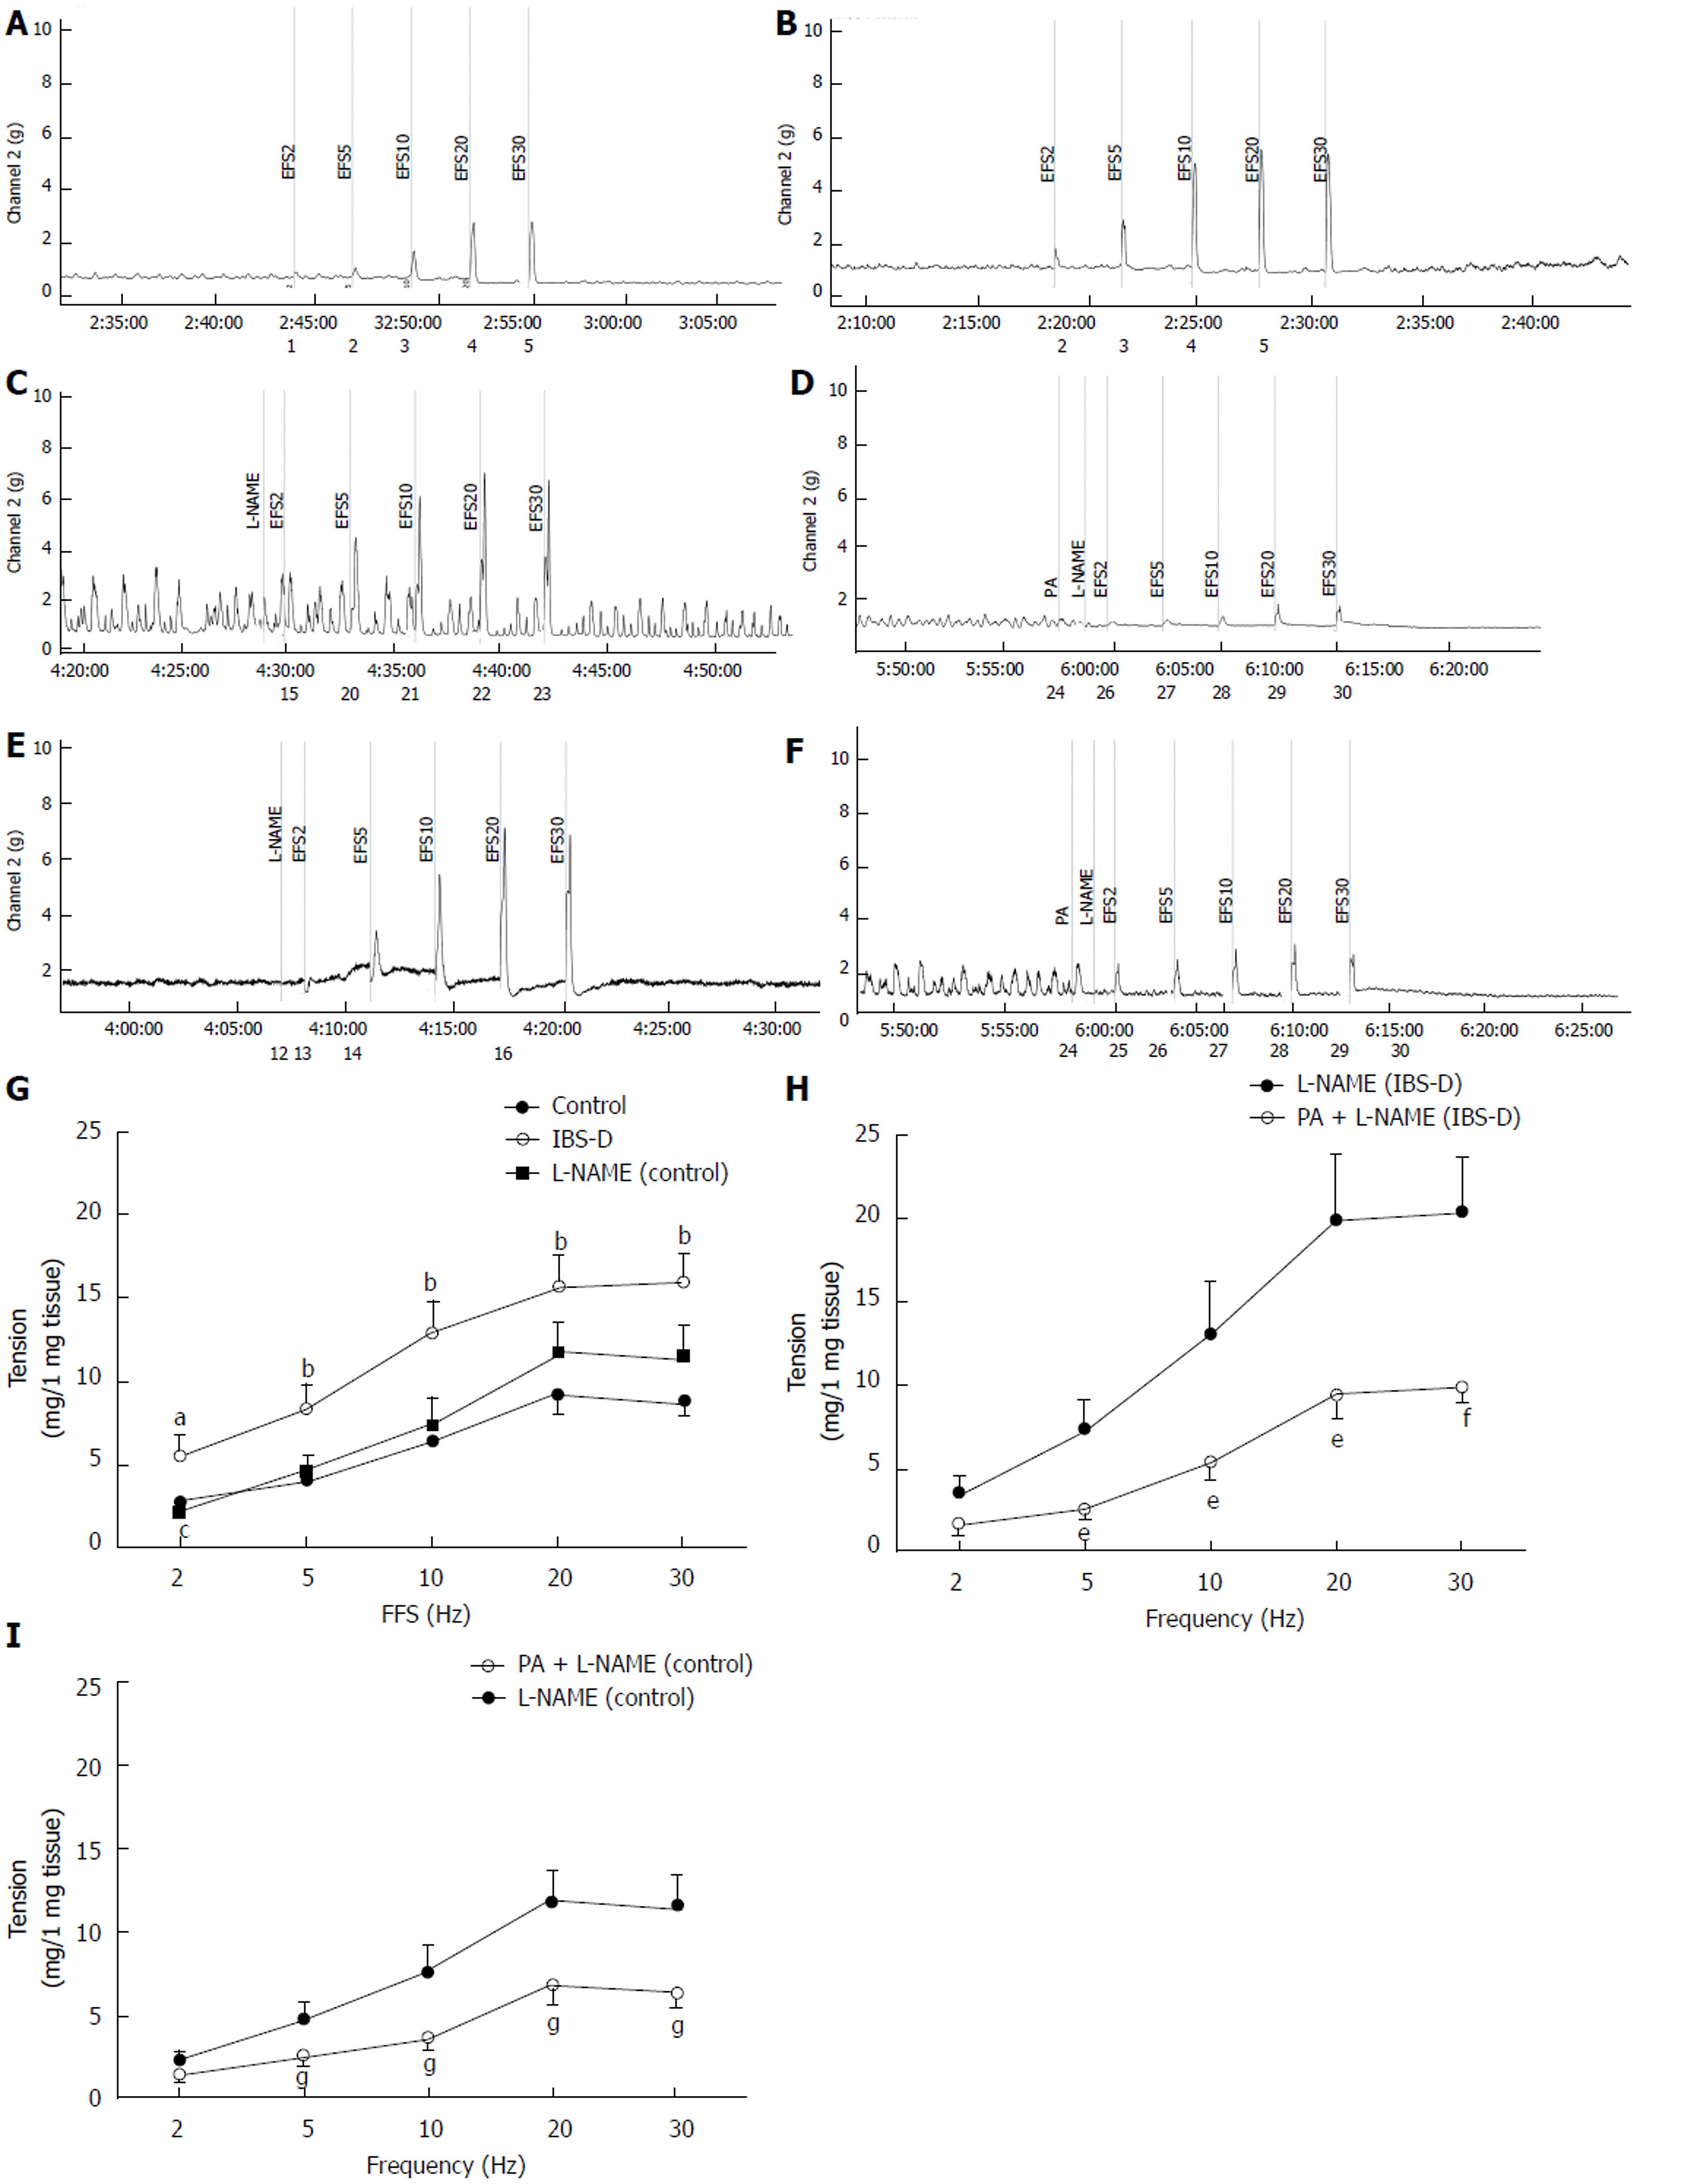
A-F: Mechanical recording and line chart of the mechanism and inhibitory effect of PA (100 μmol/L) on nerve-mediated contraction of stress-induced IBS-D rat colon; G: Effect of L-NAME on EFS-induced contraction of control rat colon [control group (A): n = 32, IBS-D group (B): n = 31, L-NAME-treated control group (C): n = 12; aP < 0.05 vs control group, bP < 0.01 vs control group, cP < 0.05 vs group IBS-D; ANOVA]; H: Effect of PA on L-NAME-induced contraction of IBS-D rat colon [L-NAME-treated IBS-D group (E): n = 14, PA + L-NAME-treated IBS-D group (F): n = 15; eP < 0.05 vs L-NAME-treated IBS-D group, fP < 0.01 vs L-NAME-treated IBS-D group, unpaired t-test]; I: Effect of PA on L-NAME-induced contraction of control rat colon [L-NAME-treated control group: n = 12, PA + L-NAME-treated control group (D): n = 16. gP < 0.05 vs L-NAME-treated control group; unpaired t-test]. Data are expressed as mean ± SE. L-NAME: Nω-nitro-L-arginine methyl ester hydrochloride, EFS: Electrical field stimulation; IBS-D: Irritable bowel syndrome; PA: Patchouli alcohol.
Figure 6 Effect of patchouli alcohol on a P2Y1 receptor antagonist in EFS-induced contraction and ATP level of isolated colonic longitudinal smooth muscle.
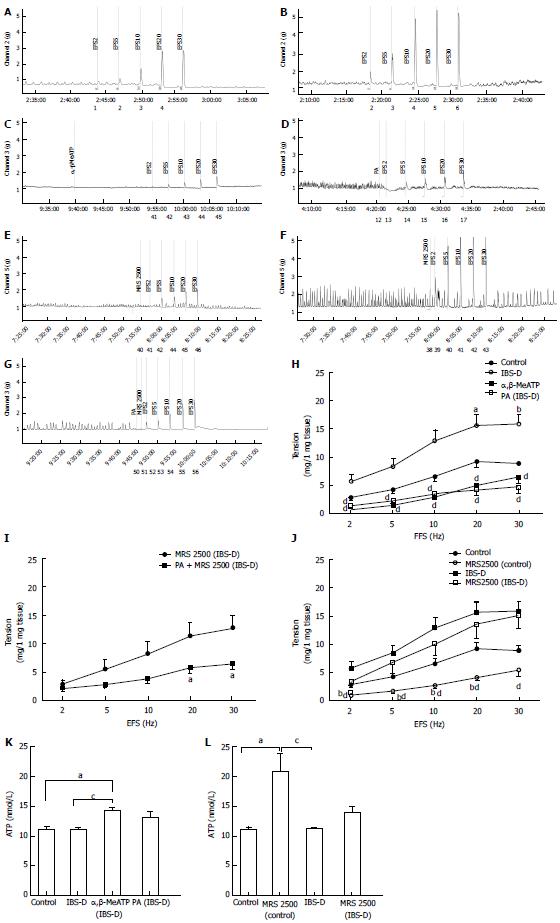
A-G: Mechanical recording, line chart, and histogram of the mechanism and effect of PA (100 μmol/L) on nerve-mediated rat colon contraction; H: Relaxation effect of α,β-MeATP and PA on EFS-induced contraction in IBS-D rats [control group (A): n = 32, IBS-D group (B): n = 31, α,β-MeATP-treated IBS-D group (C): n = 16, PA-treated IBS-D group (D): n = 8. aP < 0.05 vs control group, bP < 0.01 vs control group, dP < 0.01 vs group IBS-D; ANOVA]; I: Relaxation response of PA to MRS 2500-treated IBS-D colon [MRS 2500-treated IBS-D group (F): n = 13, PA + MRS 2500-treated IBS-D group (G), n = 15. aP < 0.05 vs MRS 2500-treated IBS-D group; unpaired t-test]; J: Effect of MRS 2500 on control and IBS-D rat colons [control group: n = 32, IBS-D group: n = 31, MRS 2500-treated control group (E): n = 13, MRS 2500-treated IBS-D group: n = 13. bP < 0.01 vs control group, dP < 0.01 vs group IBS-D; ANOVA]; K: ATP level of Kreb’s solution [control group: n = 23, IBS-D group: n = 17, α,β-MeATP-treated IBS-D group: n = 21, PA-treated IBS-D group: n = 8. aP < 0.05 vs control group, cP < 0.05 vs group IBS-D; ANOVA]; L: [Control group: n = 23, MRS 2500 treated control group: n = 12, IBS-D group: n = 17, MRS 2500-treated IBS-D group: n = 16. aP < 0.05 vs control group, cP < 0.05 vs group IBS-D; ANOVA], EFS: Electrical field stimulation; IBS-D: Irritable bowel syndrome; PA: Patchouli alcohol.
- Citation: Zhou TR, Huang JJ, Huang ZT, Cao HY, Tan B. Inhibitory effects of patchouli alcohol on stress-induced diarrhea-predominant irritable bowel syndrome. World J Gastroenterol 2018; 24(6): 693-705
- URL: https://www.wjgnet.com/1007-9327/full/v24/i6/693.htm
- DOI: https://dx.doi.org/10.3748/wjg.v24.i6.693


