Copyright
©The Author(s) 2015.
World J Gastroenterol. Dec 14, 2015; 21(46): 13055-13063
Published online Dec 14, 2015. doi: 10.3748/wjg.v21.i46.13055
Published online Dec 14, 2015. doi: 10.3748/wjg.v21.i46.13055
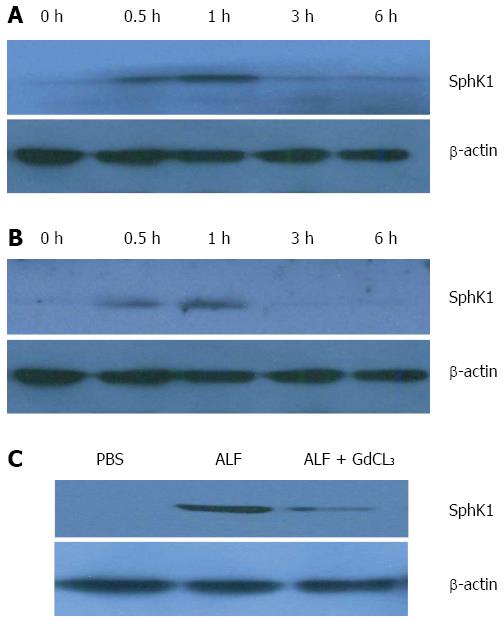
Figure 1 Sphk1 expression in liver tissue and peripheral blood mononuclear cells of mice with D-galactosamine/lipopolysaccharide-induced acute liver failure.
Acute liver failure was induced in BALB/c mice using D-galactosamine (D-GalN; 600 mg/kg) and lipopolysaccharide (LPS; 10 μg/kg). A and B: Sphk1 expression in liver tissues and PBMCs of mice with D-GalN/LPS-induced acute liver failure; C: SphK1 expression in liver tissue of mice with acute liver failure after partial deletion of KCs with GdCL3 (20 mg/kg, i.p.) for 24 h.
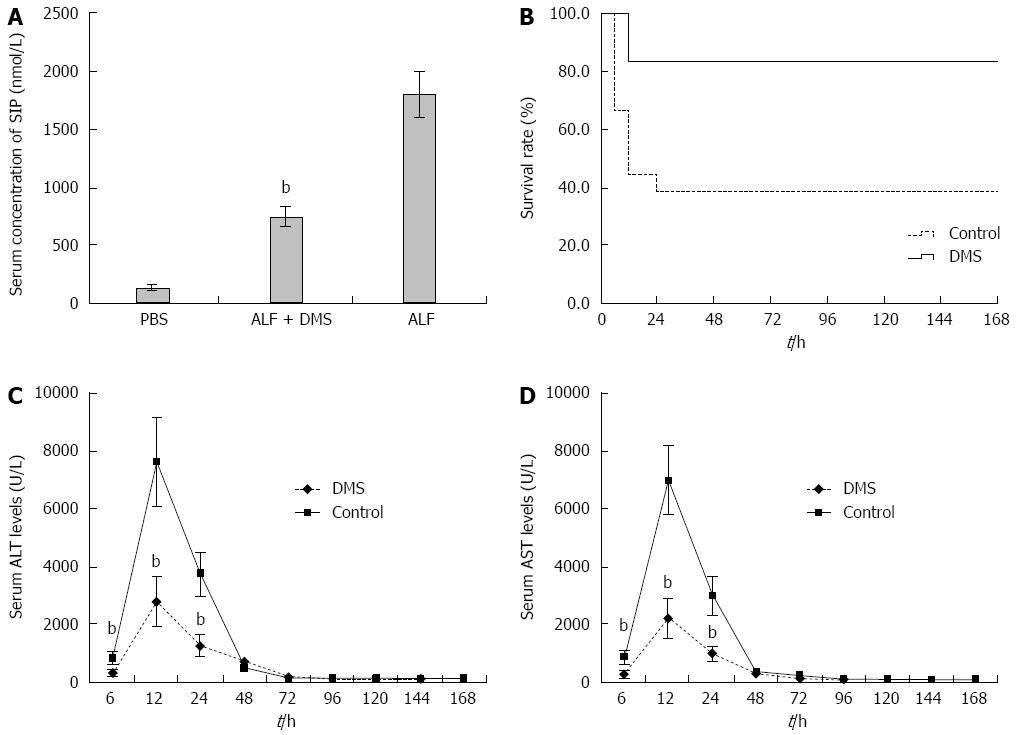
Figure 2 Inhibition of Sphk1 activity with DMS decreases serum S1P concentrations, improves survival, and attenuates liver enzyme release in a mouse model of acute liver failure.
Animals were treated with vehicle or DMS (50 μmol/L) 30 min before the induction of acute liver failure. A: Inhibition of Sphk1 activity with DMS reduced S1P, a downstream substrate of SphK1 (735.77 nmol/L ± 87.39 nmol/L vs 1789.23 nmol/L ± 201.79 nmol/L, t = 20.39, bP < 0.01); B: Kaplan-Meier analysis of the effect of DMS on survival rate of the animals. bP = 0.004, F = 8.276, log rank test; C and D: ALT and AST levels in peripheral blood samples collected at 6, 12, 24, 48, 72, 120, 144, and 168 h after treatment. DMS treatment significantly decreased serum levels of ALT at 6, 12, and 24 h (332.8 U/L ± 124.2 U/L, 2788.2 U/L ± 839.2 U/L, 1265.1 U/L ± 371.7 U/L vs 836.6 U/L ± 221.5 U/L, 7612.8 U/L ± 1579.1 U/L, 3741.4 U/L ± 771.7 U/L, t = 6.87, 10.44, and 10.01, respectively, bP < 0.01) and AST at 6, 12, and 24 h (257.1 U/L ± 134.9 U/L, 2196.3 U/L ± 676.3 U/L, 982.3 U/L ± 255.9 U/L vs 853.7 U/L ± 202.3 U/L, 6993.6 U/L ± 1209.5 U/L, 2991.1 U/L ± 678.5 U/L, t = 8.50, 12.00, and 9.60, respectively, bP < 0.01) compared with those of the control group. The mean ± SE of three independent experiments is shown (error bar indicates standard error). DMS: N,N-dimethylsphingosine; S1P: Sphingosine-1-phosphate; ALT: Alanine aminotransferase; AST: Aspartate aminotransferase.
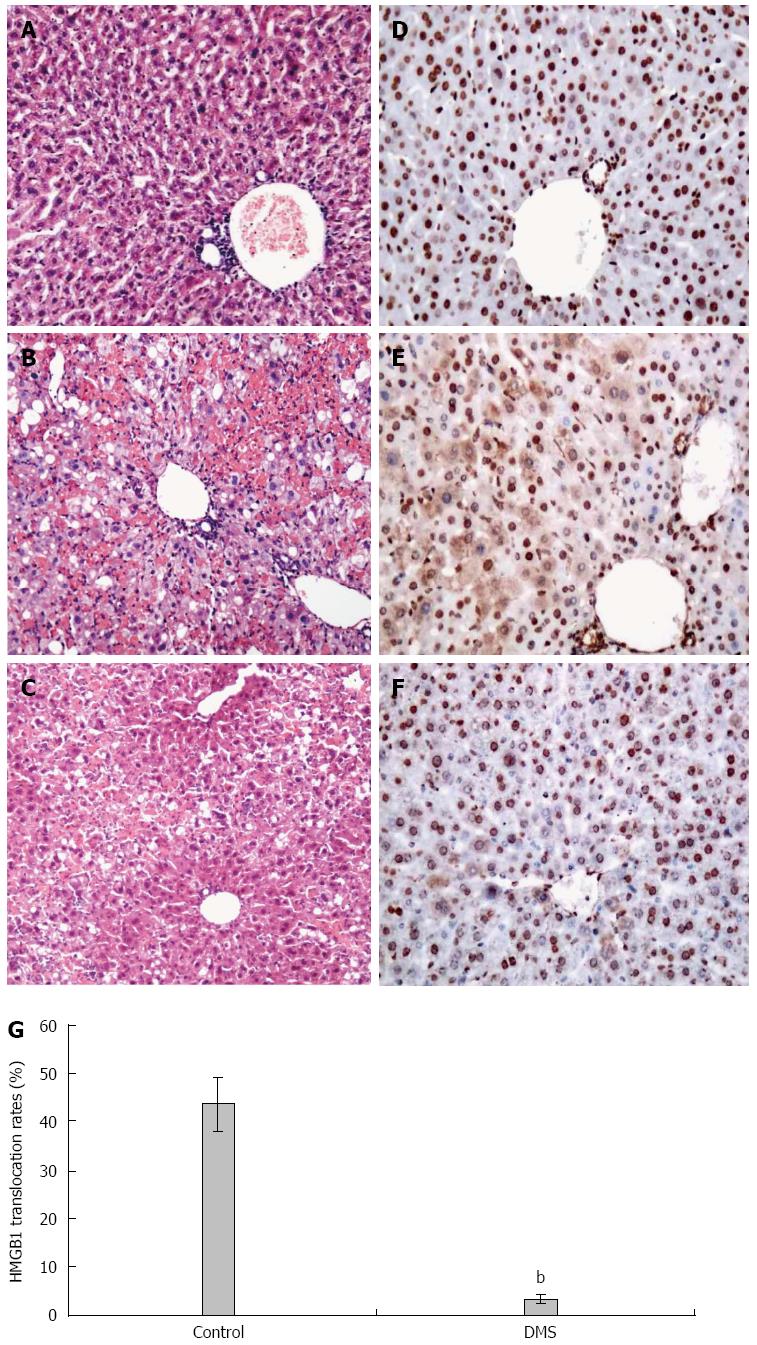
Figure 3 Immune cell infiltration and tissue damage and HMGB1 cytoplasmic translocation in hepatocytes of mice 36 h after D-galactosamine/lipopolysaccharide challenge.
Immune cell infiltration, tissue damage, and HMGB1 cytoplasmic translocation in hepatocytes at 6 and 36 h after the onset of acute liver failure were detected by hematoxylin and eosin staining (A-C) and immunohistochemistry (D-F); magnification × 10 or × 20. A and B: Normal mice; C and D: Acute liver failure mice; E and F: DMS-treated mice; G: Percentage of hepatocytes with HMGB1 cytoplasmic translocation. χ2 = 12.81, bP < 0.01, (3.57% ± 0.83%) vs controls (43.72% ± 5.51%). The mean ± SE of three independent experiments is shown (error bar indicates standard error).
Figure 4 Inhibition of SPHK1 activation downregulates serum inflammatory cytokine and HMGB1 levels in mice with acute liver failure.
A: DMS reduced serum levels of TNF-α, IL-1β, and IL-6 significantly (57.07 pg/mL ± 22.83 pg/mL vs 198.55 pg/mL ± 48.17 pg/mL; 15.66 pg/mL ± 13.13 pg/mL vs 37.44 pg/mL ± 18.68 pg/mL; 19.13 pg/mL ± 5.32 pg/mL vs 40.13 pg/mL ± 9.37 pg/mL, t = 27.6, 10.12 and 4.33, respectively, bP < 0.01), but did not increase the level of anti-inflammatory cytokine IL-10 at 12 h; B DMS reduced HMGB1 levels at 6, 12, and 24 h in mice (23.49 ng/mL ± 3.89 ng/mL vs 58.6 ng/mL ± 3.65 ng/mL; 61.62 ng/mL ± 13.07 ng/mL vs 27.32 ng/mL ± 5.97 ng/mL; 49.91 ng/mL ± 16.6 ng/mL vs 32.42 ng/mL ± 4.23 ng/mL, t = 11.27, 4.07, and 8.42, respectively, bP < 0.01). The mean ± SE of three independent experiments is shown (error bar indicates standard error).
- Citation: Lei YC, Yang LL, Li W, Luo P, Zheng PF. Inhibition of sphingosine kinase 1 ameliorates acute liver failure by reducing high-mobility group box 1 cytoplasmic translocation in liver cells. World J Gastroenterol 2015; 21(46): 13055-13063
- URL: https://www.wjgnet.com/1007-9327/full/v21/i46/13055.htm
- DOI: https://dx.doi.org/10.3748/wjg.v21.i46.13055


