Copyright
©The Author(s) 2015.
World J Gastroenterol. Dec 7, 2015; 21(45): 12822-12834
Published online Dec 7, 2015. doi: 10.3748/wjg.v21.i45.12822
Published online Dec 7, 2015. doi: 10.3748/wjg.v21.i45.12822
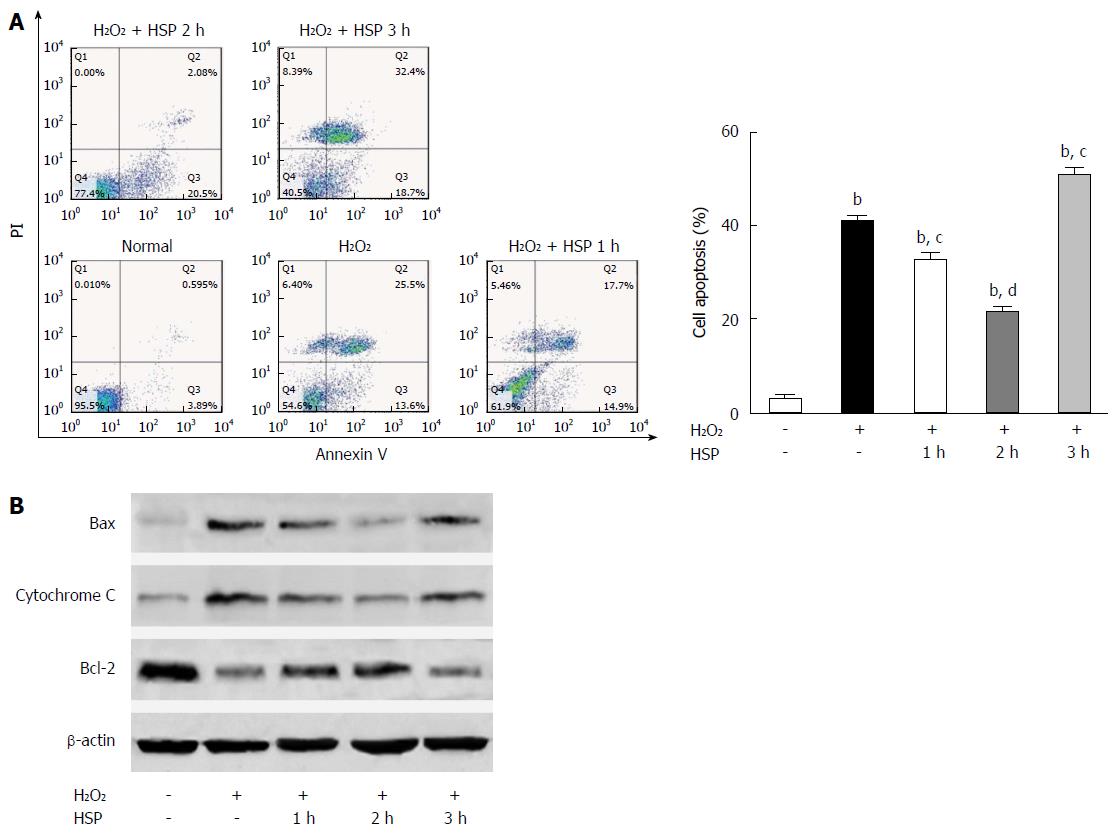
Figure 1 Heat shock pretreatment protected mesenchymal stem cells from apoptosis induced by H2O2.
Apoptosis was analyzed using flow cytometry (A) and Western blot (B). The apoptotic rate and pro-apoptotic proteins Bax and cytochrome C were reduced, while the anti-apoptotic protein Bcl-2 was increased in the HSP1h and HSP2h group, particularly in the HSP2h group (P < 0.01). However, the apoptotic rate, and both Bax and cytochrome C were increased, while Bcl-2 was reduced in the HSP3h group. The data represent the results of three separate experiments. bP < 0.01 compared with the normal control group; cP < 0.05, dP < 0.01 compared with the H2O2 group. HSP: Heat shock pretreatment.
Figure 2 Autophagy was determined by acidic vesicular organelle-positive mesenchymal stem cells (labeled in the circle) using a fluorescent dye (AO) and flow cytometry.
A: Different periods of heat shock pretreatment (HSP) ranging from 1 to 3 h led to a time-dependent increase in autophagy in mesenchymal stem cells (MSCs) exposed to H2O2, which peaked in the HSP3h group; B: 3-MA attenuated, whereas rapamycin failed to further increase HSP-induced autophagy; C: SB203580 significantly suppressed HSP-induced autophagy in MSCs exposed to H2O2; D: Western blot showed a significant time-dependent increase in expression of the autophagic marker LC3B-II and beclin 1 in MSCs. The data represent the results of three separate experiments. aP < 0.05, bP < 0.01 compared with the normal control group; cP < 0.05, dP < 0.01 compared with the HSP2h control group.
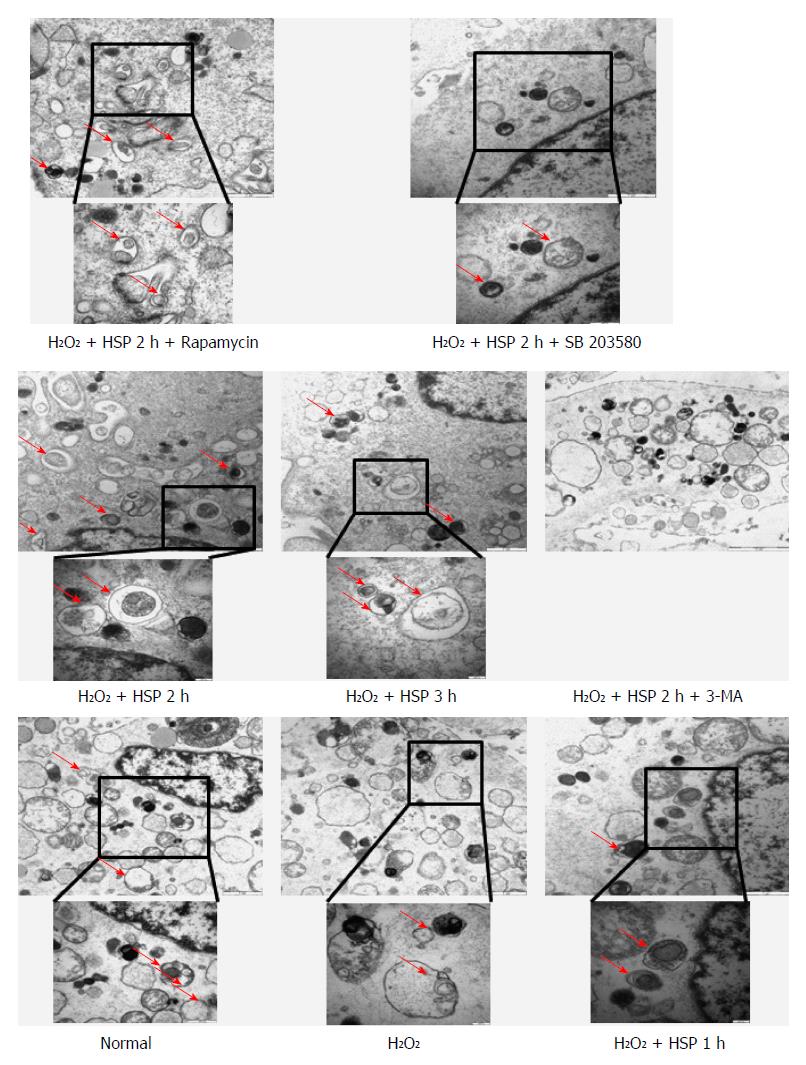
Figure 3 Representative electron micrographs demonstrating autophagic vacuole formation in each group.
The arrows indicate the double-membrane vacuoles digesting organelles or cytosolic contents.
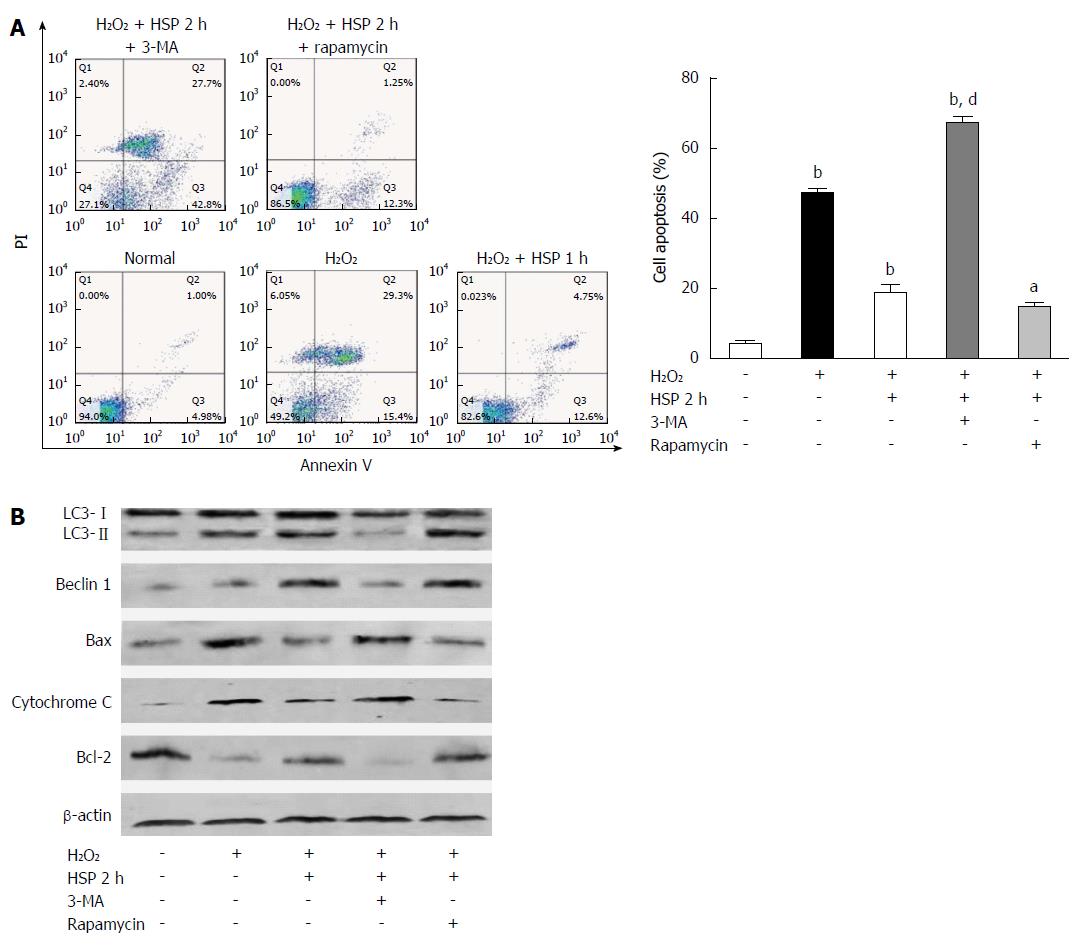
Figure 4 Inhibition of autophagy abrogated the effects of heat shock pretreatment on apoptosis reduction in mesenchymal stem cells exposed to H2O2 treatment.
A: Flow cytometry indicated that 3-MA significantly increased the apoptotic rate in heat shock pretreatment (HSP)-treated mesenchymal stem cells; B: Western blot showed that 3-MA significantly increased Bax and cytochrome C expression, and decreased Bcl-2, LC3-II and beclin 1 expression. The data represent the results of three separate experiments. aP < 0.05, bP < 0.01 compared with the control group; dP < 0.01 compared with the HSP2h group.
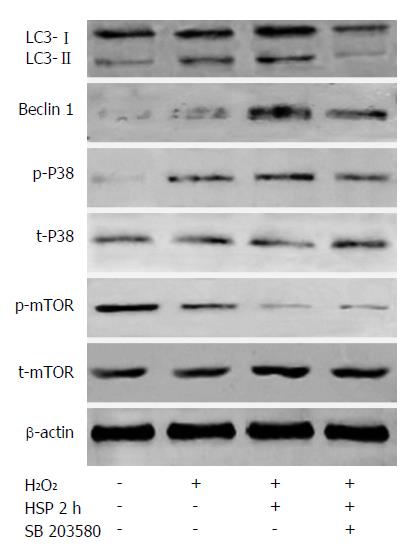
Figure 5 The p38MAPK/mTOR pathway was involved in autophagy activation by heat shock pretreatment in mesenchymal stem cells.
Western blot showed that p-p38MAPK was upregulated and p-mTOR was downregulated by heat shock pretreatment (HSP) in mesenchymal stem cells. The p38MAPK inhibitor, SB203580, counteracted the effects of HSP on LC3-II, beclin 1 and p-p38MAPK expression. The data represent the results of three separate experiments.
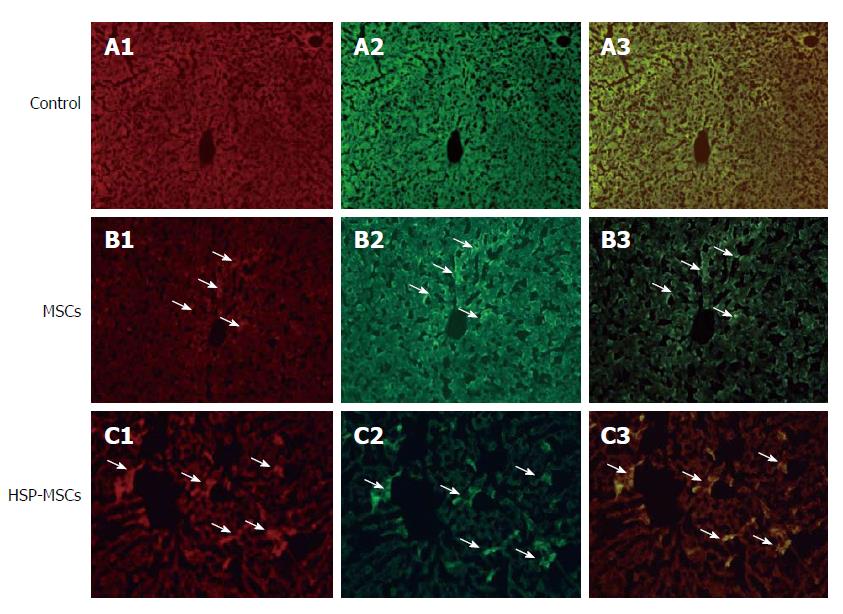
Figure 6 Heat shock pretreatment increases the homing and survival rate of transplanted mesenchymal stem cells in I/R livers in vivo.
CM-Dil-labeled positive cells (red color, B1, C1), PCNA-conjugated with FITC (green color, B2, C2) and their co-localization (yellow color, B3, C3) were detected by immunofluorescence microscopy, respectively (magnification × 100). The total number of double-positive cells labeled by CM-Dil and PCNA in the heat shock pretreatment-mesenchymal stem cell (MSC)-treated group was higher than that in the MSC-treated group. The arrows indicate positive stained cells by CM-Dil, PCNA or their co-localization, respectively. The data represent the results of three separate experiments.
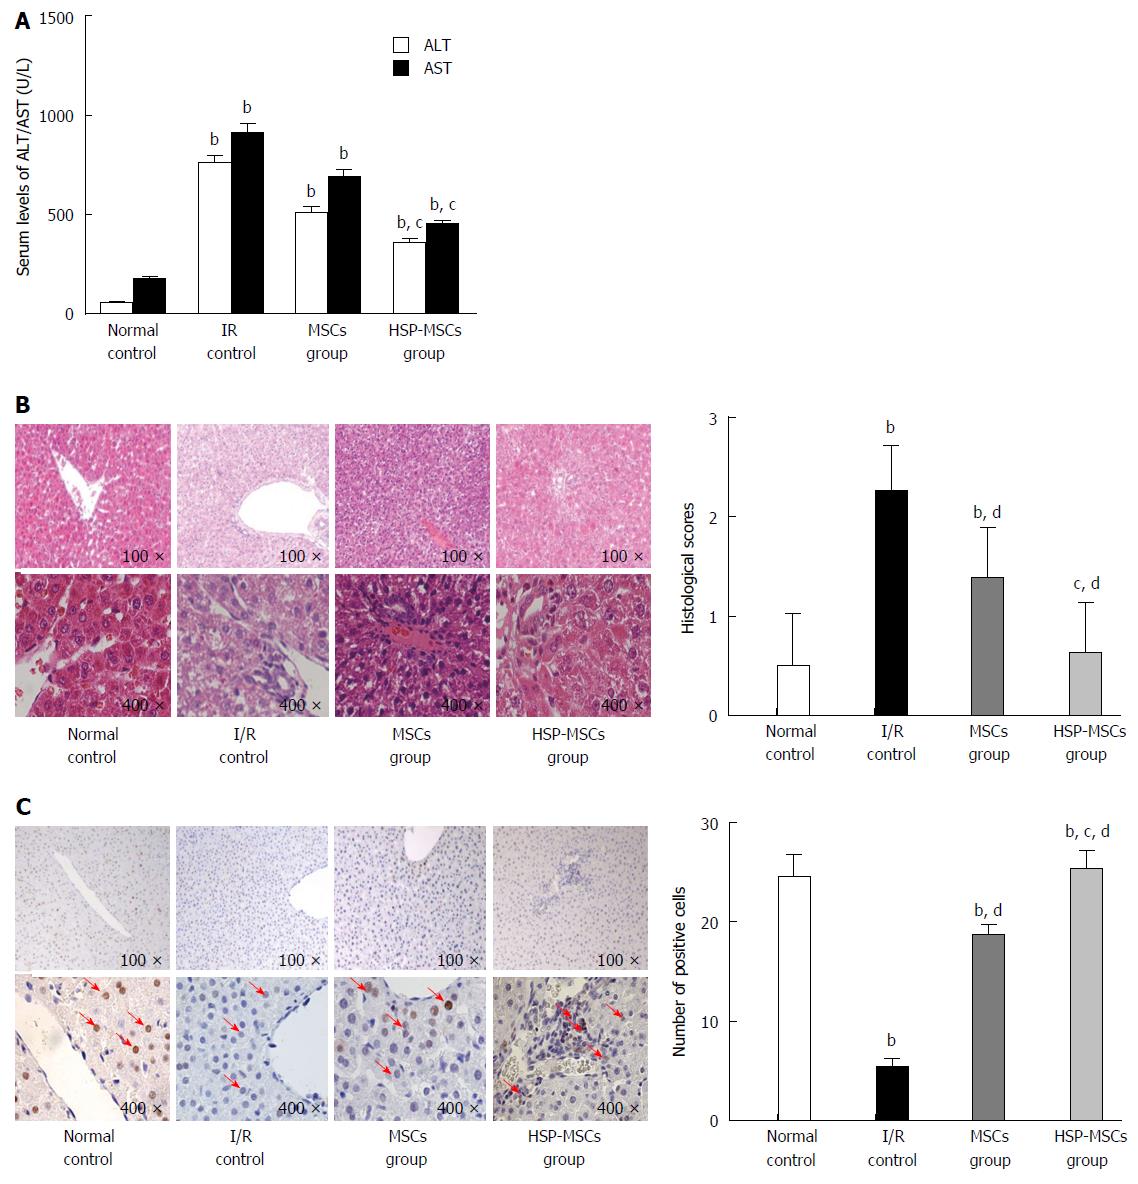
Figure 7 Heat shock pretreatment improves the therapeutic potential of mesenchymal stem cells in the treatment of hepatic ischemia-reperfusion injury in vivo.
A: Serum aminotransferase levels were measured using an automatic analyzer following treatment; B: Histopathological analyses of livers from the normal control, I/R-control, mesenchymal stem cells (MSCs) and HSP-MSC groups. Liver tissue sections were stained with HE and scored according to the Suzuki Scoring System. Original magnification, × 100 and × 400, respectively, for each slide; C: Expression of PCNA by immunohistochemistry in liver tissues (magnification × 100 and × 400). The arrows indicate positive stained cells by PCNA. The data represent the results of three separate experiments. bP < 0.01 compared with the normal control group; dP < 0.01 compared with the I/R control group; cP < 0.05 compared with the MSC group.
-
Citation: Qiao PF, Yao L, Zhang XC, Li GD, Wu DQ. Heat shock pretreatment improves stem cell repair following ischemia-reperfusion injury
via autophagy. World J Gastroenterol 2015; 21(45): 12822-12834 - URL: https://www.wjgnet.com/1007-9327/full/v21/i45/12822.htm
- DOI: https://dx.doi.org/10.3748/wjg.v21.i45.12822


