Copyright
©The Author(s) 2015.
World J Hepatol. Mar 27, 2015; 7(3): 468-487
Published online Mar 27, 2015. doi: 10.4254/wjh.v7.i3.468
Published online Mar 27, 2015. doi: 10.4254/wjh.v7.i3.468
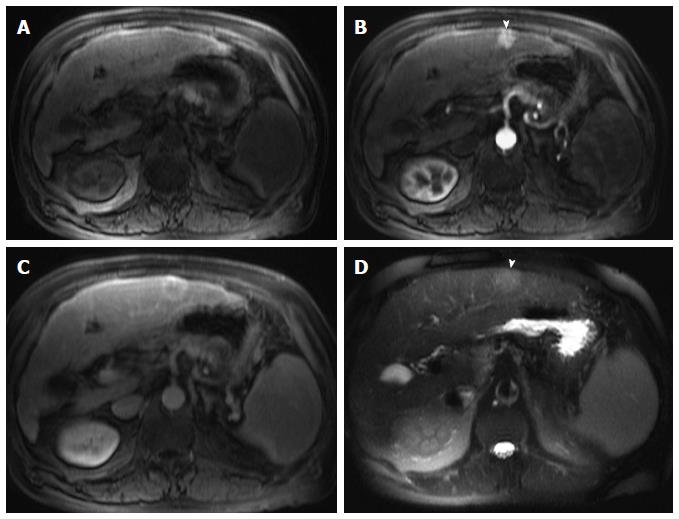
Figure 1 Incidentally discovered solitary left hepatic lobe nodule on screening ultrasound, referred as suspicious nodule for HCC, for MRI evaluation.
A: Pre- and post-contrast fat-suppressed 3D-GRE T1-weighted images during the (B) late hepatic arterial and (C) delayed phases; D: Post-processed subtracted arterial image. The known left hepatic lobe nodule demonstrate increased intrinsic T1 signal (arrowhead, A), without appreciable increased arterial enhancement (B), confirmed on subtraction images (D), in keeping with a macro-regenerative nodule. However, the MRI reveals multiple small foci at hepatic segment #5 that show increased arterial enhancement (arrows, B) and delayed washout (D) in keeping with multiple small HCCs. HCC: Hepatocellular carcinoma; MRI: Magnetic resonance imaging; GRE: Gradient recalled echo.
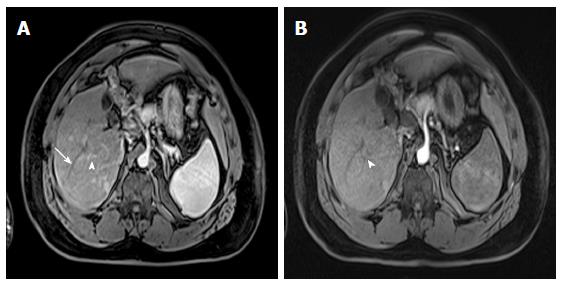
Figure 2 Value of proper timing for detecting hypervascular hepatic lesions.
A-B: Post-contrast fat-suppressed 3D-GRE T1-weighted images acquired 4 mo apart. A: Initial scanning shows contrast in the portal vain branches (arrowhead, A), without opacification of the hepatic veins (arrow, A), suggesting late hepatic arterial phase timing; the optimal time for detecting hypervascular pathologies, with demonstration of multiple lesions; B: A subsequent scan acquired 4 mo later shows contrast in the hepatic artery without opacification of the portal vein branches (arrowhead, B), suggesting an early arterial timing, without evidence of hypervascular lesions. A subsequent scan was acquired (not shown); which confirmed the persistence of these hypervascular lesions. GRE: Gradient recalled echo.
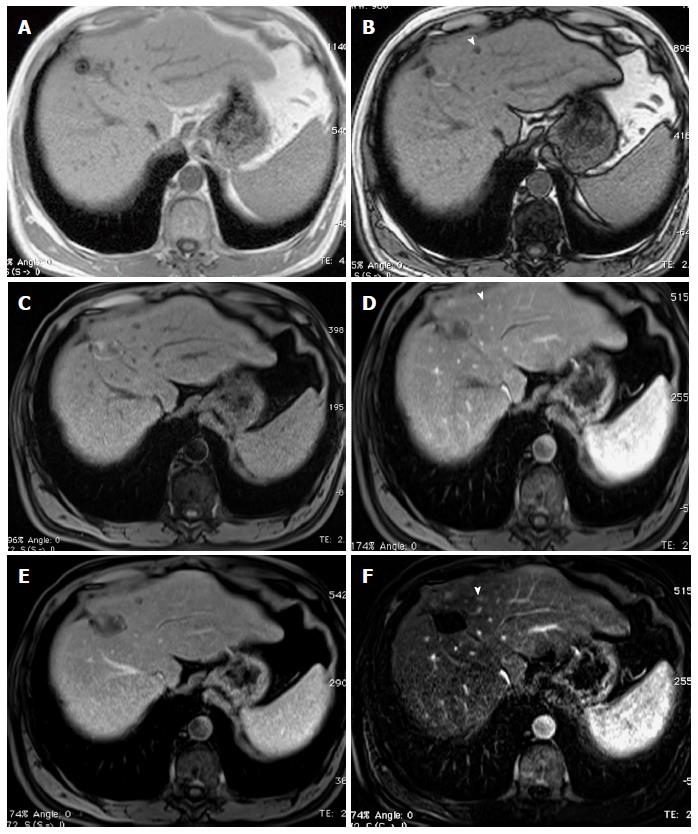
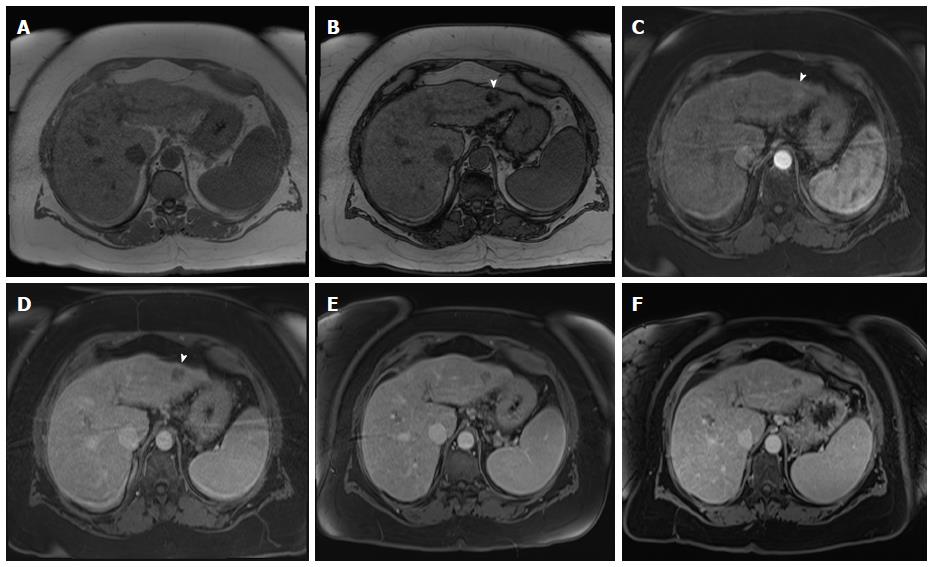
Figure 3 Small fat-containing hepatocellular carcinoma; the value of subtraction images.
A: In-phase; B: Opposed-phase GRE T1 weighted images; C-E: Pre- and post-contrast fat-suppressed 3D-GRE T1-weighted images during the (D) late hepatic arterial and (E) delayed phases; F: Post-processed subtractions arterial phase image. There is a small left hepatic nodule, which demonstrates drop of signal intensity on opposed-phase (arrowhead, B) and pre-contrast images (C) compared to the in-phase images (A), suggesting the presence of fat, with possible minimal increased arterial enhancement (arrowhead, D), confirmed on subtraction images (arrowhead, F), and washout on delayed images (E) in keeping with a small fat-containing hepatocellular carcinoma. GRE: Gradient recalled echo.
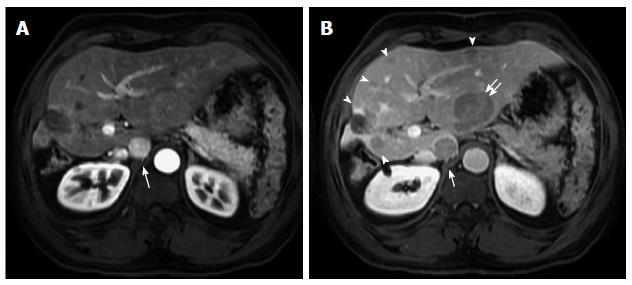
Figure 4 Hypervascular and non-hypervascular hepatocellular carcinomas.
Post contrast fat-suppressed 3D-GRE T1-weighted images during the (A) late hepatic arterial and (B) delayed phases. There is a focal hepatic lesion medial to the inferior vena cava, which demonstrates intensely increased arterial enhancement (arrow, A) and washout on delayed images (arrow, B) in keeping with a hypervascular HCC. Additionally, there are multiple foci of delayed washout throughout the liver (arrowheads, B), the largest of which is seen at the left hepatic lobe (double-arrow, B), with variable degrees of arterial enhancement, in keeping with multiple hypo- and iso- vascular HCCs. Of note are the hypertrophic changes of the left hepatic lobe as well as atrophic and post-interventional changes of the right hepatic lobe. HCC: Hepatocellular carcinoma; GRE: Gradient recalled echo.
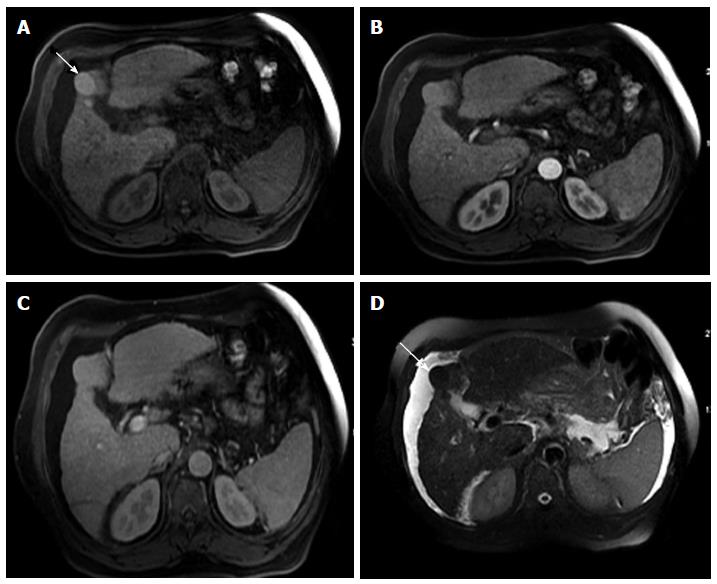
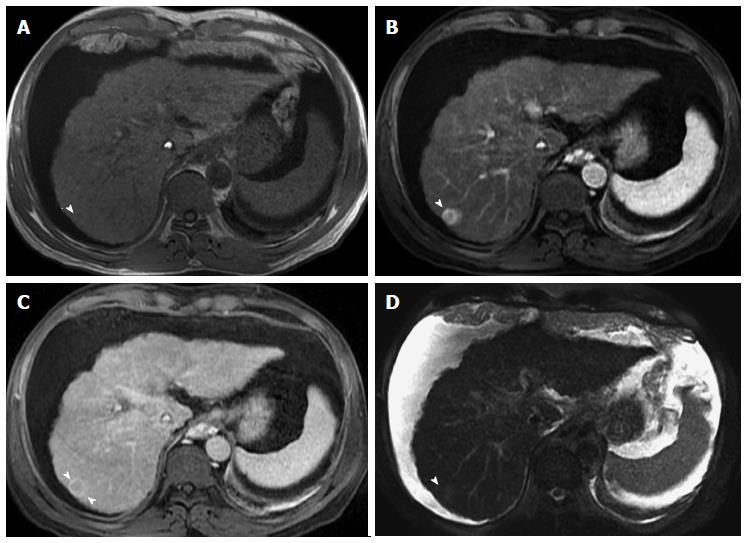
Figure 5 Dominant regenerative hepatic nodule.
A-C: Pre- and post-contrast fat-suppressed 3D-GRE T1-weighted images during the (B) late hepatic arterial and (C) poral venous phases; D: Fat-suppressed SSFSE T2-weighted image. There is a subcapsular, partially exophytic nodule at hepatic segment #5, which demonstrates increased intrinsic T1 signal on pre-contrast images (arrow, A) and isosignal intensity to background liver parenchyma on post-contrast images (C), without appreciable increased arterial enhancement (B) or increased T2 signal intensity (arrow, D) in keeping with a dominant regenerative nodule. GRE: Gradient recalled echo; SSFSE: Single-shot fast spin-echo.
Figure 6 Multiple siderotic hepatic nodules.
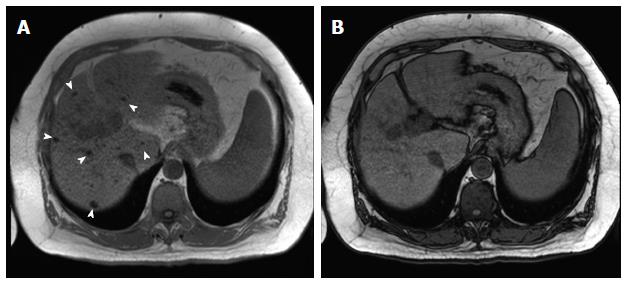
In-phase (TE = 4.9 ms) (A) and opposed-phase (TE = 2.4 ms) (B) GRE T1 weighted images. There are multiple small nodules seen through out the liver, which demonstrate isosignal intensity on the in-phase images (arrowheads, A), without corresponding abnormalities on the opposed-phase images in keeping with Multiple siderotic hepatic nodules. GRE: Gradient recalled echo.
Figure 7 Large, fat-containing hepatocellular carcinoma.
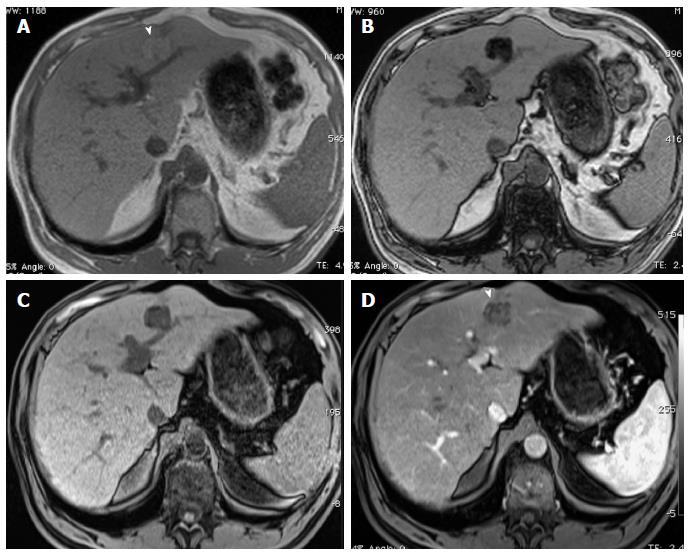
In-phase (A) and opposed-phase (B) GRE T1 weighted images. Pre- (C) and post-contrast fat-suppressed 3D-GRE T1-weighted images during late hepatic arterial phase (D). There is a prominent left hepatic nodule, which demonstrates minimally increased intrinsic T1 signal on the in-phase images (arrowhead, A) and low signal intensity on the opposed-phase (B) and pre-contrast images (C), indicating the presence of fat. The lesion demonstrates heterogeneous mildly increased arterial enhancement (arrowhead, D) in keeping with a fat-containing HCC. HCC: Hepatocellular carcinoma; GRE: Gradient recalled echo.
Figure 8 High-grade dysplastic nodules.
Pre- (A) and post-contrast fat-suppressed 3D-GRE T1-weighted images during the (B) Late hepatic arterial; and (C) Delayed phases; (D) Fat-suppressed SSFSE T2-weighted image. There is a nodule at hepatic segment #7, which demonstrates iso T1 signal intensity (A), increased arterial enhancement (arrowhead, B), without definite washout or corresponding T2 signal abnormality in keeping with a HGDN. However, early HCC cannot be totally excluded and short-term follow-up should be recommended, especially in patients with hepatitis C infection. HGDN: High-grade dysplastic nodules; HCC: Hepatocellular carcinoma; GRE: Gradient recalled echo; SSFSE: Single-shot fast spin-echo.
Figure 9 Dysplastic nodule progressing into an hepatocellular carcinoma.
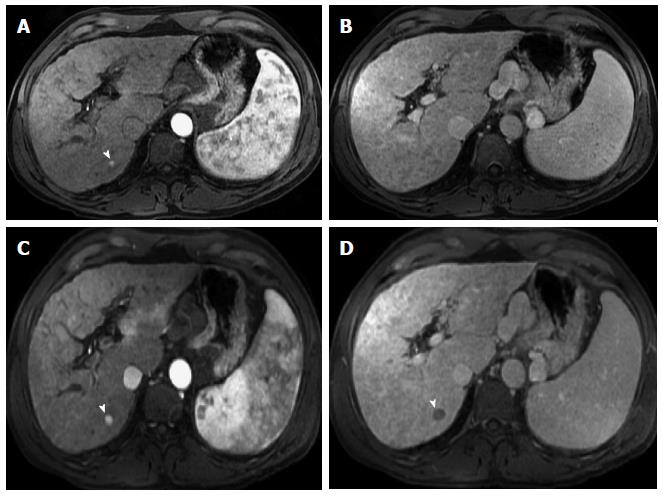
Post-contrast fat-suppressed 3D-GRE T1-weighted images during the late hepatic arterial (A and C) and delayed phases (B and D). There is a small right hepatic lobe nodule, which demonstrates increased arterial enhancement (arrowhead, A) and fades out on the delayed images (B) on the initial examination. On the 4-month follow-up study, there is evidence of interval growth (arrowhead, C, D) and development of clear delayed washout (arrowhead, D) both of which are signs of progression into HCC. HCC: Hepatocellular carcinoma; GRE: Gradient recalled echo.
Figure 10 Arterioportal shunt.
Post-contrast fat-suppressed 3D-GRE T1-weighted images during the late hepatic arterial (A and B) and delayed phases (C); D: Fat-suppressed SSFSE T2-weighted image. There is a convoluted linear area of increased arterial enhancement with a vessel leading to it (arrowhead, A, B), which does not demonstrate delayed washout (C), or corresponding T2 signal abnormality in keeping with an AP shunt. SSFSE: Single-shot fast spin-echo; GRE: Gradient recalled echo.
Figure 11 Classical hepatocellular carcinoma.
A: Pre- and post-contrast fat-suppressed 3D-GRE T1-weighted images during the late hepatic arterial (B) and delayed phases (C); D: Fat-suppressed SSFSE T2-weighted image. There is a peripheral well defined left hepatic lobe nodule, which demonstrates iso T1 signal intensity (A), increased arterial enhancement (arrowhead, B), delayed washout and pseudocapsule enhancement (C), and mildly increased T2 signal (arrowhead, D) in keeping with classical features of HCC. HCC: Hepatocellular carcinoma; GRE: Gradient recalled echo; SSFSE: Single-shot fast spin-echo.
Figure 12 Small, non-washing-out hepatocellular carcinoma.
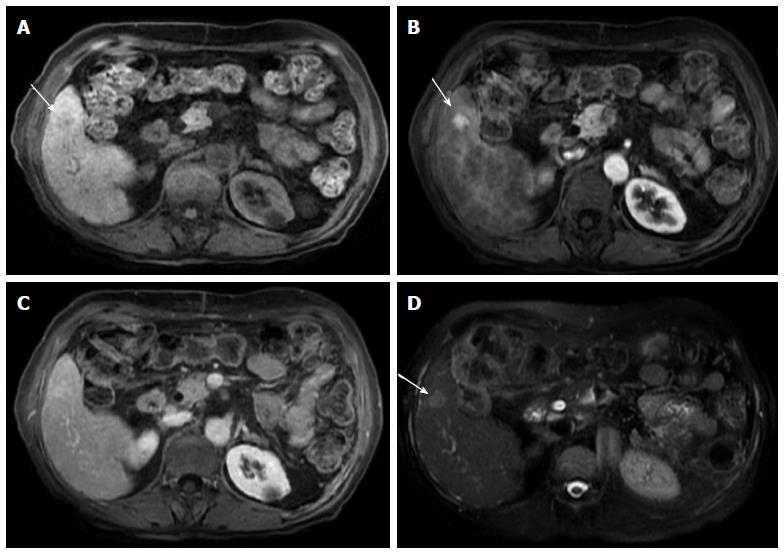
A: Pre- and post-contrast fat-suppressed 3D-GRE T1-weighted images during the late hepatic arterial (B) and delayed phases (C). D: Fat-suppressed SSFSE T2-weighted image. There is a small nodule at hepatic segment #5, which demonstrates minimally decreased T1 signal on pre-contrast images (arrow, A) and increased arterial enhancement (arrow, B). The nodule demonstrates iso to slightly increased signal on the delayed phase images, without clear washout (C), but mildly increased T2 signal intensity (arrow, D) in keeping with an HCC. Note that T2 signal alteration increased the accuracy of diagnosing HCC in this patient, despite the lack of delayed washout (also see Figure 17). HCC: Hepatocellular carcinoma; GRE: Gradient recalled echo; SSFSE: Single-shot fast spin-echo.
Figure 13 Large hepatocellular carcinoma with delayed pseudocapsule enhancement but no intralesional washout.
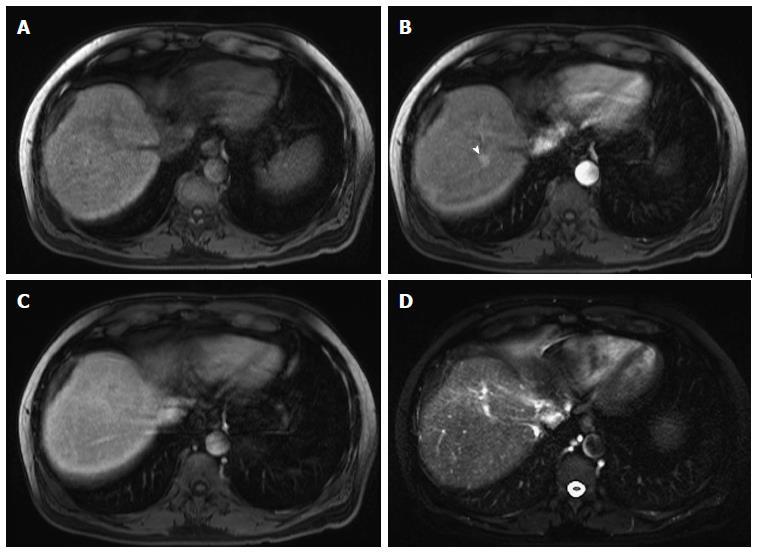
Post-contrast fat-suppressed 3D-GRE T1-weighted images during the (A) late hepatic arterial, (B) poral venous, and (C) delayed phases; D: Fat-suppressed SSFSE T2-weighted image. There is a large right hepatic lobe mass, which demonstrates heterogeneous, intensely increased arterial enhancement (arrowhead, A) with progressive fading throughout the subsequent images (B), but no clear washout (C). The lesion demonstrates delayed pseudocapsular enhancement (black arrowheads, C) and mildly increased T2 signal intensity (arrowhead, D) in keeping with a large HCC. HCC: Hepatocellular carcinoma; GRE: Gradient recalled echo; SSFSE: Single-shot fast spin-echo.
Figure 14 Slow growing, well-differentiated, fat-containing, small hepatocellular carcinoma.
In-phase (A) and opposed-phase GRE T1 weighted images (B); Post-contrast fat-suppressed 3D-GRE T1-weighted images during the late hepatic (C) arterial and delayed phases (D). E, F: Post-contrast fat-suppressed 3D-GRE T1-weighted delayed images from prior examinations performed 1 and 2 years prior, respectively. The is a small left hepatic lobe nodule, which demonstrates drop of signal on the opposed-phase image (arrowhead, B) compared to the in-phase image (A), increased arterial enhancement (arrowhead, C), and delayed washout (arrowhead,D). The lesion does not demonstrate significant change in size from the immediate prior examination (E). However, when compared with a more remote examination (F), substantial interval growth can be appreciated consistent with a slow growing, well-differentiated, fat-containing, small HCC. HCC: Hepatocellular carcinoma; GRE: Gradient recalled echo.
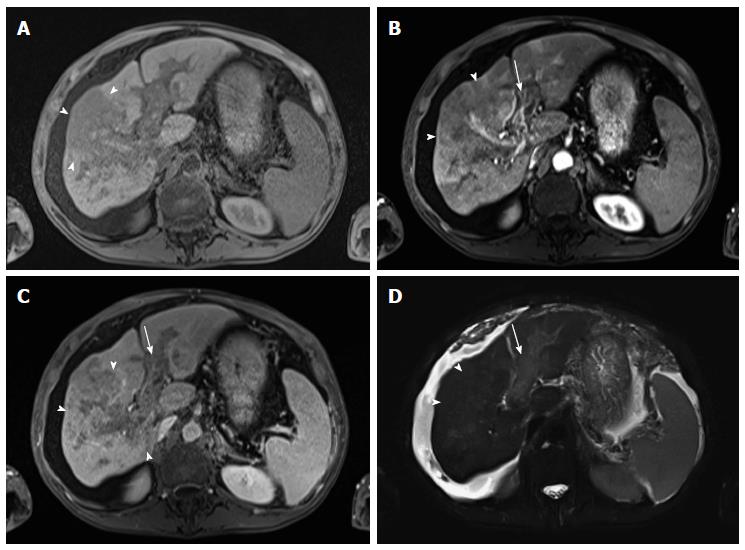
Figure 15 Diffuse hepatocellular carcinoma associated with tumor thrombus.
(A) Pre- and post-contrast fat-suppressed 3D-GRE T1-weighted images during the (B) late hepatic arterial and (C) delayed phases; (D) Fat-suppressed SSFSE T2-weighted image. There is a large ill-defined area involving the right hepatic lobe, which shows decreased T1 signal in pre-contrast images (arrowheads, A), heterogeneous mildly increased arterial enhancement (arrowheads, B), and heterogeneous delayed washout with permeative appearance (arrowheads, C), and heterogeneous mildly increased T2 signal (arrowhead, D) in keeping with HCC. There is also evidence of expansion of the portal vein branches, abnormal increased arterial enhancement (arrow, B), lack of opacification and washout on the delayed images (arrow, C), and mildly increased T2 signal (arrow, D) simulating the behavior of the primary tumor in keeping with diffuse tumor thrombus, a finding almost invariably associated with diffuse HCC subtype. Also of note is the mild to moderate ascites and omental hypertrophy secondary to portal hypertension. HCC: Hepatocellular carcinoma; GRE: Gradient recalled echo.
Figure 16 Ring-enhancing hepatocellular carcinoma, indicative of a more aggressive course.
A: In-phase GRE T1 weighted image; B: Post-contrast fat-suppressed 3D-GRE T1-weighted images during the (B) late hepatic arterial and (C) delayed phases; (D) Fat-suppressed SSFSE T2-weighted image. There is a small nodule at hepatic segment #7, which demonstrates iso to slightly low T1 signal (arrowhead, A), heterogeneous increased arterial enhancement, predominantly peripheral (arrowhead, B), washout and pseudocapsule enhancement on delayed images (arrowhead, C), and mildly increased T2 signal intensity (arrowhead, D) in keeping with ring-enhancing HCC. HCC: Hepatocellular carcinoma; GRE: Gradient recalled echo; SSFSE: Single-shot fast spin-echo.
Figure 17 Large, non-washing-out hepatocellular carcinoma.
A: Pre- and post-contrast fat-suppressed 3D-GRE T1-weighted images during the (B) late hepatic arterial and (C) delayed phases; D: Fat-suppressed SSFSE T2-weighted image. There is a sizable right hepatic lobe nodule, which demonstrates iso T1 signal intensity on pre-contrast images (A); increased arterial enhancement (arrowhead, B); becomes iso to slightly hyperintense compared to background liver, without definite washout, on the delayed images (C); and demonstrates mildly increased T2 signal intensity in keeping with HCC. Note that T2 sinal alteration increased the accuracy of diagnosing HCC in this patient, despite the lack of delayed washout (also see Figure 12). HCC: Hepatocellular carcinoma; GRE: Gradient recalled echo; SSFSE: Single-shot fast spin-echo.
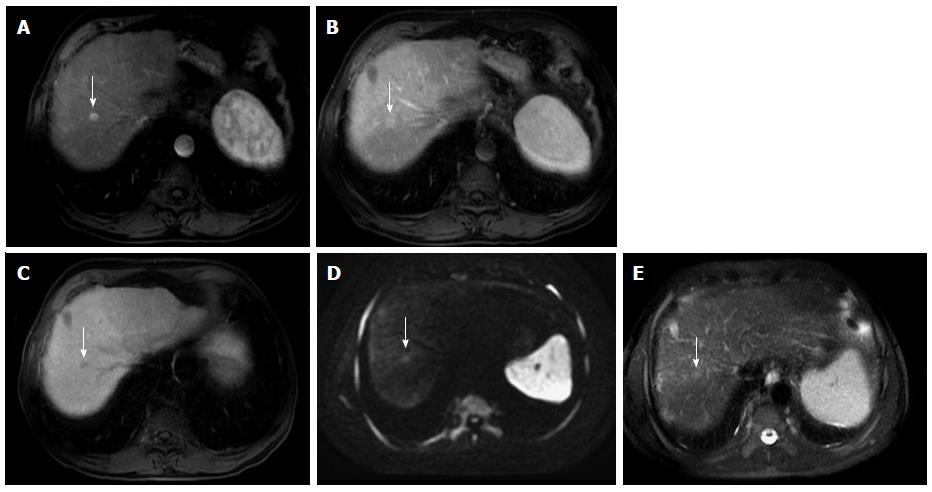
Figure 18 Small hepatocellular carcinoma showing the value of diffusion weighted image and hepatocyte-specific agents.
A: Post-contrast fat-suppressed 3D-GRE T1-weighted images during the (A) late hepatic arterial, (B) delayed, and (C) hepatobiliary phases; D: Diffusion weighted image (DWI) (b = 50); E: Fat-suppressed SSFSE T2-weighted image. There is a small right hepatic lobe nodule, which demonstrates increased arterial enhancement (arrow, A), fading out on the delayed images (arrow, B), and demonstrates significantly decreased uptake on the hepatobiliary phase (arrow, C). The lesion also demonstrates clear increased signal on DWI (arrow, D) and subtle increased T2 signal (arrow, E). The constellation of findings is consistent with HCC. The decreased uptake on the hepatobiliary phase and increased signal on DWI increased the accuracy of HCC diagnosis in this patient with a small hypervascular nodule. HCC: Hepatocellular carcinoma; GRE: Gradient recalled echo; SSFSE: Single-shot fast spin-echo.
- Citation: Watanabe A, Ramalho M, AlObaidy M, Kim HJ, Velloni FG, Semelka RC. Magnetic resonance imaging of the cirrhotic liver: An update. World J Hepatol 2015; 7(3): 468-487
- URL: https://www.wjgnet.com/1948-5182/full/v7/i3/468.htm
- DOI: https://dx.doi.org/10.4254/wjh.v7.i3.468


