Copyright
©The Author(s) 2015.
World J Hepatol. Mar 27, 2015; 7(3): 468-487
Published online Mar 27, 2015. doi: 10.4254/wjh.v7.i3.468
Published online Mar 27, 2015. doi: 10.4254/wjh.v7.i3.468
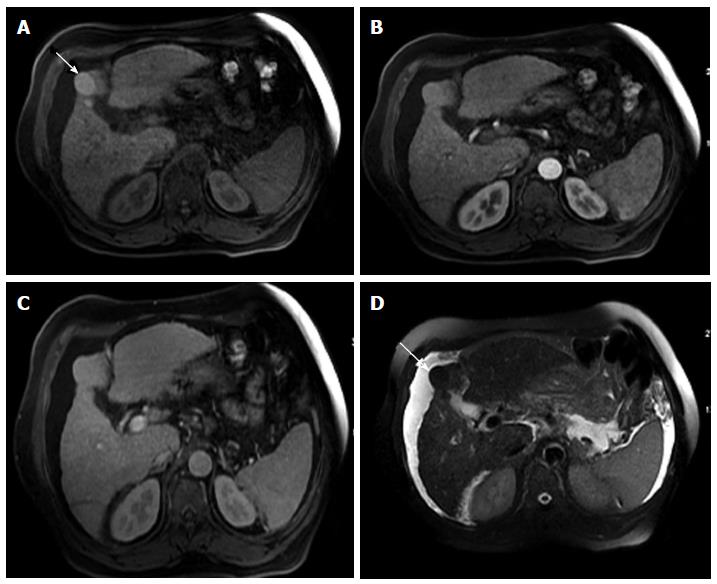
Figure 5 Dominant regenerative hepatic nodule.
A-C: Pre- and post-contrast fat-suppressed 3D-GRE T1-weighted images during the (B) late hepatic arterial and (C) poral venous phases; D: Fat-suppressed SSFSE T2-weighted image. There is a subcapsular, partially exophytic nodule at hepatic segment #5, which demonstrates increased intrinsic T1 signal on pre-contrast images (arrow, A) and isosignal intensity to background liver parenchyma on post-contrast images (C), without appreciable increased arterial enhancement (B) or increased T2 signal intensity (arrow, D) in keeping with a dominant regenerative nodule. GRE: Gradient recalled echo; SSFSE: Single-shot fast spin-echo.
- Citation: Watanabe A, Ramalho M, AlObaidy M, Kim HJ, Velloni FG, Semelka RC. Magnetic resonance imaging of the cirrhotic liver: An update. World J Hepatol 2015; 7(3): 468-487
- URL: https://www.wjgnet.com/1948-5182/full/v7/i3/468.htm
- DOI: https://dx.doi.org/10.4254/wjh.v7.i3.468


