


Published online Sep 16, 2022. doi: 10.12998/wjcc.v10.i26.9207
Peer-review started: February 11, 2022
First decision: June 7, 2022
Revised: June 19, 2022
Accepted: July 25, 2022
Article in press: July 25, 2022
Published online: September 16, 2022
Processing time: 202 Days and 15 Hours
The coronavirus disease 2019 (COVID-19) has currently caused the mortality of millions of people around the world. Aside from the direct mortality from the COVID-19, the indirect effects of the pandemic have also led to an increase in the mortality rate of other non-COVID patients. Evidence indicates that novel COVID-19 pandemic has caused an inflation in acute cardiovascular mortality, which did not relate to COVID-19 infection. It has in fact increased the risk of death in cardiovascular disease (CVD) patients. For this purpose, it is dramatically inevitable to monitor CVD patients’ vital signs and to detect abnormal events before the occurrence of any critical conditions resulted in death. Internet of things (IoT) and health monitoring sensors have improved the medical care systems by enabling latency-sensitive surveillance and computing of large amounts of patients’ data. The major challenge being faced currently in this problem is its limited scalability and late detection of cardiovascular events in IoT-based computing environments. To this end, this paper proposes a novel framework to early detection of cardiovascular events based on a deep learning architecture in IoT environments. Experimental results showed that the proposed method was able to detect cardiovascular events with better performance (95.30% average sensitivity and 95.94% mean prediction values).
Core Tip: This paper has focused on presenting a health monitoring system for cardiovascular disease patients during coronavirus disease 2019 pandemic. For this purpose, a new framework for early detection of cardiovascular events was proposed based on a deep learning architecture in internet of things environments. The proposed method has provided a peaceful solution for limited scalability and late detection of cardiovascular events by enabling latency-sensitive surveillance and computing of large amounts of patients’ data.
- Citation: Dami S. Internet of things-based health monitoring system for early detection of cardiovascular events during COVID-19 pandemic. World J Clin Cases 2022; 10(26): 9207-9218
- URL: https://www.wjgnet.com/2307-8960/full/v10/i26/9207.htm
- DOI: https://dx.doi.org/10.12998/wjcc.v10.i26.9207
The novel coronavirus disease 2019 (COVID-19) has spread significantly worldwide, posing new challenges to the research community. Although governments have taken many steps to control the virus and have implemented social distancing in public places, the need for health monitoring systems has increased dramatically, and effective management of patients with COVID-19 disease has become a challenge for hospitals[1]. Due to its extremely negative effects on public health, the COVID-19 pandemic is one of the most serious problems facing today's modern world[2]. With the new COVID-19 pandemic considering the growing population of the elderly and people with severe underlying diseases, and the high cost of caring for these patients, the growing need for remote health monitoring has become a vital issue in today's life. Immediate monitoring of patients and analysis of their health status can reveal vital and abnormal conditions that are very valuable for early detection of any threatening case[3].
In addition, the pandemic has had a significant effect on vulnerable populations such as the elderly and people with chronic and underlying diseases such as cardiovascular disease (CVD). The abnormal events caused by CVD are usually difficult to detect[4]. People often do not even know they are in a critical condition until they do not suffer from heart problems or even critical conditions leading to stroke or death. Symptoms of heart problems are usually difficult to detect, and an experienced doctor is needed to examine the patient to make sure there is a heart problem. This is practically difficult due to the lack of a doctor and the delays in seeking help in the case of the COVID-19 pandemic[5]. Recent technologies such as medical internet of things (IoT) equipment have significantly contributed to developing remote health monitoring systems[3]. Existing health monitoring systems developed within the IoT framework connect pre-configured devices for processing patient data to deliver results on time. Many previous works have attempted to use the IoT to predict heart-related health problems but fail to ensure this with the precision required by the strict regulations of medical standardization agencies[6].
Medical diagnosis is usually faced with limitations such as the high cost and time of some tests[7]. Medical tests and clinical trials to detect the previous CVD are not performed equally for all patients due to a large number of patients and the lack of healthcare resources and facilities. Hence, this leads to a high level of abnormal events caused by CVD. Today, the management of health monitoring systems has become more difficult due to scarce and inefficient medical resources to meet growing medical monitoring. As a result, medical care units and health monitoring centers need to detect these abnormal events early to prevent them from occurring in the early steps. Because in the case of late detection of many CVD events, there is no explicit medical or therapeutic support, and it can lead to the death of patients. As a result, an IoT-based health monitoring system is urgently needed for early detection and effective measures to prevent CVD-induced hazardous events, especially in the face of rapidly growing pandemics. In addition, other old data storage systems and infrastructures are no longer effective for modern sensor-based operating systems in which data size, speed, and amplitude are emerging[8]. Similarly, current health monitoring systems are inefficient in producing accurate physical parameters of the patient's body because they use common technologies and approaches[9]. An enormous benefit in IoT sensor technologies has made it possible to design health monitoring systems for the early detection of cardiovascular events during the COVID-19 pandemic. However, detecting such events is challenging due to the constant changes in IoT environments[10]. In recent years, deep learning has been widely studied in various fields. The benefits of deep learning include the automatic extraction and representation of features automatically; the main challenges are limited scalability and late detection. The purpose of the present study was to detect cardiovascular events early in the IoT computing environments based on deep learning.
In recent years, the growth of the IoT and wearable sensor technology related to medical devices has enhanced patient care quality through smart remote health monitoring systems[11]. IoT equipment is widely used in remote health and medical monitoring systems[12,13]. The IoT covers a range of smart mobiles, mHealth applications, wearable sensors, and other health monitoring tools that generate large amounts of patient health data. These IoT devices are used to detect cardiovascular patients' health status and transfer this information to the doctor and clinic. Then, these data are used for disease analysis and early detection of abnormal events[8]. This technology enables IoT-based devices to work more efficiently on the Internet. Wearable sensor-based IoT devices are more valuable for patient care and health monitoring services that extract accurate physiological information from patients to detect the disease[9]. One of the proposed approaches for predicting and detecting CVDs is the use of electrocardiograms (ECGs) which can be achieved by monitoring and measuring ECG signals more accurately and predictably[14]. ECG signals can display the heartbeat rhythm from the ECG and detect a regular or irregular heart rhythm. Each type of arrhythmia results in a distinct type of ECG change that provides information about structural abnormalities of the heart, the effect of drugs on heart rhythm and electrical conduction, high blood pressure, kidney problems, or hormonal problems that affect the heart's electrical pattern in specific pathways for the doctor[15]. Although an abnormal ECG signal does not indicate heart disease, there is usually confidence that it can be used to detect CVD and its abnormal events[16]. According to research[17], heart disease is the leading cause of death in the elderly in European countries, mainly due to recent arrhythmias.
Numerous studies have been conducted on IoT wearable sensors and their applications in medical monitoring techniques, such as the IoT-based wearable body sensor network (WBSN) for the COVID-19 pandemic[18] which has been used with early detection of the disease to reduce the possible prevalence of pandemic during quarantine and after recovery. Also, an IoT-based framework for remote health monitoring of COVID-19 patients in the intensive care unit (ICU) is presented in Filho et al[19]. A similar system is provided in Khan et al[20] for IoT-based real-time health monitoring by measuring body temperature, pulse rate, and oxygen saturation in an Arduino Uno-based system, the most important measurement required for the ICU. Ganguly et al[21] have also used machine learning power to find patterns in medical data fluctuations to predict CVD in the Arduino-based IoT infrastructure. A decision support system for analyzing multi-sensor healthcare data[22] is proposed to predict heart disease by the WBSN. This is done with a supervised learning approach by a modified deep belief network in conjunction with the squirrel search algorithm as a feature selection method. A health monitoring system based on deep learning in the IoT context[23] is also developed to predict CVD. Similarly, Yeh et al[24] have used deep neural networks to analyze ECG signals to assess the patient's condition and give appropriate drugs. The deep learning approach is also used in the IoT[25] for valvular heart disease screening. Other deep learning approaches such as convolutional neural networks[26] and long short-term memory networks[27] have also been proposed to use cardiovascular monitoring of COVID-19 patients by 5G-equipped medical wearable devices.
Some body sensors have been developed for continuous monitoring of healthcare to monitor heart rate, blood pressure, blood sugar levels, body temperature, personal fitness, and awareness of physical activity[28]. This study uses three sensors to monitor and control ECG signals, including a respiratory sensor, optical sensor, and heart rate sensor[14], connected to a data processing center via the Internet and Wi-Fi technology. Data obtained from ECG signals are sent to a data processing center and analyzed to detect CVD. A deep learning approach was used to analyze the data received in the data processing center. Due to the large volume of data generated at the moment, dimension reduction and extraction of effective features are performed on this data. Training operations are performed on the extracted features so that the system can be scalable and, at the time of detection, as soon as abnormal events are predicted, produce an appropriate warning and send the patient's position to all stakeholders. The data set used in this study includes the features of heart rate variability (HRV) extracted from a selected 5-min of 24-h clinical electrocardiographic data set of cardiovascular patients that were extracted in both temporal and frequency spaces.
IoT-based healthcare measures monitor the patient's health status over 24 h and 7 d and avoid face-to-face hospitalization, which leads to additional costs and effort. Obstacles in the old healthcare system, delays in two-way communication between sensors and a remote server, are being replaced by IoT devices by speeding up today's Internet protocols, which allow direct connection of various sensor devices. Advances in wireless sensor network technology focus on WBSN as a wearable node and receive signals such as body temperature, pulse rate, and oxygen level from the patient (Figure 1). ECG data are gathered using a wearable monitoring node and are transmitted directly to the IoT using Wi-Fi. Both the hypertext transfer protocol (HTTP) and message queue telemetry transport (MQTT) protocols are employed in the IoT in order to provide visual and timely ECG data to users using REST service. Three different sensors make up this network[6], including medical sensors, activity sensors, and environmental sensors. Medical sensors include an ECG sensor, an electroencephalogram sensor, an electro-mammography sensor, an oxygen level sensor, a temperature sensor, a respiration rate sensor, and a glucose level sensor. These sensors monitor people with dangerous heart disease and continuously collect vital signs and ECG signals and report this information to a local server. The local server stores the information and immediately sends a warning to the Remote Healthcare Unit (RHU) if it receives any abnormal symptoms while processing the information and detects that these symptoms lead to a sudden heart attack or death. The RHU evaluates the warning and takes appropriate and timely action to help the patient save his life. Figure 2 shows the process performed in the proposed health monitoring system.


The data collected by each IoT device, after pre-processing and normalization, is transferred to the data storage unit on a local server to extract the effective features. In this study, the features of HRV on ECG signals are used to detect healthy and sick individuals. These features have abilities that can be used to detect the disease and even classify the disease. Time-domain features include the following set of statistical features[29]: MNN (mean RR distances per piece of HRV signal), SDNN (standard deviation of RR distances per piece of HRV signal), RMSSD (square root mean of difference RR at each piece of HRV signal), SDSD (standard deviation of the difference between RR at each piece of HRV signal), PNN50 (percentage of RR at each piece of HRV signal that differs by more than 50 milliseconds). These features can help detect healthy and diseased classifications. In the next step, the signal energy was extracted in the very-low-frequency band (0.04-0.03 Hz), the low-frequency (LF) band (0.04-0.15 Hz), and the high-frequency (HF) band (0.15-0.4 Hz) using spectrum estimation method. The signal power spectrum was calculated using the Burg parametric method[29]. High frequencies in the HRV signal power spectrum indicate the activity of the parasympathetic part of the nervous system. Also, low frequencies indicate the activity of the sympathetic part of the autonomic nervous system that controls the heart rate. Hence, the ratio of signal energy in the LF band to signal energy in the HF band can be used as a feature that evaluates sympathetic and parasympathetic balance.
The large amount of data collected from the sensors may slow down the process of monitoring and processing the signals. Because increasing the number of features increases the computational cost of a system, designing and implementing systems with the least number of features is essential. On the other hand, it is very important to pay attention to the fact that an effective subset of features must be selected to create an acceptable performance for the system. The main purpose of feature selection is to reduce the dimensions of the feature vector in the classification so that an acceptable classification rate is achieved. In this case, the features with less distinctive power are removed, and some features containing the appropriate information to differentiate the pattern classes remain. Numerous solutions and algorithms have been proposed for the feature selection problem. In this study, important features for evaluating the previous disease are selected using rough set theory (RST). RST is a smart mathematical tool for dealing with uncertainties in smart data analysis. The concept of base set theory is based on the assumption that each member of the universal set, U, contains specific information described by some features (Q). This information can be found in the data table, where each row indicates different objects, and each column represents a feature of that object. If the set of features Q is divided into conditional features C and decision feature D in the data table, so that Q = C ∪ D, the resulting table is called decision table S.
Each subset X of the universal set may be expressed as exact or approximate in these separated sets. The subset X may be identified by two normal sets called the lower and upper approximations. According to (1), the lower approximation of X is composed of all completely separated sets in X (where the elements X, of course, belong to X).
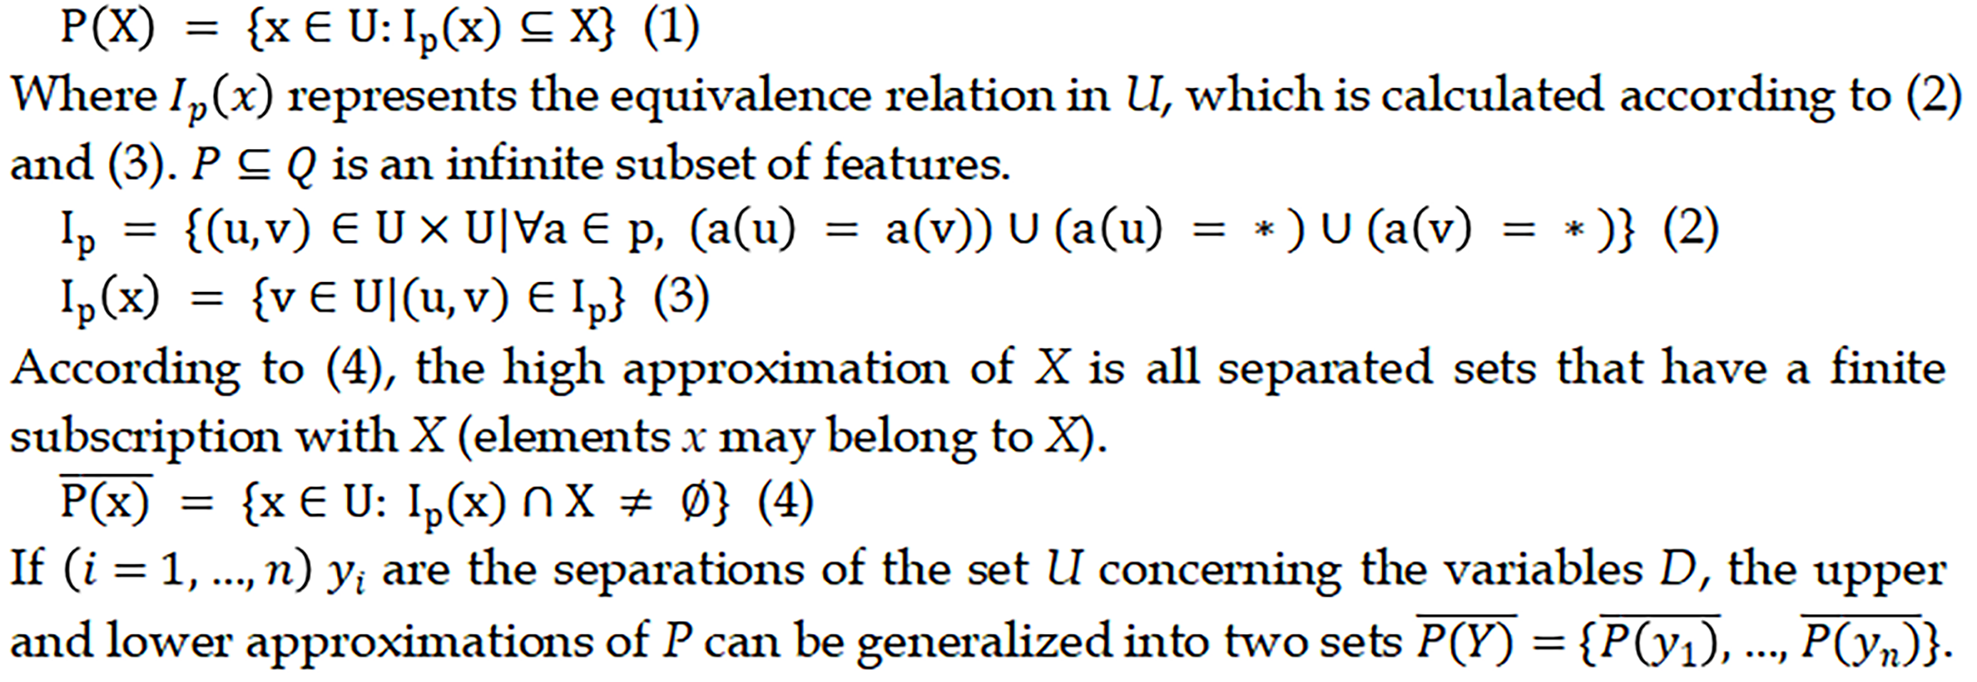
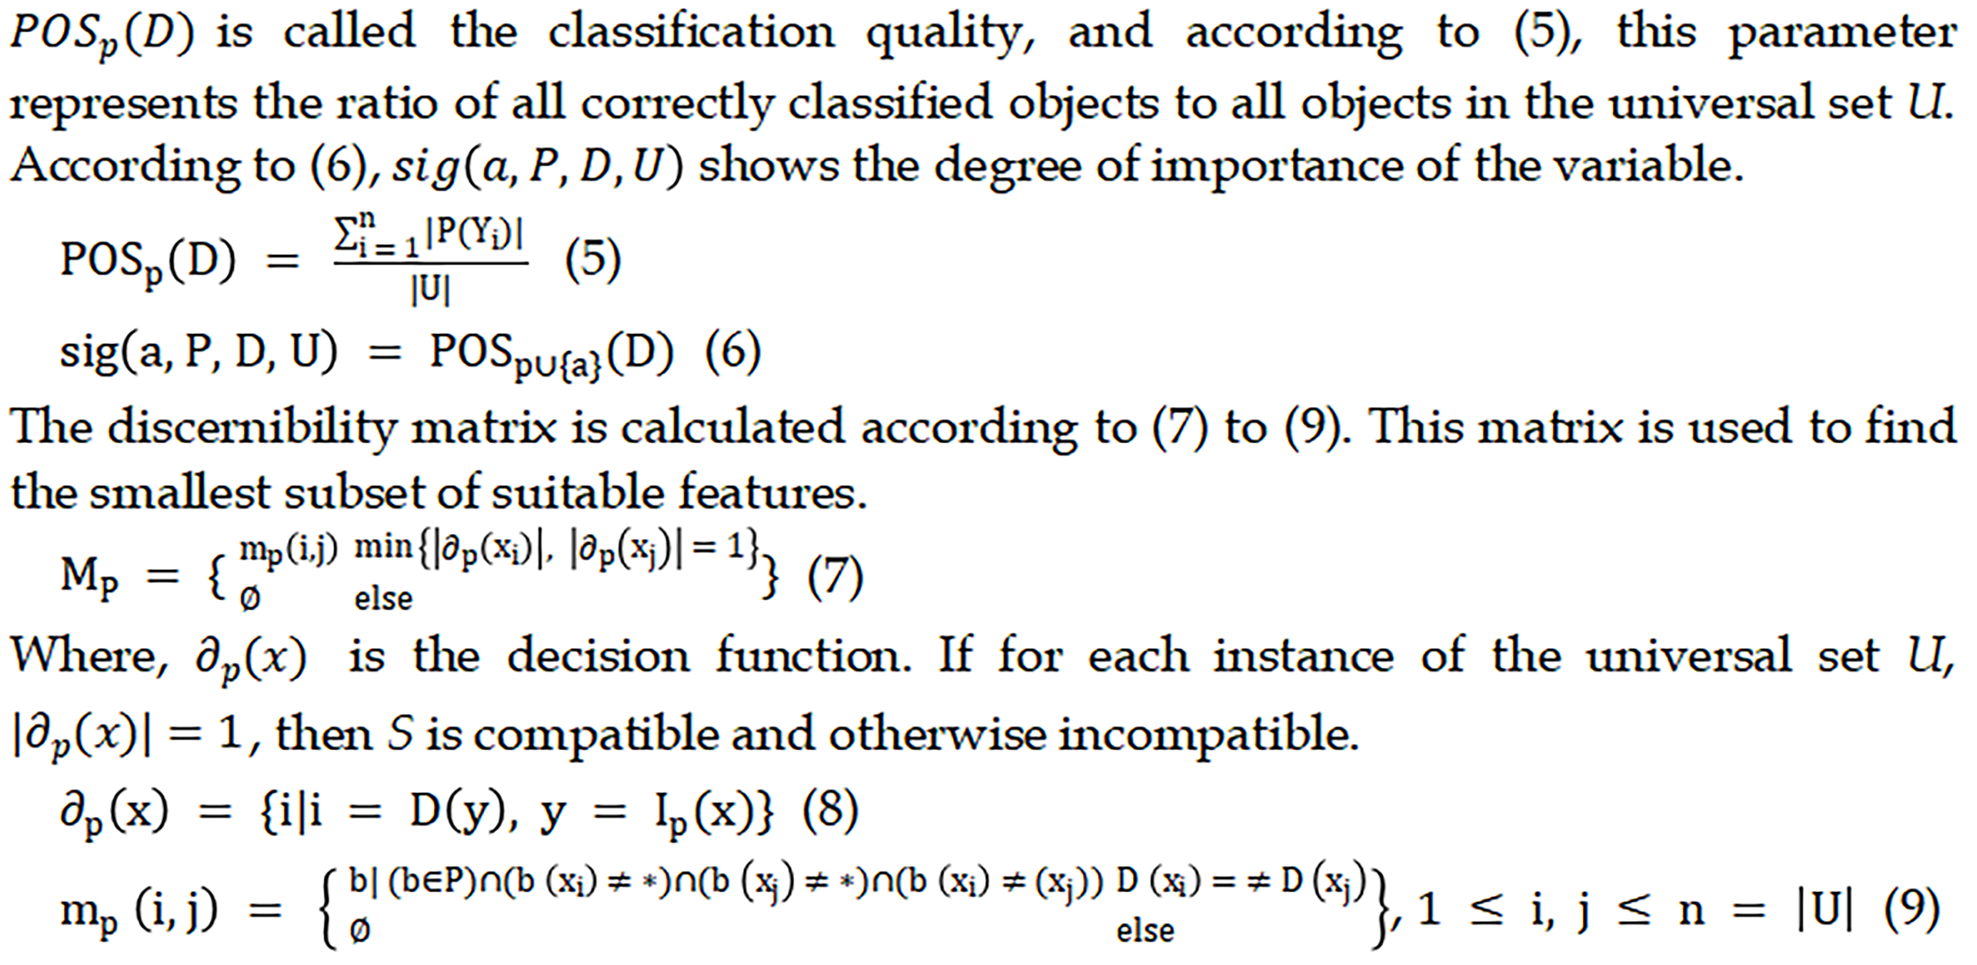
Once the smallest subset of the appropriate features is found, all the not in the reduced set are removed. Then, the features are rated based on their importance. The importance of a feature is expressed in terms of how important a feature is in the classification process. This criterion is determined based on feature dependency attributes. In this study, the rough sets theory is used to integrate similar features and reduce their number. The rough set theory increases the processing speed and detection rate of cardiovascular events.
A long short-term memory (LSTM) neural network[14] - a type of recursive neural network - was used for classification, that is very suitable for studying time series and continuous data. One of the LSTM network characteristics is that it can learn long-term dependencies between the time steps of a sequence. The LSTM layer can look at the time sequence forward, while the bidirectional LSTM layer can look at the time sequence both forward and backward. In this study, a bidirectional LSTM layer was used. Unlike traditional recursive networks, which simply compute a balanced sum of input signals and then pass through an activation function, each LSTM uses a memory Ct at time t. The output ht or LSTM unit activation is ht = T0.tanh (Ct), where T0 is the output gateway that controls the amount of content delivered through memory. The output gateway is calculated using the expression (W0.[ht-1, Xt] + b0) T0 = σ, where σ is the sigmoid activation function. W0 is also a bias matrix. The memory cell Ctis also updated by partially forgetting the current memory and adding new memory conten 
The amount of current memory to be forgotten is controlled by the Tf forgetfulness gateway. The amount of new memory content to be added to the memory cell is handled by the updated gateway (sometimes known as the input gateway). This operation is performed by calculations (10) and (11):
Tf = σ (Wf.[ht-1, Xt] + bf)
Tu = σ (Wu.[ht-1, Xt] + bu) (10)
h<t> = tanh (Wtx<t> + W2h<t-1> + bh)
o<t> = soft max (W3h<t> + b0) (11)
Figure 3 shows the structure of an LSTM memory unit in which, at each time step, the contents of each cell are replaced by new values from the previous time step and new input. Therefore, the memory vector can affect some very limited current time steps.

In this study, respiratory sensor, optical sensor and heart rate monitoring sensor were used in a Wi-Fi-based sensor network to detect cardiovascular events. All sensors receive ECG signals from the body and transmit them to the IoT environment via a Wi-Fi module. The IoT environment includes two types of HTTP and MQTT servers. The HTTP server is used to provide a graphical user interface, and the MQTT server is used to transmit ECG signals. Unlike HTTP, the MQTT protocol is used for long-term, real-time communication. With this approach, a patient's ECG signals are instantly received through a web browser; they are automatically analyzed. A warning alarm is sent to the doctor, patient, or those around him if a cardiovascular event is detected.
To evaluate the performance of smart analysis, the UCI cardiac arrhythmia dataset was used[15]. This data set contains 452 ECG signals of different people of different ages and genders. 279 features were extracted from these signals, some of the most important of which are listed in Table 1.
| Features | Values |
| Age | Yr |
| Sex | Male = 0, female = 1 |
| Height | cm |
| Weight | Kg |
| QRS length | Average QRS length in milliseconds |
| Distance P-R | Average time interval between the start of waves P and Q in milliseconds |
| Distance Q-T | Average time interval between start of wave Q and end of wave T in milliseconds |
| Distance T | Average time interval of wave T in milliseconds |
| Distance P | Average P wave distance in milliseconds |
| QRS | Degree vector angles on the screen |
| T | Degree vector angles on the screen |
| P | Degree vector angles on the screen |
| QRST | Degree vector angles on the screen |
| J | Degree vector angles on the screen |
| Heart rate | Heart rate per minute |
The name of classes and the number of data in each class are shown in Table 2[15].
| Class No. | Class name | Number of classes |
| C1 | Normal | 245 |
| C2 | Ischemic changes (coronary artery diseases) | 44 |
| C3 | Old anterior myocardial infarction | 15 |
| C4 | Old inferior myocardial infarction | 15 |
| C5 | Sinus tachycardy | 13 |
| C6 | Sinus bradycardy | 25 |
| C7 | Ventricular premature contraction (pvc) | 3 |
| C8 | Supraventricular premature contraction | 2 |
| C9 | Left bundle branch block | 9 |
| C10 | Right bundle branch block | 50 |
| C11 | 1 Degree antrioventricular block | 0 |
| C12 | 2 Degree AV block | 0 |
| C13 | 3 Degree AV block | 0 |
| C14 | Left ventricule hypertrophy | 4 |
| C15 | Atrial fibrillation or flutter | 5 |
| C16 | Others | 22 |
The basic parameters evaluated include true positive, true negative, false positive, and false negative values. The confusion matrix is shown in Table 3.
| True results | |||
| Positive | Negative | ||
| Test results | Positive | TP | FP |
| Negative | FN | TN | |
Based on the parameters listed in Table 3, the evaluation criteria of positive prediction value (PPV), negative prediction value (NPV) and sensitivity for the proposed system test results are defined as relationships (12) to (14).
The k-fold cross-validation method was used to train the proposed system. In this method, at each run, 1/k of the data is randomly considered as a test set, and the rest as a training set, and the evaluation criteria are calculated on the test set. This process is performed k times, and finally, the mean of the calculated values is reported as the result of each evaluation parameter.
One of the benefits of using feature selection in the proposed system is the reduction of test and training time of the LSTM neural network and, of course, the reduction of computational costs and consequently the reduction of computer resources such as memory and CPU time, which is essential for early detection of cardiovascular events. For this purpose, test and training time in two cases of without feature selection (LSTM) and with feature selection (RST-LSTM) is calculated, which is shown in Table 4. The desired time is based on milliseconds.
| Time | LSTM | RST-LSTM | Time reduction |
| Training | 217154 ms | 69247 ms | 68.11% |
| Test | 23854 ms | 3856 ms | 83.83% |
Comparison of PPV, NPV, and Sensitivity of the proposed system, separately for cardiac arrhythmia classes for with/without feature selection, is shown in Tables 5-7. Obviously, by feature selection, the PPV, NPV and sensitivity of the proposed system for all cases increase. In almost all cardiac arrhythmia classes, the detection rate of evaluation criteria in the feature selection case is greater than when we use all data set features. In particular, the detection percentage for classes C6 and C16 is significantly increased when using feature selection. The system also uses important features to have a higher power to detect new and unknown cardiovascular events that have not been encountered during training and are only present in the test suite.
| Class No. | LSTM | RST-LSTM | Class No. | LSTM | RST-LSTM |
| C1 | 97.65 | 98.44 | C9 | NaN | NaN |
| C2 | 89.54 | 90.23 | C10 | 98.49 | 99.83 |
| C3 | 98.76 | 99.08 | C11 | NaN | NaN |
| C4 | 99.14 | 99.12 | C12 | NaN | NaN |
| C5 | 98.26 | 98.74 | C13 | NaN | NaN |
| C6 | 94.29 | 96.63 | C14 | 98.16 | 98.94 |
| C7 | NaN | NaN | C15 | NaN | NaN |
| C8 | NaN | NaN | C16 | 87.63 | 89.90 |
| Average PPV | LSTM | 95.76 | Average PPV | RST-LSTM | 96.77 |
| Class No. | LSTM | RST-LSTM | Class No. | LSTM | RST-LSTM |
| C1 | 96.74 | 98.14 | C9 | NaN | NaN |
| C2 | 84.27 | 86.45 | C10 | 97.45 | 98.32 |
| C3 | 98.79 | 99.16 | C11 | NaN | NaN |
| C4 | 97.56 | 98.87 | C12 | NaN | NaN |
| C5 | 98.23 | 98.12 | C13 | NaN | NaN |
| C6 | 90.29 | 92.64 | C14 | 98.34 | 99.05 |
| C7 | NaN | NaN | C15 | NaN | NaN |
| C8 | NaN | NaN | C16 | 83.11 | 85.36 |
| Average NPV | LSTM | 93.86 | Average NPV | RST-LSTM | 95.12 |
| Class No. | LSTM | RST-LSTM | Class No. | LSTM | RST-LSTM |
| C1 | 98.54 | 99.16 | C9 | NaN | NaN |
| C2 | 86.73 | 88.57 | C10 | 98.24 | 98.65 |
| C3 | 99.54 | 99.52 | C11 | NaN | NaN |
| C4 | 97.98 | 98.86 | C12 | NaN | NaN |
| C5 | 98.36 | 98.87 | C13 | NaN | NaN |
| C6 | 89.56 | 92.19 | C14 | 97.92 | 99.03 |
| C7 | NaN | NaN | C15 | NaN | NaN |
| C8 | NaN | NaN | C16 | 81.57 | 82.87 |
| Average sensitivity | LSTM | 94.27 | Average sensitivity | RST-LSTM | 95.30 |
For further experiments, several another state-of-the-art studies[14,30,31] have been investigated, where the performance of the proposed approach compares favorably with those approaches. The experimental results are shown in Figure 4.

It is clear from Figure 4 that the RST-LSTM performance was better than all models on the level of all performance measures, which confirms the superiority of the proposed model. There is only one exception, where the MDCNN[30] model outperforms proposed model and all other baselines in terms of the average NPV.
The IoT and smart medical equipment have improved patient health at any time and place by providing remote control and screening. Due to the unexpected and large increase in the number of patients during the COVID-19 pandemic, continuous monitoring of patient's health status is essential before any serious disorder or infection occurs. Patients with the novel COVID-19 have a significant rate of CVD, which is involved in the damage of the heart muscle caused by infection. Research has shown that the novel COVID-19 increases the risk of death in cardiovascular patients. On the other hand, heart disease is the second leading cause of death due to various problems in proper heart function. One of these problems is cardiac arrhythmia, which, if left undetected, can lead to irreversible problems such as heart attack and death. One way to detect this condition is to use the patient's ECG signals. This study aimed to provide a system for health monitoring of cardiovascular patients in pandemic conditions. The proposed system remotely records and processes the status of cardiovascular patients, especially the elderly or disabled, to detect abnormal events early with a deep learning approach while allowing doctor monitoring and control. The experimental results showed that the proposed RST-LSTM model outperform all other models on the level of average PPV (with 96.77% value), average NPV (with 95.12% value) and average sensitivity (with 95.30% value) performance measures, which confirms the superiority of our model. Finally, we can conclude that the RST-LSTM model provides a greater performance improvement than several state-of-the-art models.
The final goal of the automated analysis of ECG signals is to be implemented as a practical medical diagnostic tool in large-scale clinical settings. For this purpose, it is necessary to augment the practicality of algorithms by improving both their accuracy and computational complexity. Therefore, the complexity of proposed method is a critical point that needs to be addressed in future studies. It is also critical to find an efficient algorithm that satisfies the time and memory requirements for practical usage of cardiovascular event prediction. Evaluating the performance and computational efficiency of the proposed method on big data is considered as one of the future works, so that the proposed method can be tested in parallel or distributed platforms. Future work can also focus on data collection and analysis of healthcare systems to develop a stress detection system and predict arterial events in distributed computing environments.
Provenance and peer review: Invited article; Externally peer reviewed.
Peer-review model: Single blind
Specialty type: Cardiac and cardiovascular systems
Country/Territory of origin: Iran
Peer-review report’s scientific quality classification
Grade A (Excellent): 0
Grade B (Very good): 0
Grade C (Good): C, C
Grade D (Fair): 0
Grade E (Poor): 0
P-Reviewer: Ali N, Finland; Muneer A, Malaysia S-Editor: Zhang H L-Editor: A P-Editor: Guo X
| 1. | Zeroual A, Harrou F, Dairi A, Sun Y. Deep learning methods for forecasting COVID-19 time-Series data: A Comparative study. Chaos Solitons Fractals. 2020;140:110121. [RCA] [PubMed] [DOI] [Full Text] [Full Text (PDF)] [Cited by in Crossref: 337] [Cited by in RCA: 146] [Article Influence: 29.2] [Reference Citation Analysis (0)] |
| 2. | Toğaçar M, Ergen B, Cömert Z. COVID-19 detection using deep learning models to exploit Social Mimic Optimization and structured chest X-ray images using fuzzy color and stacking approaches. Comput Biol Med. 2020;121:103805. [RCA] [PubMed] [DOI] [Full Text] [Full Text (PDF)] [Cited by in Crossref: 273] [Cited by in RCA: 239] [Article Influence: 47.8] [Reference Citation Analysis (0)] |
| 3. | Akhbarifar S, Javadi HHS, Rahmani AM, Hosseinzadeh M. A secure remote health monitoring model for early disease diagnosis in cloud-based IoT environment. Pers Ubiquitous Comput. 2020;1-17. [RCA] [PubMed] [DOI] [Full Text] [Cited by in Crossref: 42] [Cited by in RCA: 19] [Article Influence: 3.8] [Reference Citation Analysis (0)] |
| 4. | Ullah W, Saeed R, Sarwar U, Patel R, Fischman DL. COVID-19 Complicated by Acute Pulmonary Embolism and Right-Sided Heart Failure. JACC Case Rep. 2020;2:1379-1382. [RCA] [PubMed] [DOI] [Full Text] [Full Text (PDF)] [Cited by in Crossref: 64] [Cited by in RCA: 131] [Article Influence: 26.2] [Reference Citation Analysis (0)] |
| 5. | Wu J, Mamas MA, Mohamed MO, Kwok CS, Roebuck C, Humberstone B, Denwood T, Luescher T, de Belder MA, Deanfield JE, Gale CP. Place and causes of acute cardiovascular mortality during the COVID-19 pandemic. Heart. 2021;107:113-119. [RCA] [PubMed] [DOI] [Full Text] [Full Text (PDF)] [Cited by in Crossref: 132] [Cited by in RCA: 129] [Article Influence: 32.3] [Reference Citation Analysis (0)] |
| 6. | Tuli S, Basumatary N, Gill SS, Kahani M, Arya RC, Wander GS, Buyya R. HealthFog: An ensemble deep learning based Smart Healthcare System for Automatic Diagnosis of Heart Diseases in integrated IoT and fog computing environments. Future Generation Computer Systems. 2020;104:187-200. [DOI] [Full Text] |
| 7. | Dami S, Hatamchuri Z. Breast Cancer Prediction Using the Affinity Propagation Clustering with Regard to the Weights of Variables. Engineering Management and Soft Computing. 2018;4:27-39. [DOI] [Full Text] |
| 8. | Ilmudeen A. Design and development of IoT-based decision support system for dengue analysis and prediction: case study on Sri Lankan context. In: Healthcare Paradigms in the Internet of Things Ecosystem. Academic Press, 2021: 363-380. [DOI] [Full Text] |
| 9. | Ali F, Islam SR, Kwak D, Khan P, Ullah N, Yoo SJ, Kwak KS. Type-2 fuzzy ontology–aided recommendation systems for IoT–based healthcare. Comput Commun. 2018;119:138-155. [DOI] [Full Text] |
| 10. | Dami S, Yahaghizadeh M. Efficient event prediction in an IOT environment based on LDA model and support vector machine. In: 2018 6th Iranian Joint Congress on Fuzzy and Intelligent Systems (CFIS). IEEE, 2018: 135-138. [DOI] [Full Text] |
| 11. | Al-Turjman F. Intelligence and security in big 5G-oriented IoNT: An overview. Future Generation Computer Systems. 2020;102:357-368. [DOI] [Full Text] |
| 12. | Asghari P, Rahmani AM, Haj Seyyed Javadi H. A medical monitoring scheme and health‐medical service composition model in cloud‐based IoT platform. Transactions on Emerging Telecommunications Technologies. 2019;30:e3637. [DOI] [Full Text] |
| 13. | Hosseinzadeh M, Koohpayehzadeh J, Bali AO, Asghari P, Souri A, Mazaherinezhad A, Bohlouli M, Rawassizadeh R. A diagnostic prediction model for chronic kidney disease in internet of things platform. Multimedia Tools and Applications. 2021;80:16933-16950. [DOI] [Full Text] |
| 14. | Dami S, Yahaghizadeh M. Predicting cardiovascular events with deep learning approach in the context of the internet of things. Neural Comput Appl. 2021;1-8. [RCA] [DOI] [Full Text] [Cited by in Crossref: 6] [Cited by in RCA: 14] [Article Influence: 3.5] [Reference Citation Analysis (0)] |
| 15. | Moghadas E, Rezazadeh J, Farahbakhsh R. An IoT patient monitoring based on fog computing and data mining: Cardiac arrhythmia usecase. Internet of Things. 2020;11:100251. [DOI] [Full Text] |
| 16. | Ahmed F. An Internet of Things (IoT) application for predicting the quantity of future heart attack patients. Int J Comput Appl. 2017;164:36-40. [DOI] [Full Text] |
| 17. | Banuleasa S, Munteanu R, Rusu A, Tonţ G. IoT system for monitoring vital signs of elderly population. In: 2016 International Conference and Exposition on Electrical and Power Engineering (EPE). IEEE, 2016: 059-064. [DOI] [Full Text] |
| 18. | Awotunde JB, Jimoh RG, AbdulRaheem M, Oladipo ID, Folorunso SO, Ajamu GJ. IoT-based wearable body sensor network for COVID-19 pandemic. In: Advances in Data Science and Intelligent Data Communication Technologies for COVID-19. Switzerland: Springer, 2022: 253-275. [DOI] [Full Text] |
| 19. | Filho IMB, Aquino G, Malaquias RS, Girao G, Melo SRM. An IoT-Based Healthcare Platform for Patients in ICU Beds During the COVID-19 Outbreak. IEEE Access. 2021;9:27262-27277. [RCA] [PubMed] [DOI] [Full Text] [Cited by in Crossref: 42] [Cited by in RCA: 23] [Article Influence: 5.8] [Reference Citation Analysis (0)] |
| 20. | Khan MM, Mehnaz S, Shaha A, Nayem M, Bourouis S. IoT-Based Smart Health Monitoring System for COVID-19 Patients. Comput Math Methods Med. 2021;2021:8591036. [RCA] [PubMed] [DOI] [Full Text] [Full Text (PDF)] [Cited by in Crossref: 49] [Cited by in RCA: 12] [Article Influence: 3.0] [Reference Citation Analysis (0)] |
| 21. | Ganguly K, Karmakar A, Banerjee PS. ValveCare: A Fuzzy Based Intelligent Model for Predicting Heart Diseases Using Arduino Based IoT Infrastructure. In: International Conference on Computational Intelligence in Communications and Business Analytics. Springer, 2021: 229-242. [DOI] [Full Text] |
| 22. | Jijesh JJ. A Supervised Learning Based Decision Support System for Multi-Sensor Healthcare Data from Wireless Body Sensor Networks. Wirel Pers Commun. 2021;116:1795-1813. [DOI] [Full Text] |
| 23. | Wu X, Liu C, Wang L, Bilal M. Internet of things-enabled real-time health monitoring system using deep learning. Neural Comput Appl. 2021;1-12. [RCA] [PubMed] [DOI] [Full Text] [Full Text (PDF)] [Cited by in Crossref: 16] [Cited by in RCA: 8] [Article Influence: 2.0] [Reference Citation Analysis (0)] |
| 24. | Yeh LR, Chen WC, Chan HY, Lu NH, Wang CY, Twan WH, Du WC, Huang YH, Hsu SY, Chen TB. Integrating ECG Monitoring and Classification via IoT and Deep Neural Networks. Biosensors (Basel). 2021;11. [RCA] [PubMed] [DOI] [Full Text] [Full Text (PDF)] [Cited by in Crossref: 7] [Cited by in RCA: 8] [Article Influence: 2.0] [Reference Citation Analysis (0)] |
| 25. | Su YS, Ding TJ, Chen MY. Deep learning methods in internet of medical things for valvular heart disease screening system. IEEE Internet Things J. 2021;. [DOI] [Full Text] |
| 26. | Dai H, Hwang HG, Tseng VS. Convolutional neural network based automatic screening tool for cardiovascular diseases using different intervals of ECG signals. Comput Methods Programs Biomed. 2021;203:106035. [RCA] [PubMed] [DOI] [Full Text] [Cited by in Crossref: 20] [Cited by in RCA: 26] [Article Influence: 6.5] [Reference Citation Analysis (0)] |
| 27. | Tan L, Yu K, Bashir AK, Cheng X, Ming F, Zhao L, Zhou X. Toward real-time and efficient cardiovascular monitoring for COVID-19 patients by 5G-enabled wearable medical devices: a deep learning approach. Neural Comput Appl. 2021;1-14. [RCA] [PubMed] [DOI] [Full Text] [Full Text (PDF)] [Cited by in Crossref: 55] [Cited by in RCA: 41] [Article Influence: 10.3] [Reference Citation Analysis (0)] |
| 28. | Manogaran G, Varatharajan R, Lopez D, Kumar PM, Sundarasekar R, Thota C. A new architecture of Internet of Things and big data ecosystem for secured smart healthcare monitoring and alerting system. Future Generation Computer Systems. 2018;82:375-387. [DOI] [Full Text] |
| 29. | Ebrahimzadeh E, Pooyan M, Bijar A. A novel approach to predict sudden cardiac death (SCD) using nonlinear and time-frequency analyses from HRV signals. PLoS One. 2014;9:e81896. [RCA] [PubMed] [DOI] [Full Text] [Full Text (PDF)] [Cited by in Crossref: 104] [Cited by in RCA: 61] [Article Influence: 5.5] [Reference Citation Analysis (0)] |
| 30. | Khan MA. An IoT framework for heart disease prediction based on MDCNN classifier. IEEE Access. 2020;8:34717-34727. [DOI] [Full Text] |
| 31. | Srinivas P, Katarya R. hyOPTXg: OPTUNA hyper-parameter optimization framework for predicting cardiovascular disease using XGBoost. Biomed Signal Process Control. 2022;73:103456. [RCA] [DOI] [Full Text] [Cited by in Crossref: 7] [Cited by in RCA: 26] [Article Influence: 8.7] [Reference Citation Analysis (0)] |
| 32. | Dami S, Esterabi M. Predicting stock returns of Tehran exchange using LSTM neural network and feature engineering technique. Multimed Tools Appl. 2021;80:19947-19970. [DOI] [Full Text] |