Copyright
©The Author(s) 2020.
World J Clin Cases. Oct 6, 2020; 8(19): 4431-4442
Published online Oct 6, 2020. doi: 10.12998/wjcc.v8.i19.4431
Published online Oct 6, 2020. doi: 10.12998/wjcc.v8.i19.4431
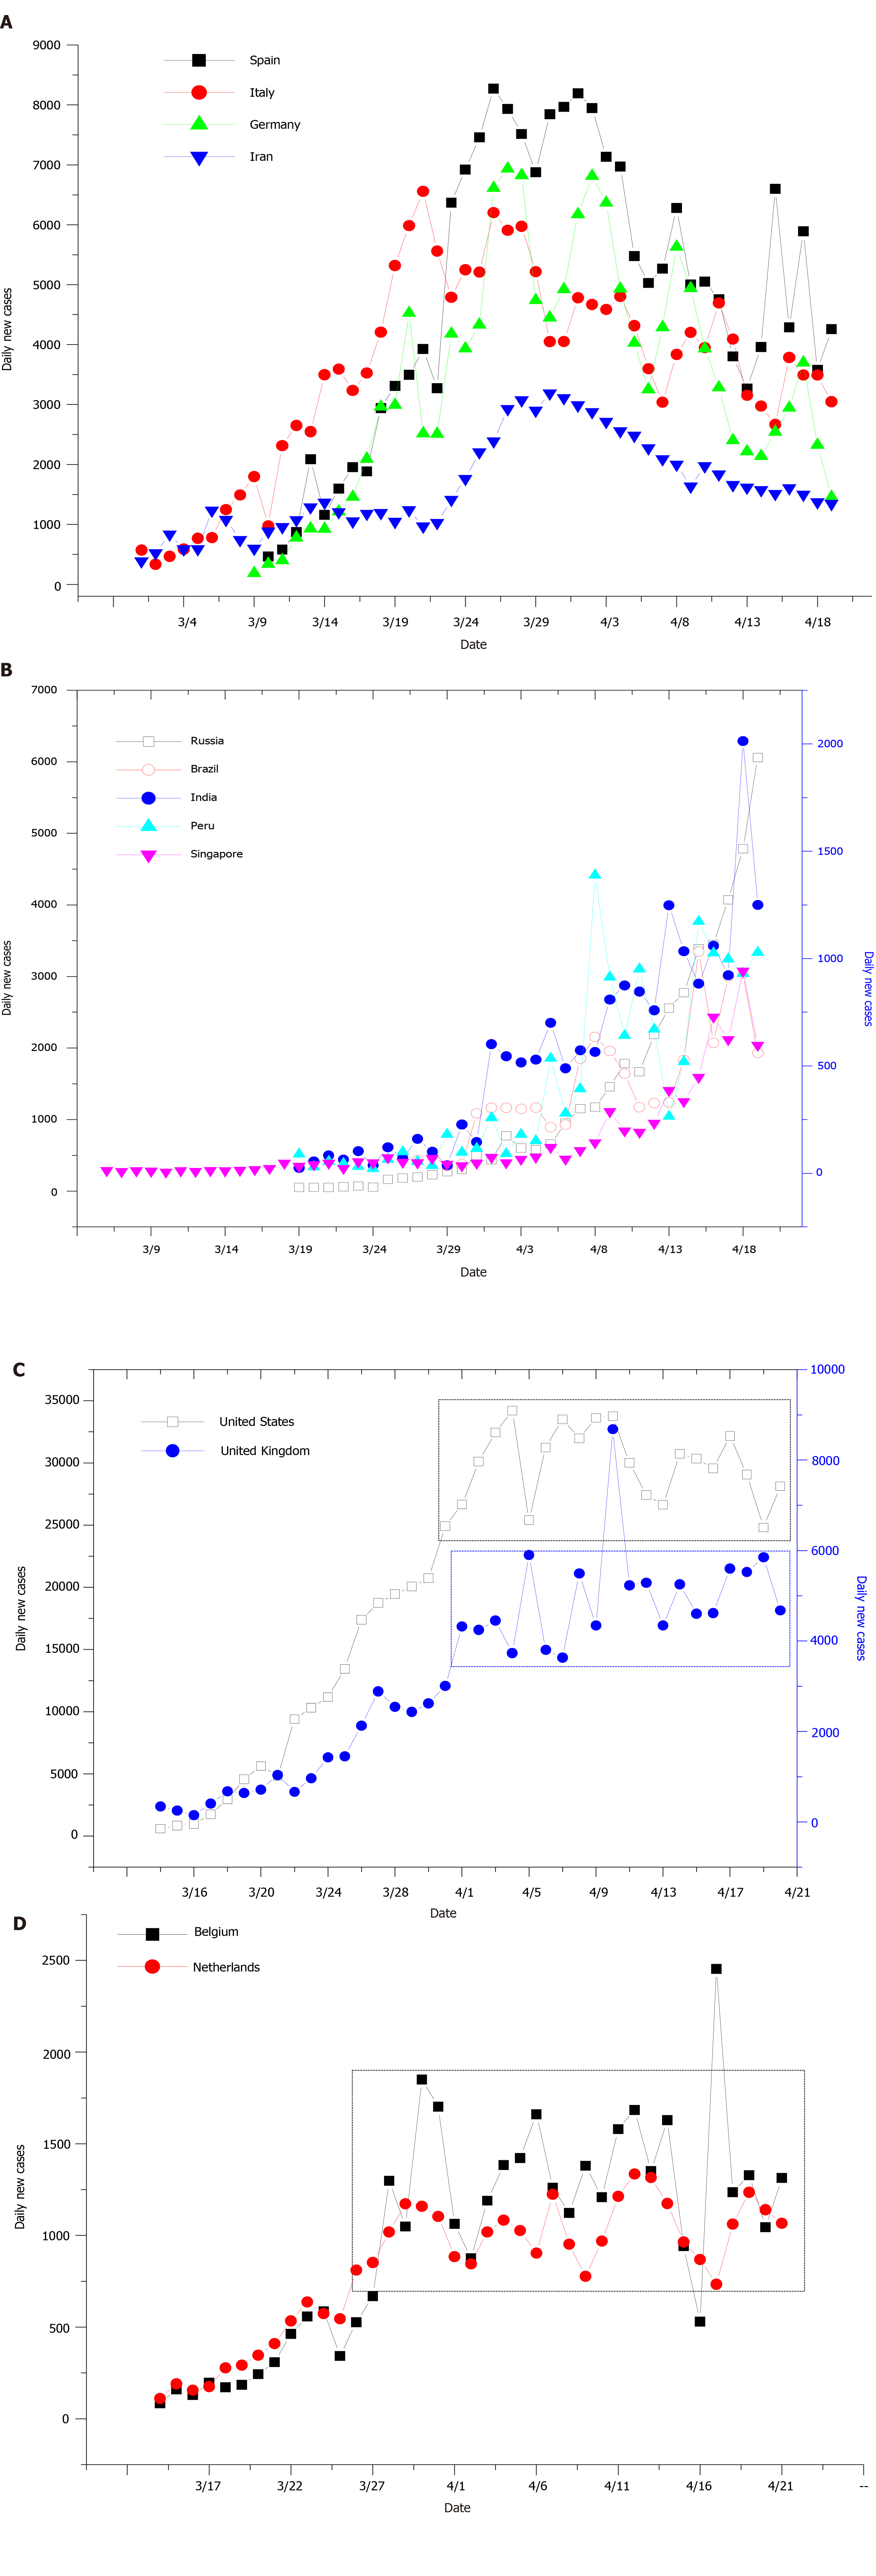
Figure 1 Daily new cases in typical downward, upward, and static-phase countries over time.
A-D: Daily new cases in typical downward (panel A), upward (panel B), and static-phase countries (panels C and D). Other countries of each type are shown in Figure S1, S2, and S4, respectively. Data (as of April 19, 2020) were collected from Worldometer[1]. For each country, the starting date was set when the cumulative confirmed cases reached 1% of the current cumulative ones as of April 19, 2020. Dotted windows in panels C and D show the period (over 14 d) with invariable daily new cases. Results of other countries in these categories are shown in Figures S1, S2, and S4.
Figure 2 Comparative analyses of coronavirus disease 2019 tests between downward and static-phase countries.
A-C: Difference analysis of case density (panel A), testing density (panel B), and level of positive coronavirus disease 2019 (COVID-19) tests (panel C) among the four types of countries. Data of each type of countries are plotted as the mean ± SD with 95% confidence interval (in the box), with median being shown as short lines. Statistics were analyzed using Microcal Origin software with ANOVA algorithm, and significance levels (P value) are designated. P values less than 0.05 are colored in red; D and E: Comparisons of time-dependent levels of testing density (panel A) and positive COVID-19 tests (panel B) between typical static-phase countries (United States and United Kingdom) and downward countries (South Korea and Italy). Data for the United States, Italy, and South Korea were collected from the Website of One World Data (URL: https://ourworldindata.org/grapher/full-list-cumulative-total-tests-per-thousand) and Data for United Kingdom from COVID-19 United Kingdom update (URL: https://covid19uk.live/#/).
- Citation: Long C, Fu XM, Fu ZF. Global analysis of daily new COVID-19 cases reveals many static-phase countries including the United States potentially with unstoppable epidemic. World J Clin Cases 2020; 8(19): 4431-4442
- URL: https://www.wjgnet.com/2307-8960/full/v8/i19/4431.htm
- DOI: https://dx.doi.org/10.12998/wjcc.v8.i19.4431


