Copyright
©The Author(s) 2020.
World J Clin Cases. Aug 6, 2020; 8(15): 3197-3208
Published online Aug 6, 2020. doi: 10.12998/wjcc.v8.i15.3197
Published online Aug 6, 2020. doi: 10.12998/wjcc.v8.i15.3197
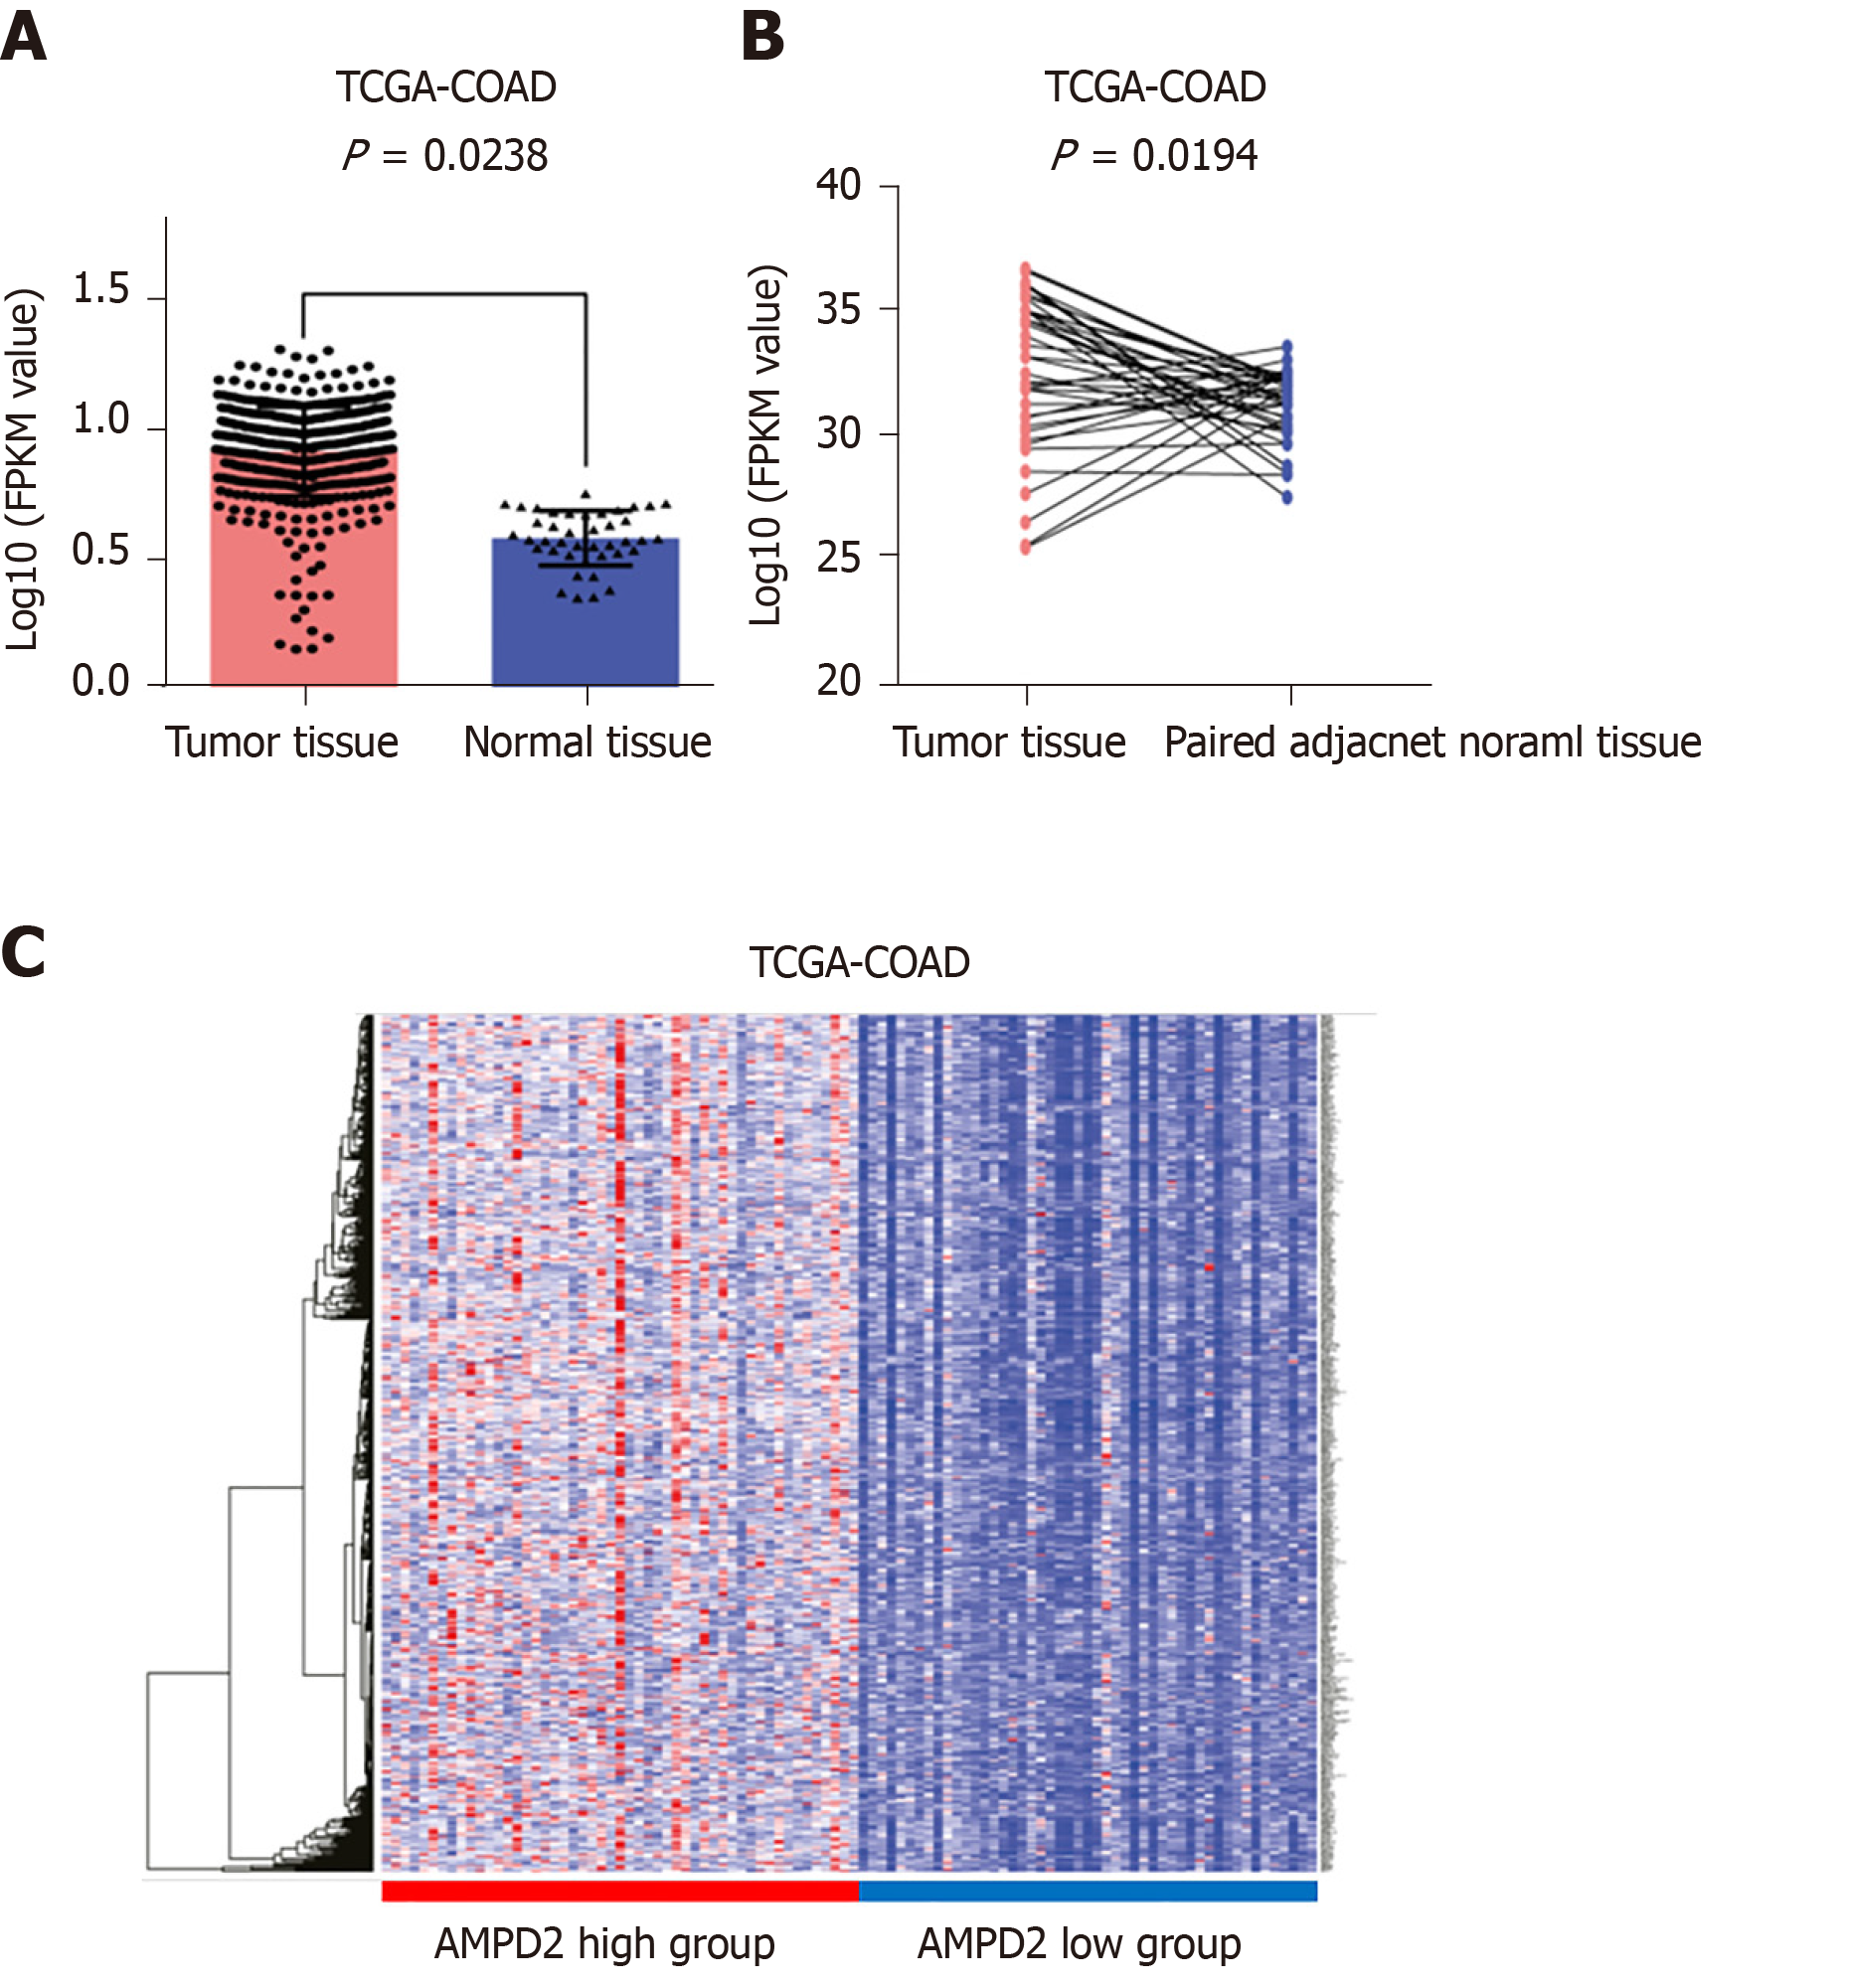
Figure 1 The expression level of AMPD2 in the TCGA-COAD data set.
A: The expression level of AMPD2 in cancer tissues and paracancerous tissues was determined by two independent samples t test, P < 0.05 was considered significant; B: In paired samples of cancer tissue and adjacent normal tissues, the AMPD2 expression level was determined by paired t-test, and P < 0.05 was considered significant; C: AMPD2-based high expression subgroup (50 cases) and low expression subgroup (50 cases) in cancer tissues. A heat map of the difference in gene expression was produced.
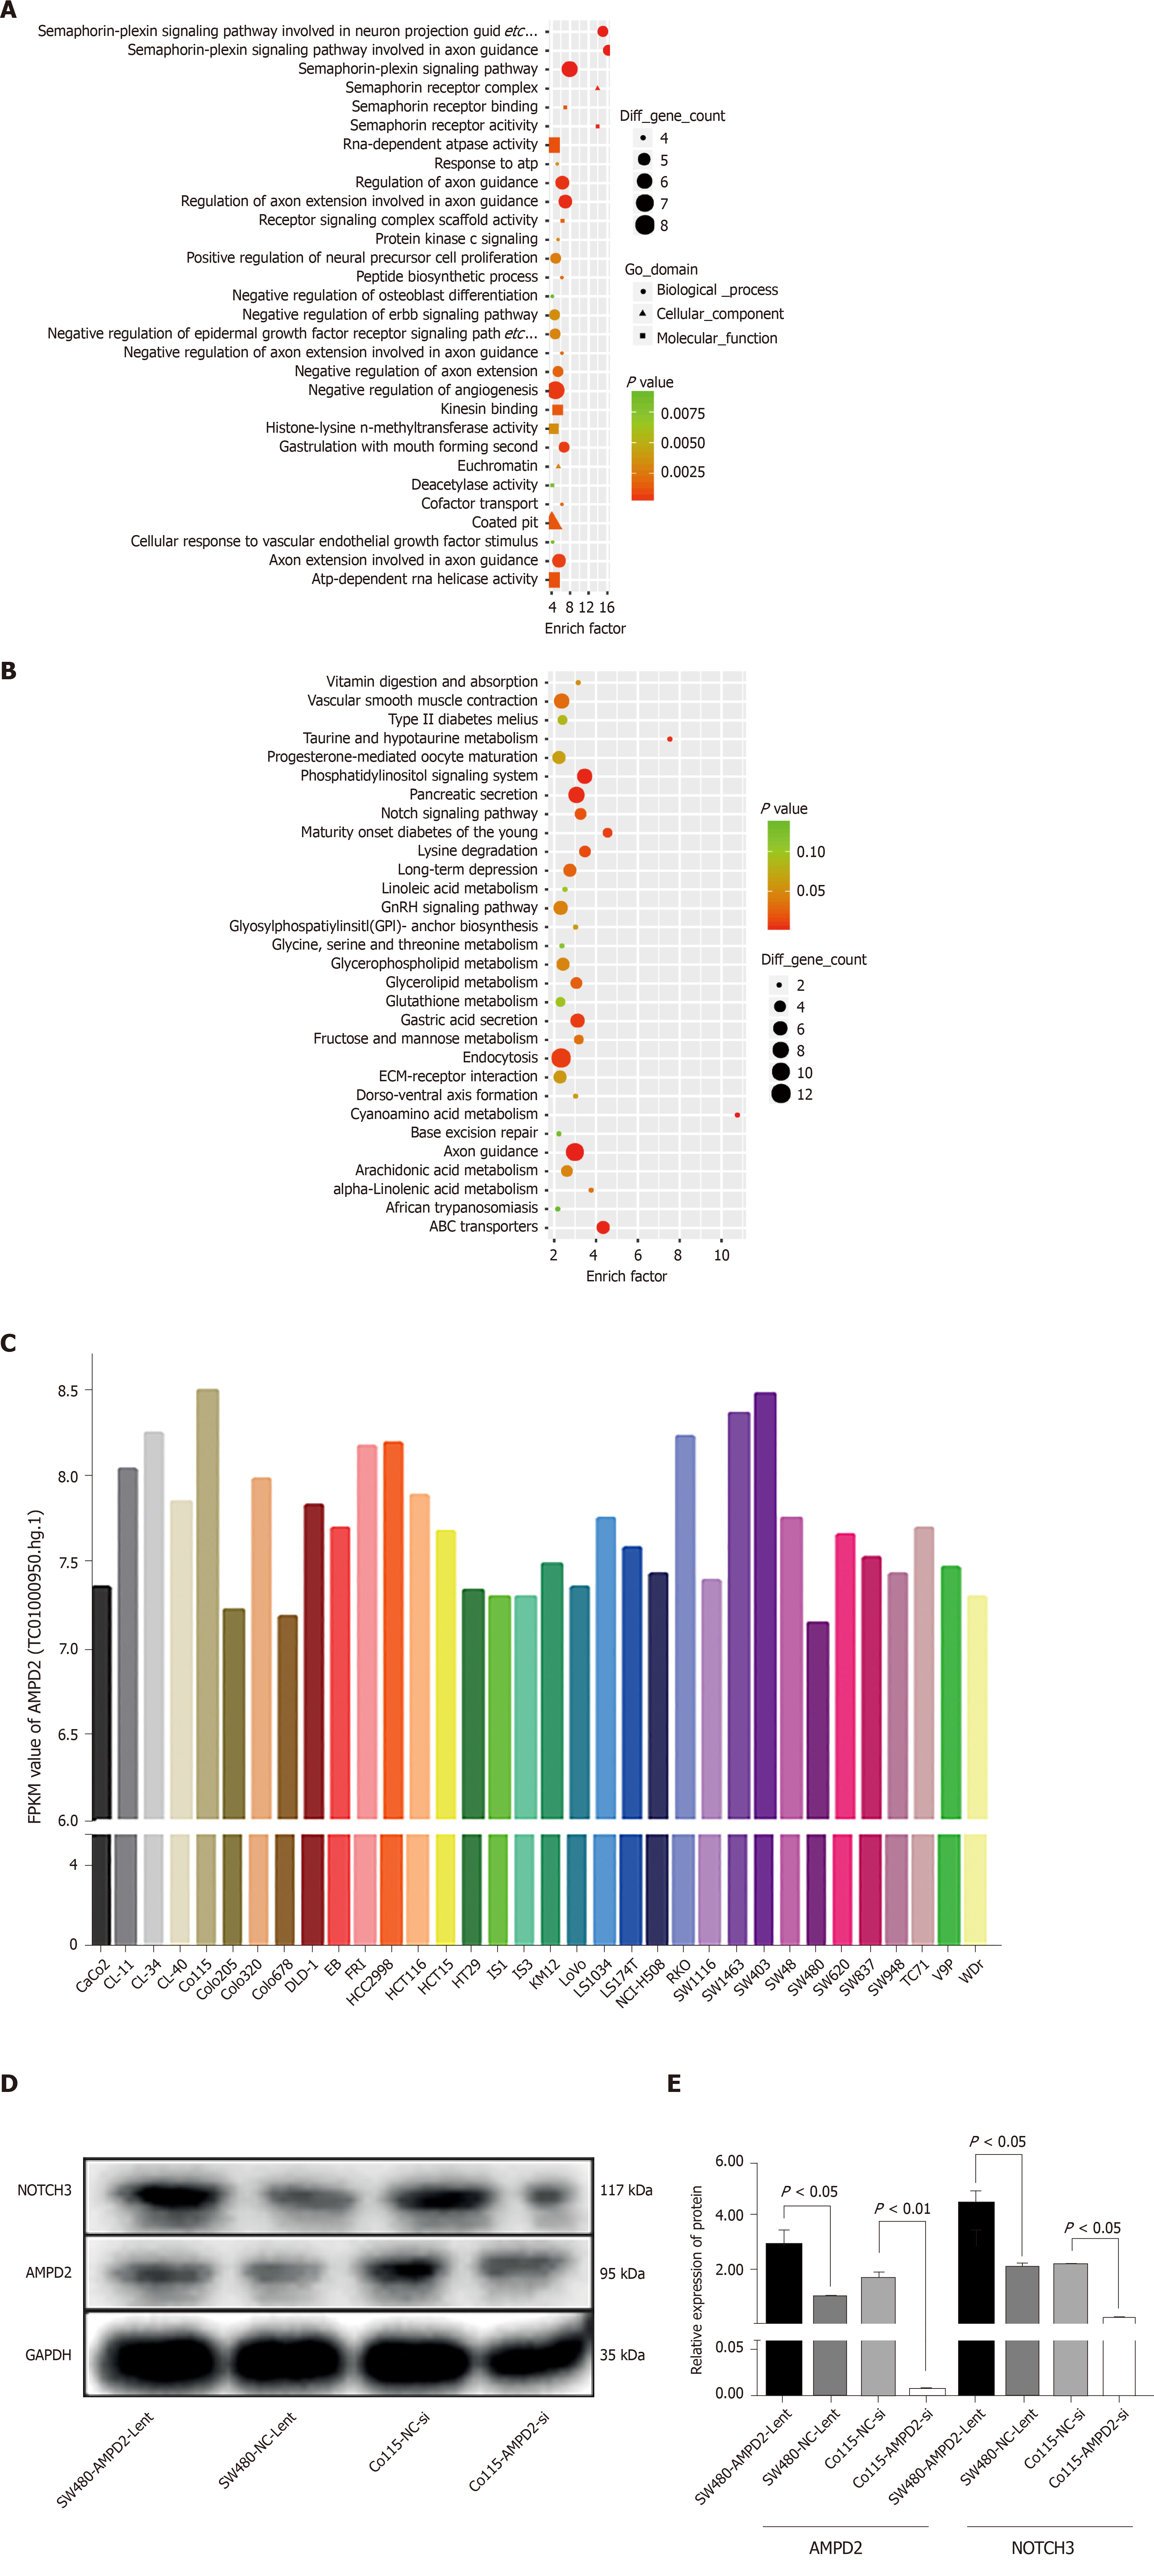
Figure 2 Functional enrichment analysis and western blot.
A and B: Based on AMPD2, a high expression subgroup (50 cases) and a low expression subgroup (50 cases) in cancer tissues were identified, and functional enrichment analysis of gene expression differences was performed using GO and KEGG maps; C: The expression of AMPD2 in various colorectal cancer cell lines was analyzed according to the GEO-GSE97023 data set; D and E: The Western blot results of up-regulation and down-regulation of AMPD2 in SW480 and Co115 cell lines, immunoblotting (D) and histogram (E).
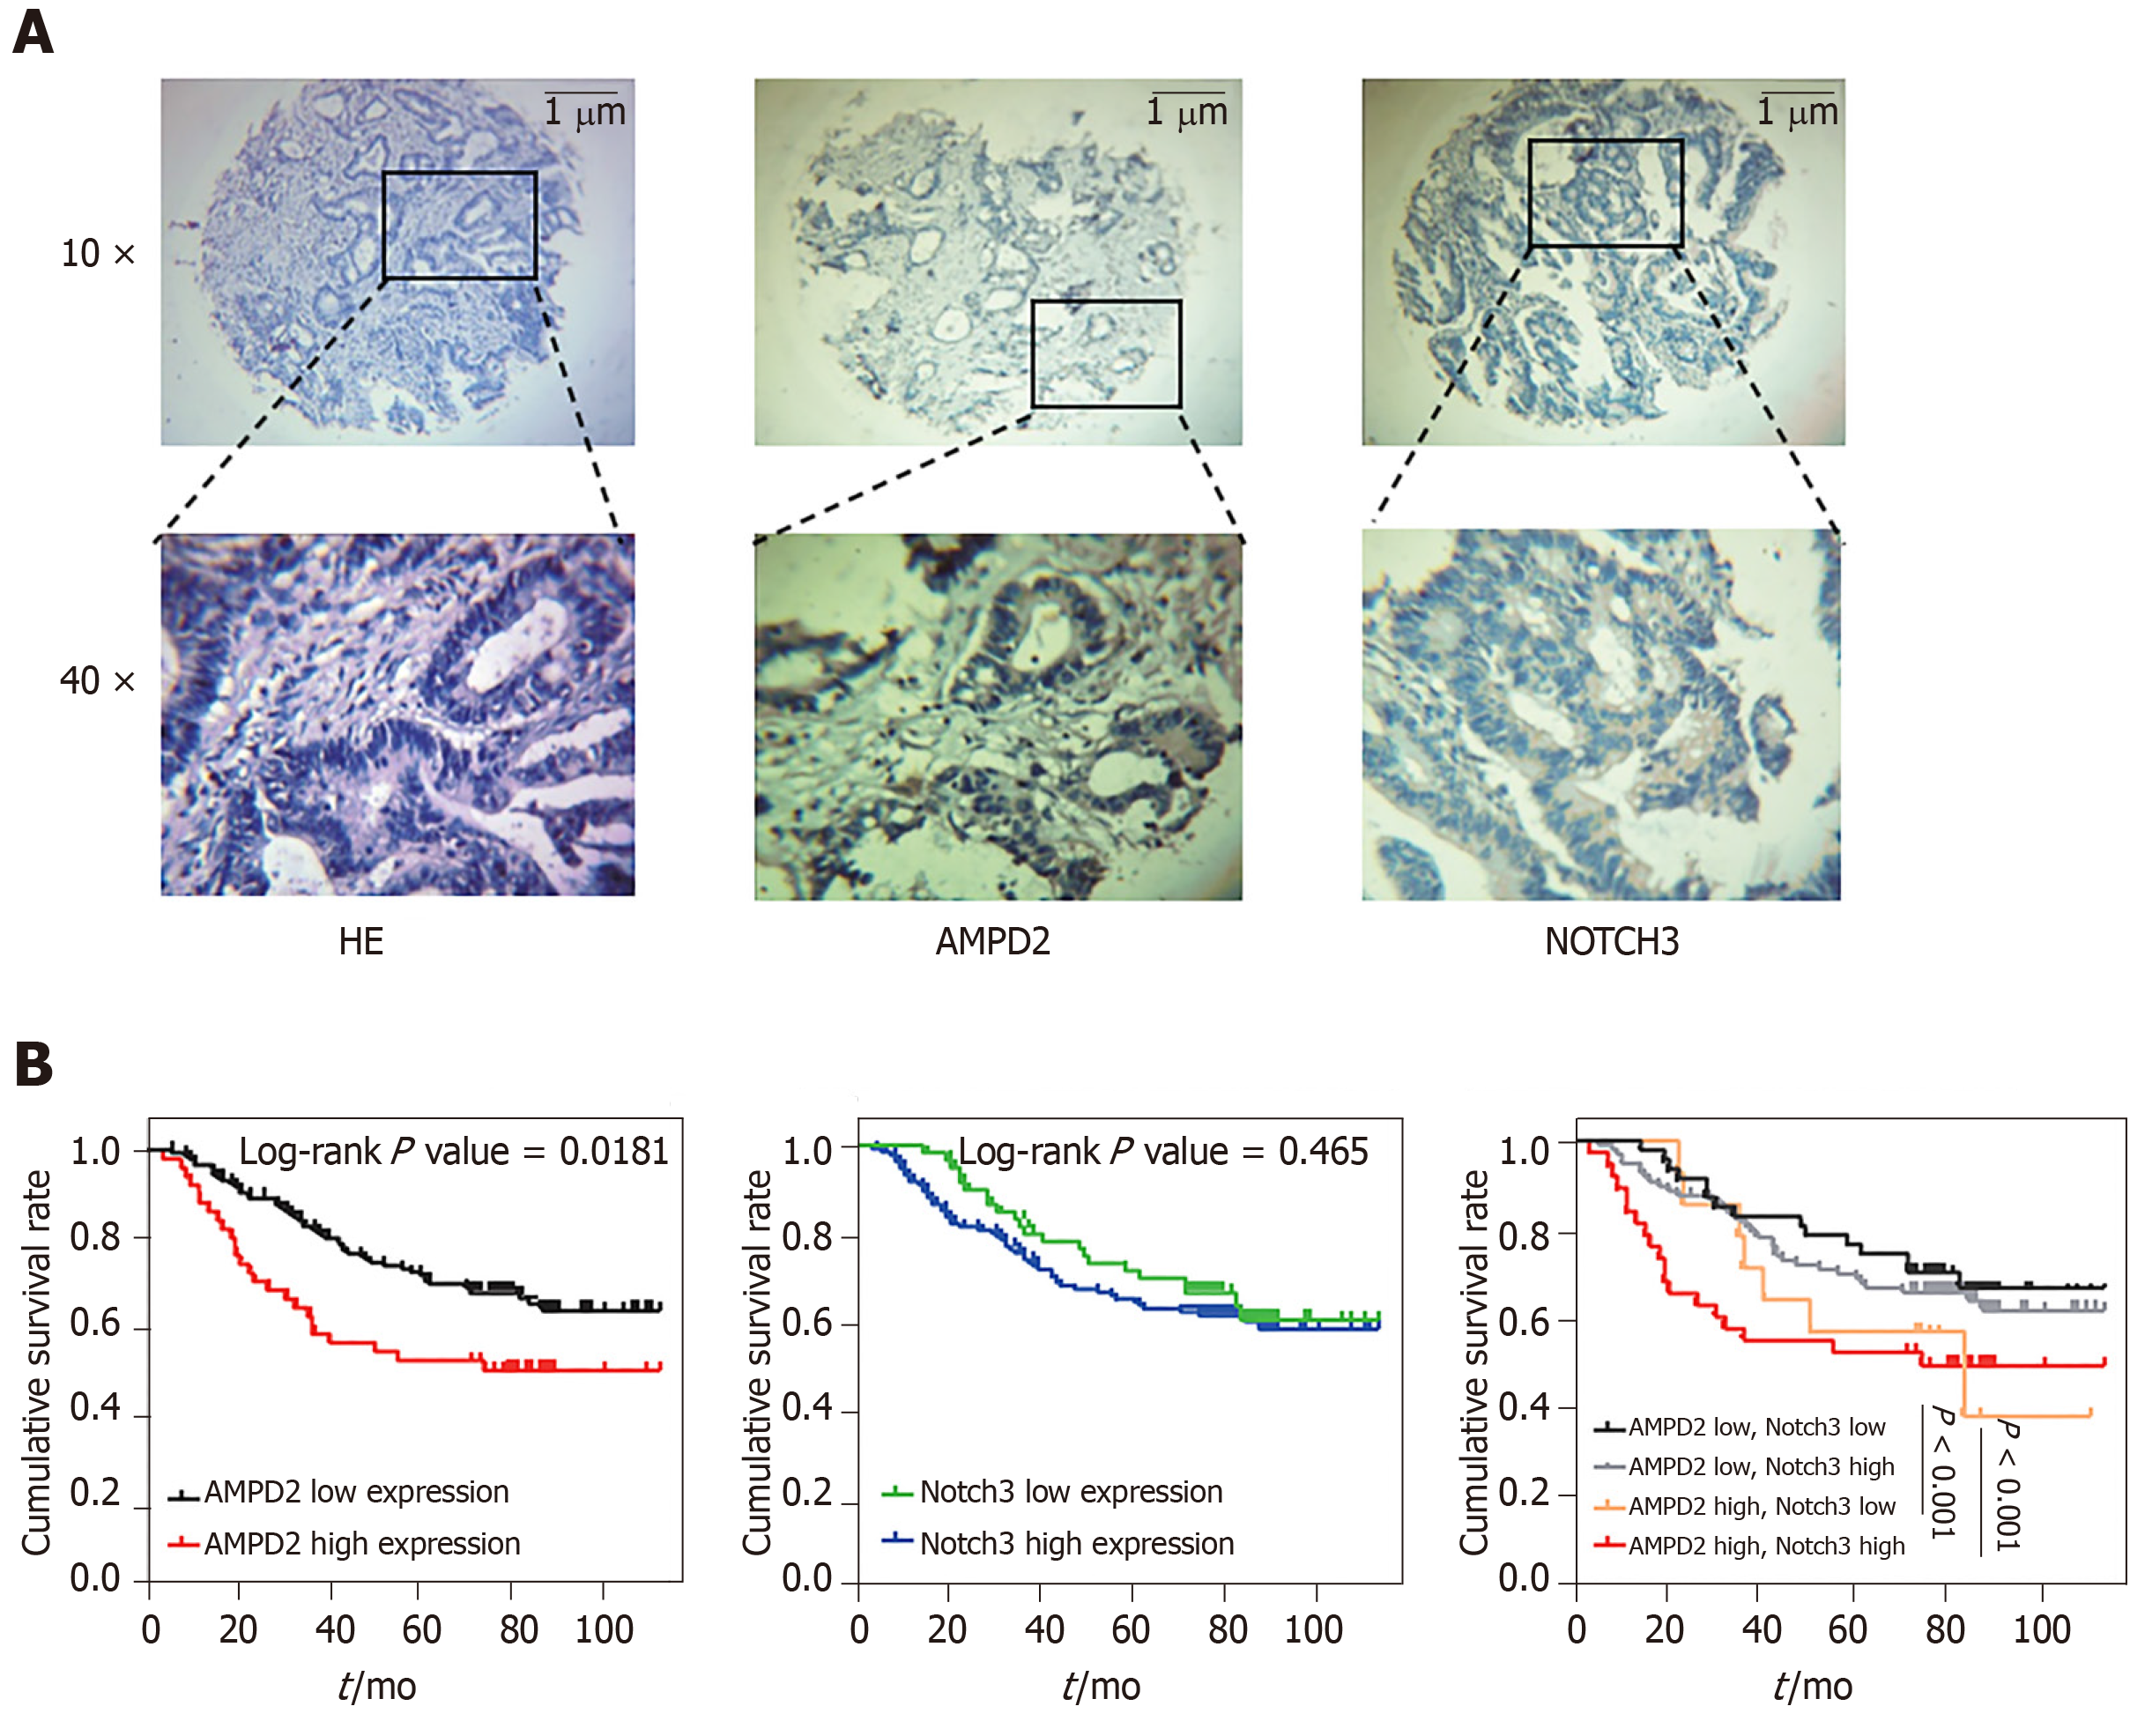
Figure 3 Immunohistochemical and Kaplan-Meier curves.
A: Tissue microarrays of hematoxylin and eosin stained sections. Representative immunohistochemical analysis of AMPD2 levels in colorectal tumor tissue specimens from cancer patients and in adjacent cancer-associated fibroblasts. Immunohistochemical results of Notch3 levels in the same tissues/cells. Photomicrographs of the sections (50 × and 200 × magnification); B: Kaplan-Meier curves showing the impact of AMPD2 expression on overall survival (OS) of 201 colorectal cancer patients (P = 0.0181). Kaplan-Meier curves showing the impact of Notch3 expression on the OS of 201 colorectal cancer patients (P = 0.465). Kaplan-Meier curves showing the impact of AMPD2 and Notch3 subgroup expression on the OS of 201 colorectal cancer patients (P < 0.001).
- Citation: Gao QZ, Qin Y, Wang WJ, Fei BJ, Han WF, Jin JQ, Gao X. Overexpression of AMPD2 indicates poor prognosis in colorectal cancer patients via the Notch3 signaling pathway. World J Clin Cases 2020; 8(15): 3197-3208
- URL: https://www.wjgnet.com/2307-8960/full/v8/i15/3197.htm
- DOI: https://dx.doi.org/10.12998/wjcc.v8.i15.3197


