Copyright
©The Author(s) 2019.
World J Clin Cases. Aug 26, 2019; 7(16): 2155-2164
Published online Aug 26, 2019. doi: 10.12998/wjcc.v7.i16.2155
Published online Aug 26, 2019. doi: 10.12998/wjcc.v7.i16.2155
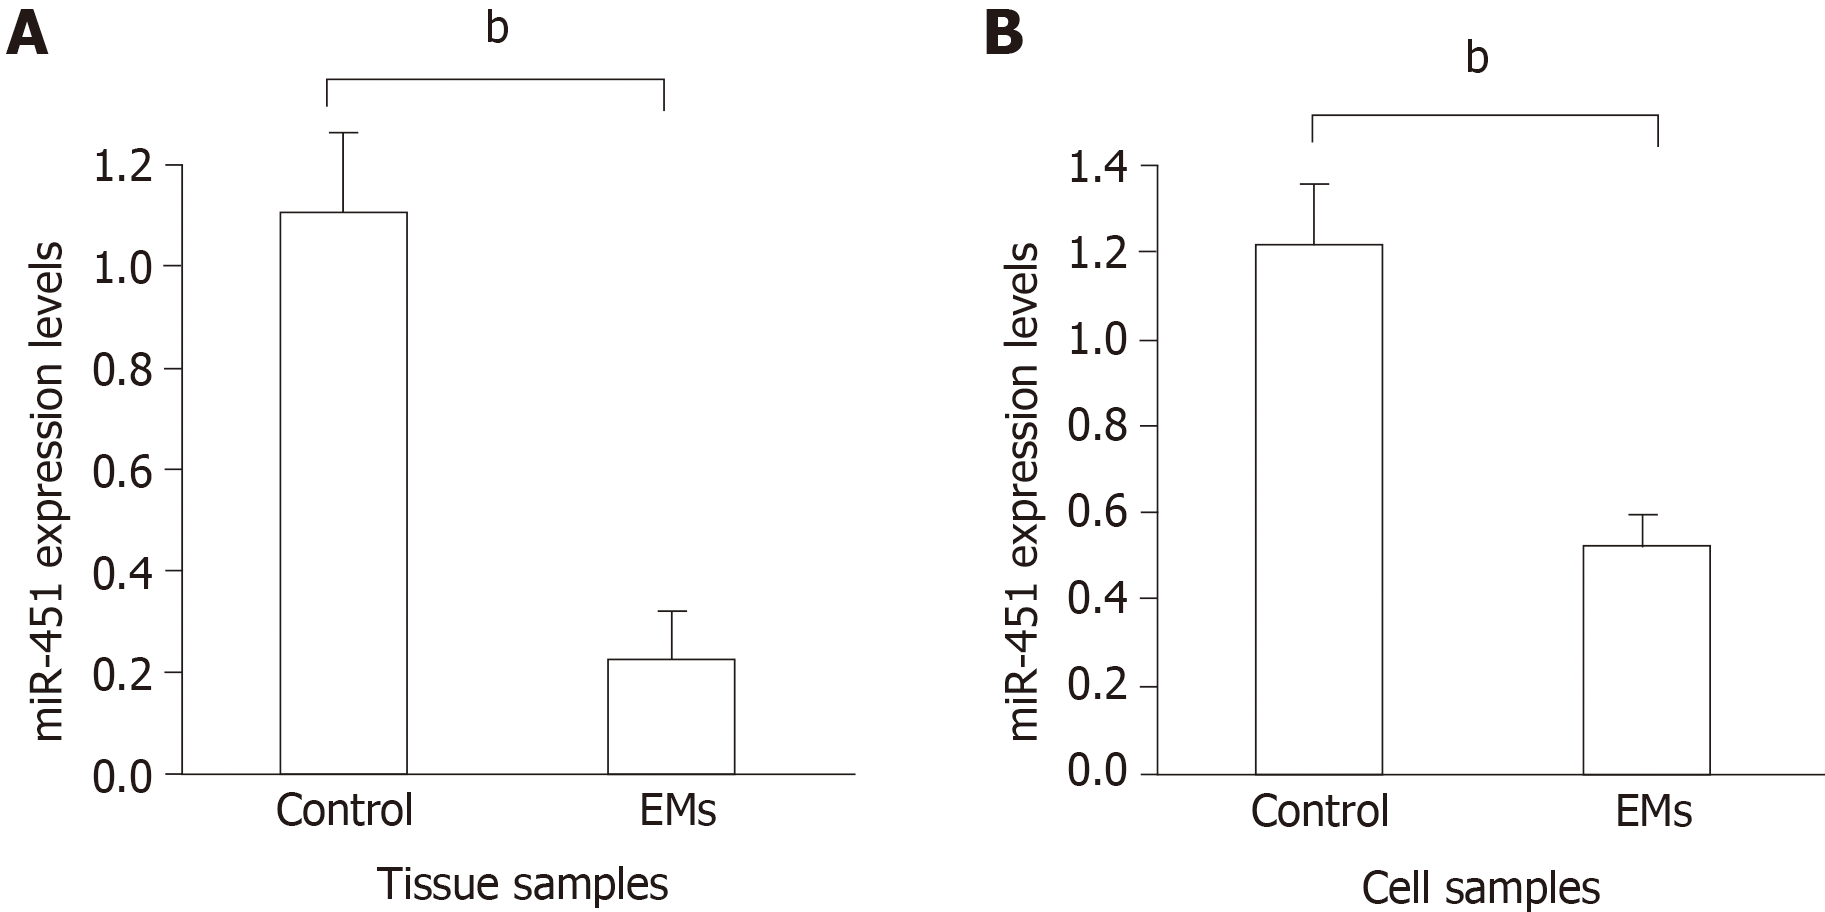
Figure 1 Expression of miR-451 in eutopic tissues and cell lines.
A: MiR-451 expression in eutopic tissues from endometriosis (EMs) and control groups was quantified using quantitative real-time PCR. Data are expressed as 2−ΔΔCt (mean ± SE, n = 4). bP < 0.01 vs control; B: Expression of miR-451 was compared between EMs and control cell lines. Data are expressed as 2−ΔΔCt (mean ± SEM, n = 4). bP < 0.01 vs control.
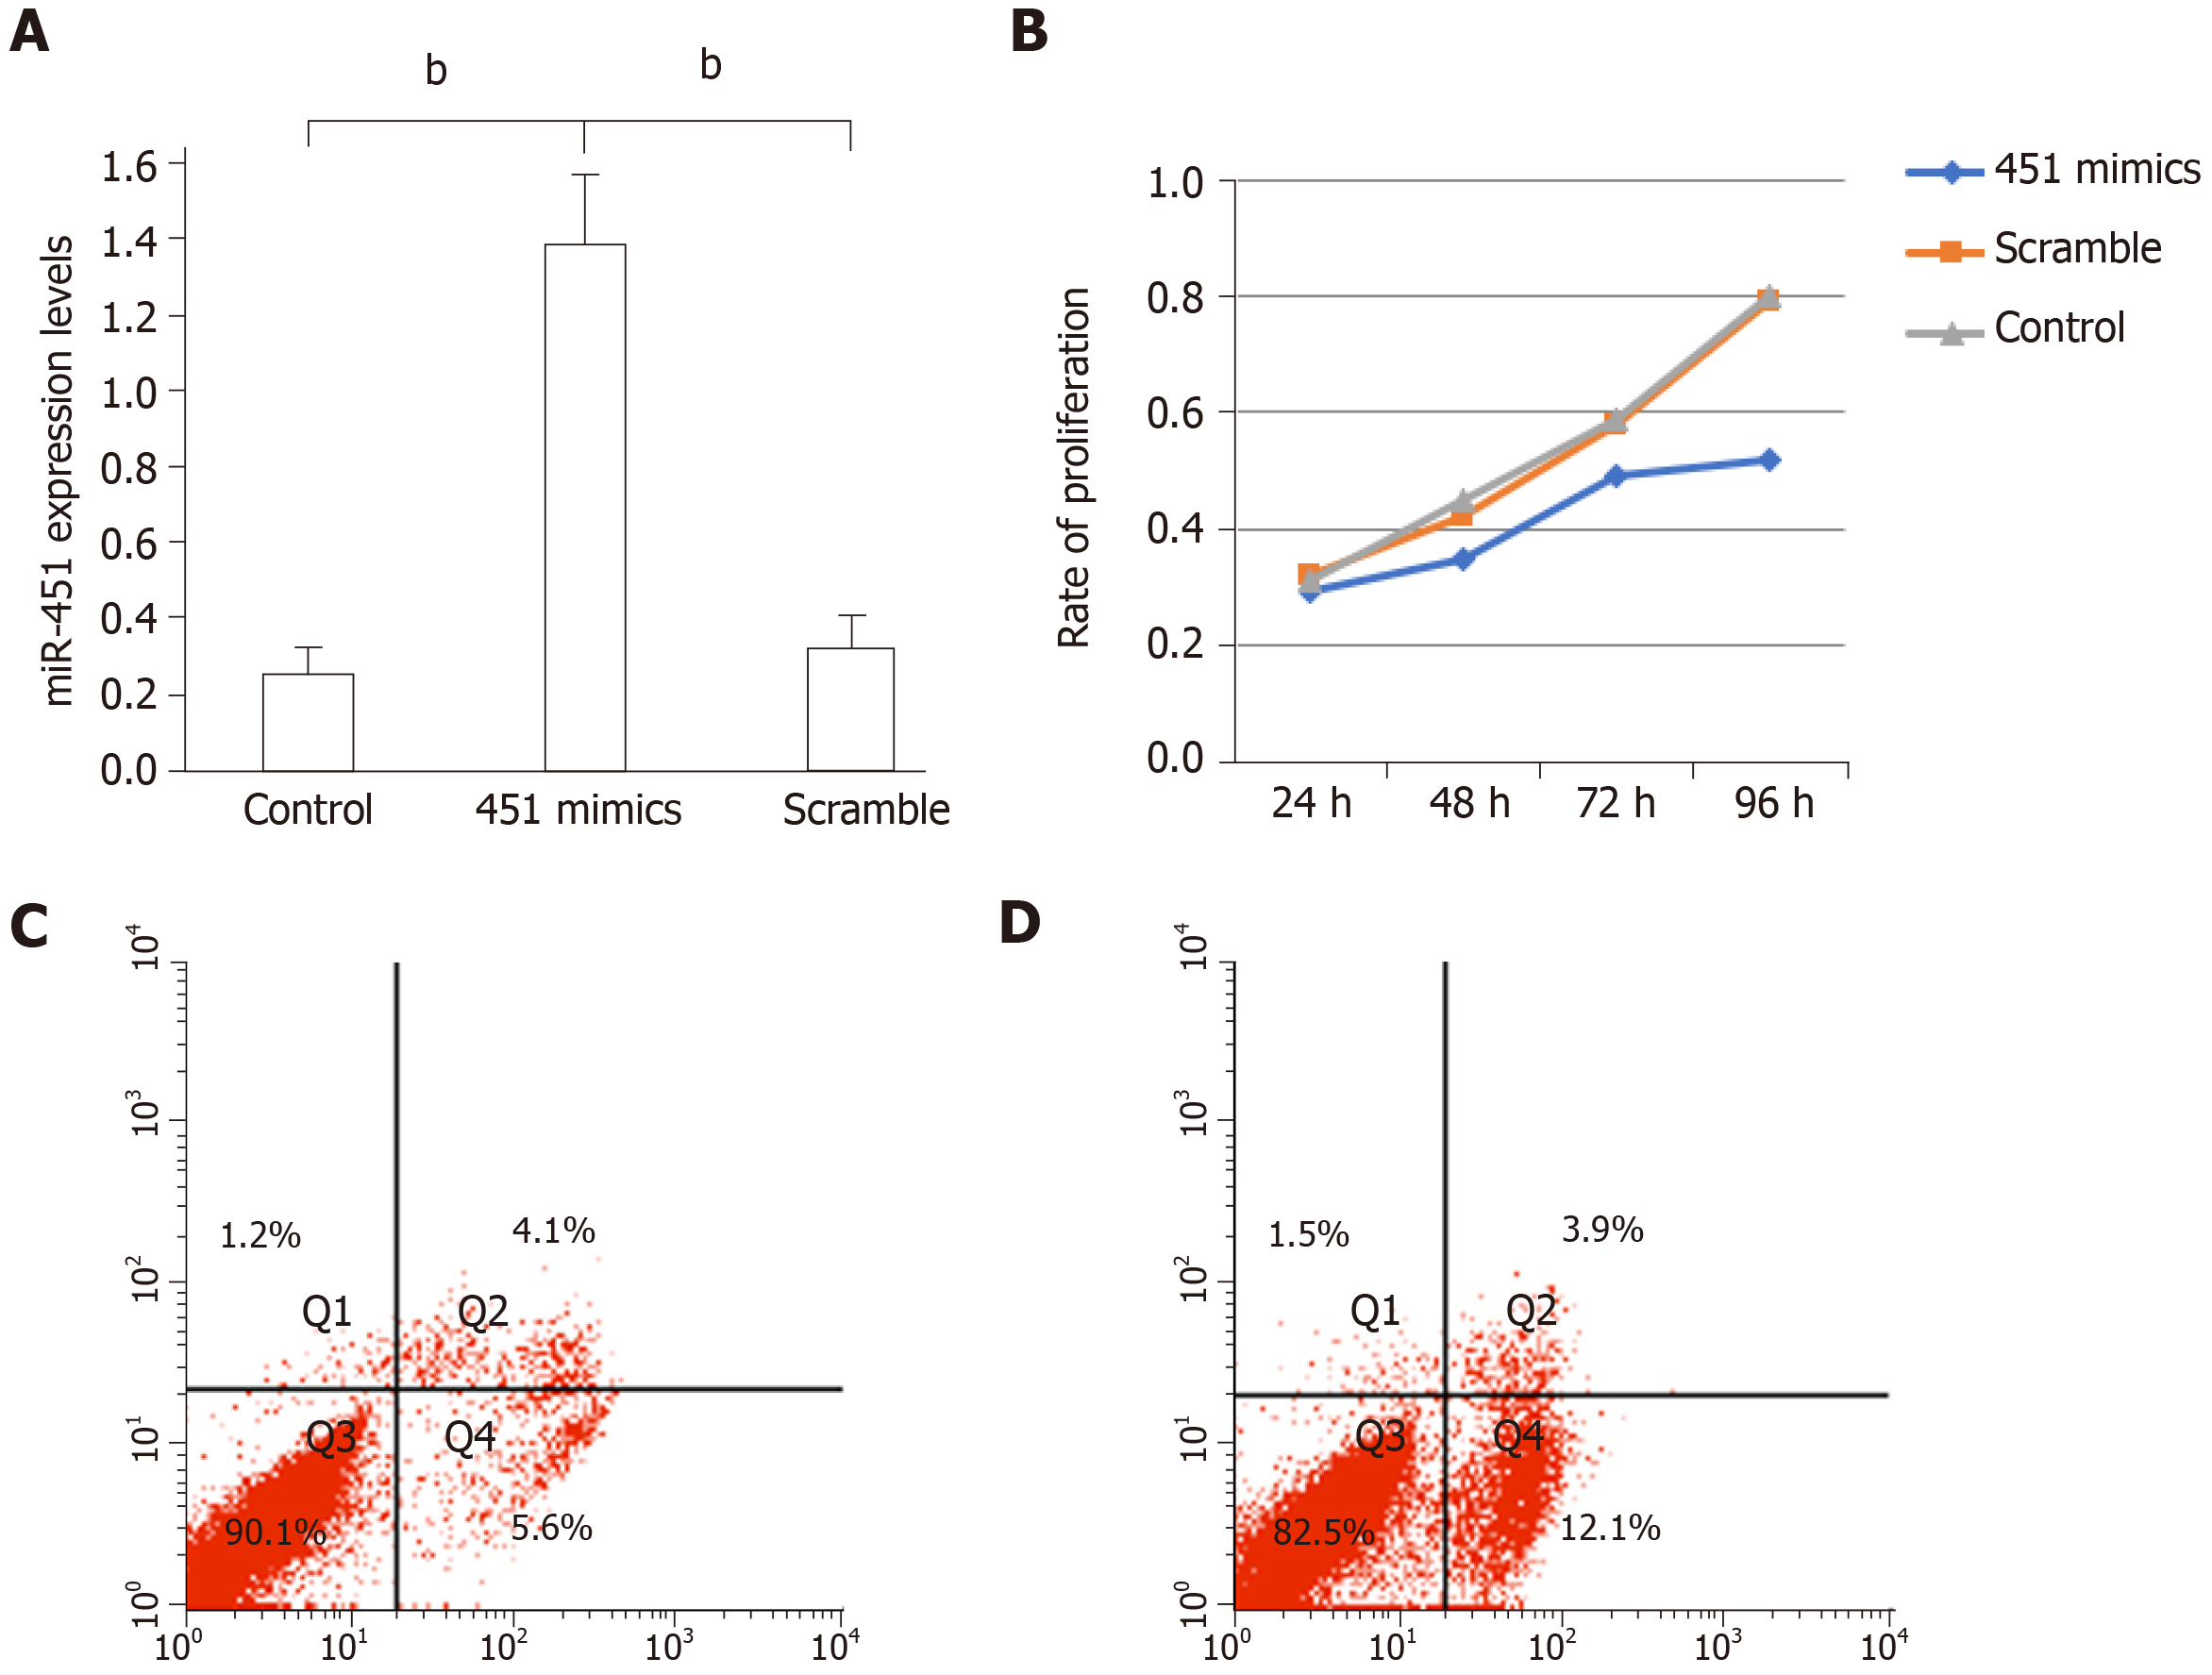
Figure 2 Transfection with miR-451 mimic inhibits cell proliferation by inducing the apoptosis of eutopic cells in endometriosis.
A: MiR-451 expression was significantly increased after transfection with miR-451 mimic. Data are expressed as 2−ΔΔCt (mean ± SEM, n = 4). bP < 0.01 vs control and scrambled; B: Cell Counting Kit-8 assays revealed a lower proliferation rate of cells transfected with miR-451 mimic compared to cells in the control and scrambled groups (aP < 0.05); C and D: Flow cytometric analysis of apoptosis in cells transfected with scrambled siRNA and miR-451 mimic, respectively. Cells are divided into four sections: Q1: Annexin V-FITC- PI+ represents mechanical error; Q2: Annexin V-FITC+ PI+ represents late apoptotic or necrotic cells; Q3: Annexin V-FITC- PI- represents non-apoptotic cells; Q4: Annexin V-FITC+ PI- represents early apoptotic cells.
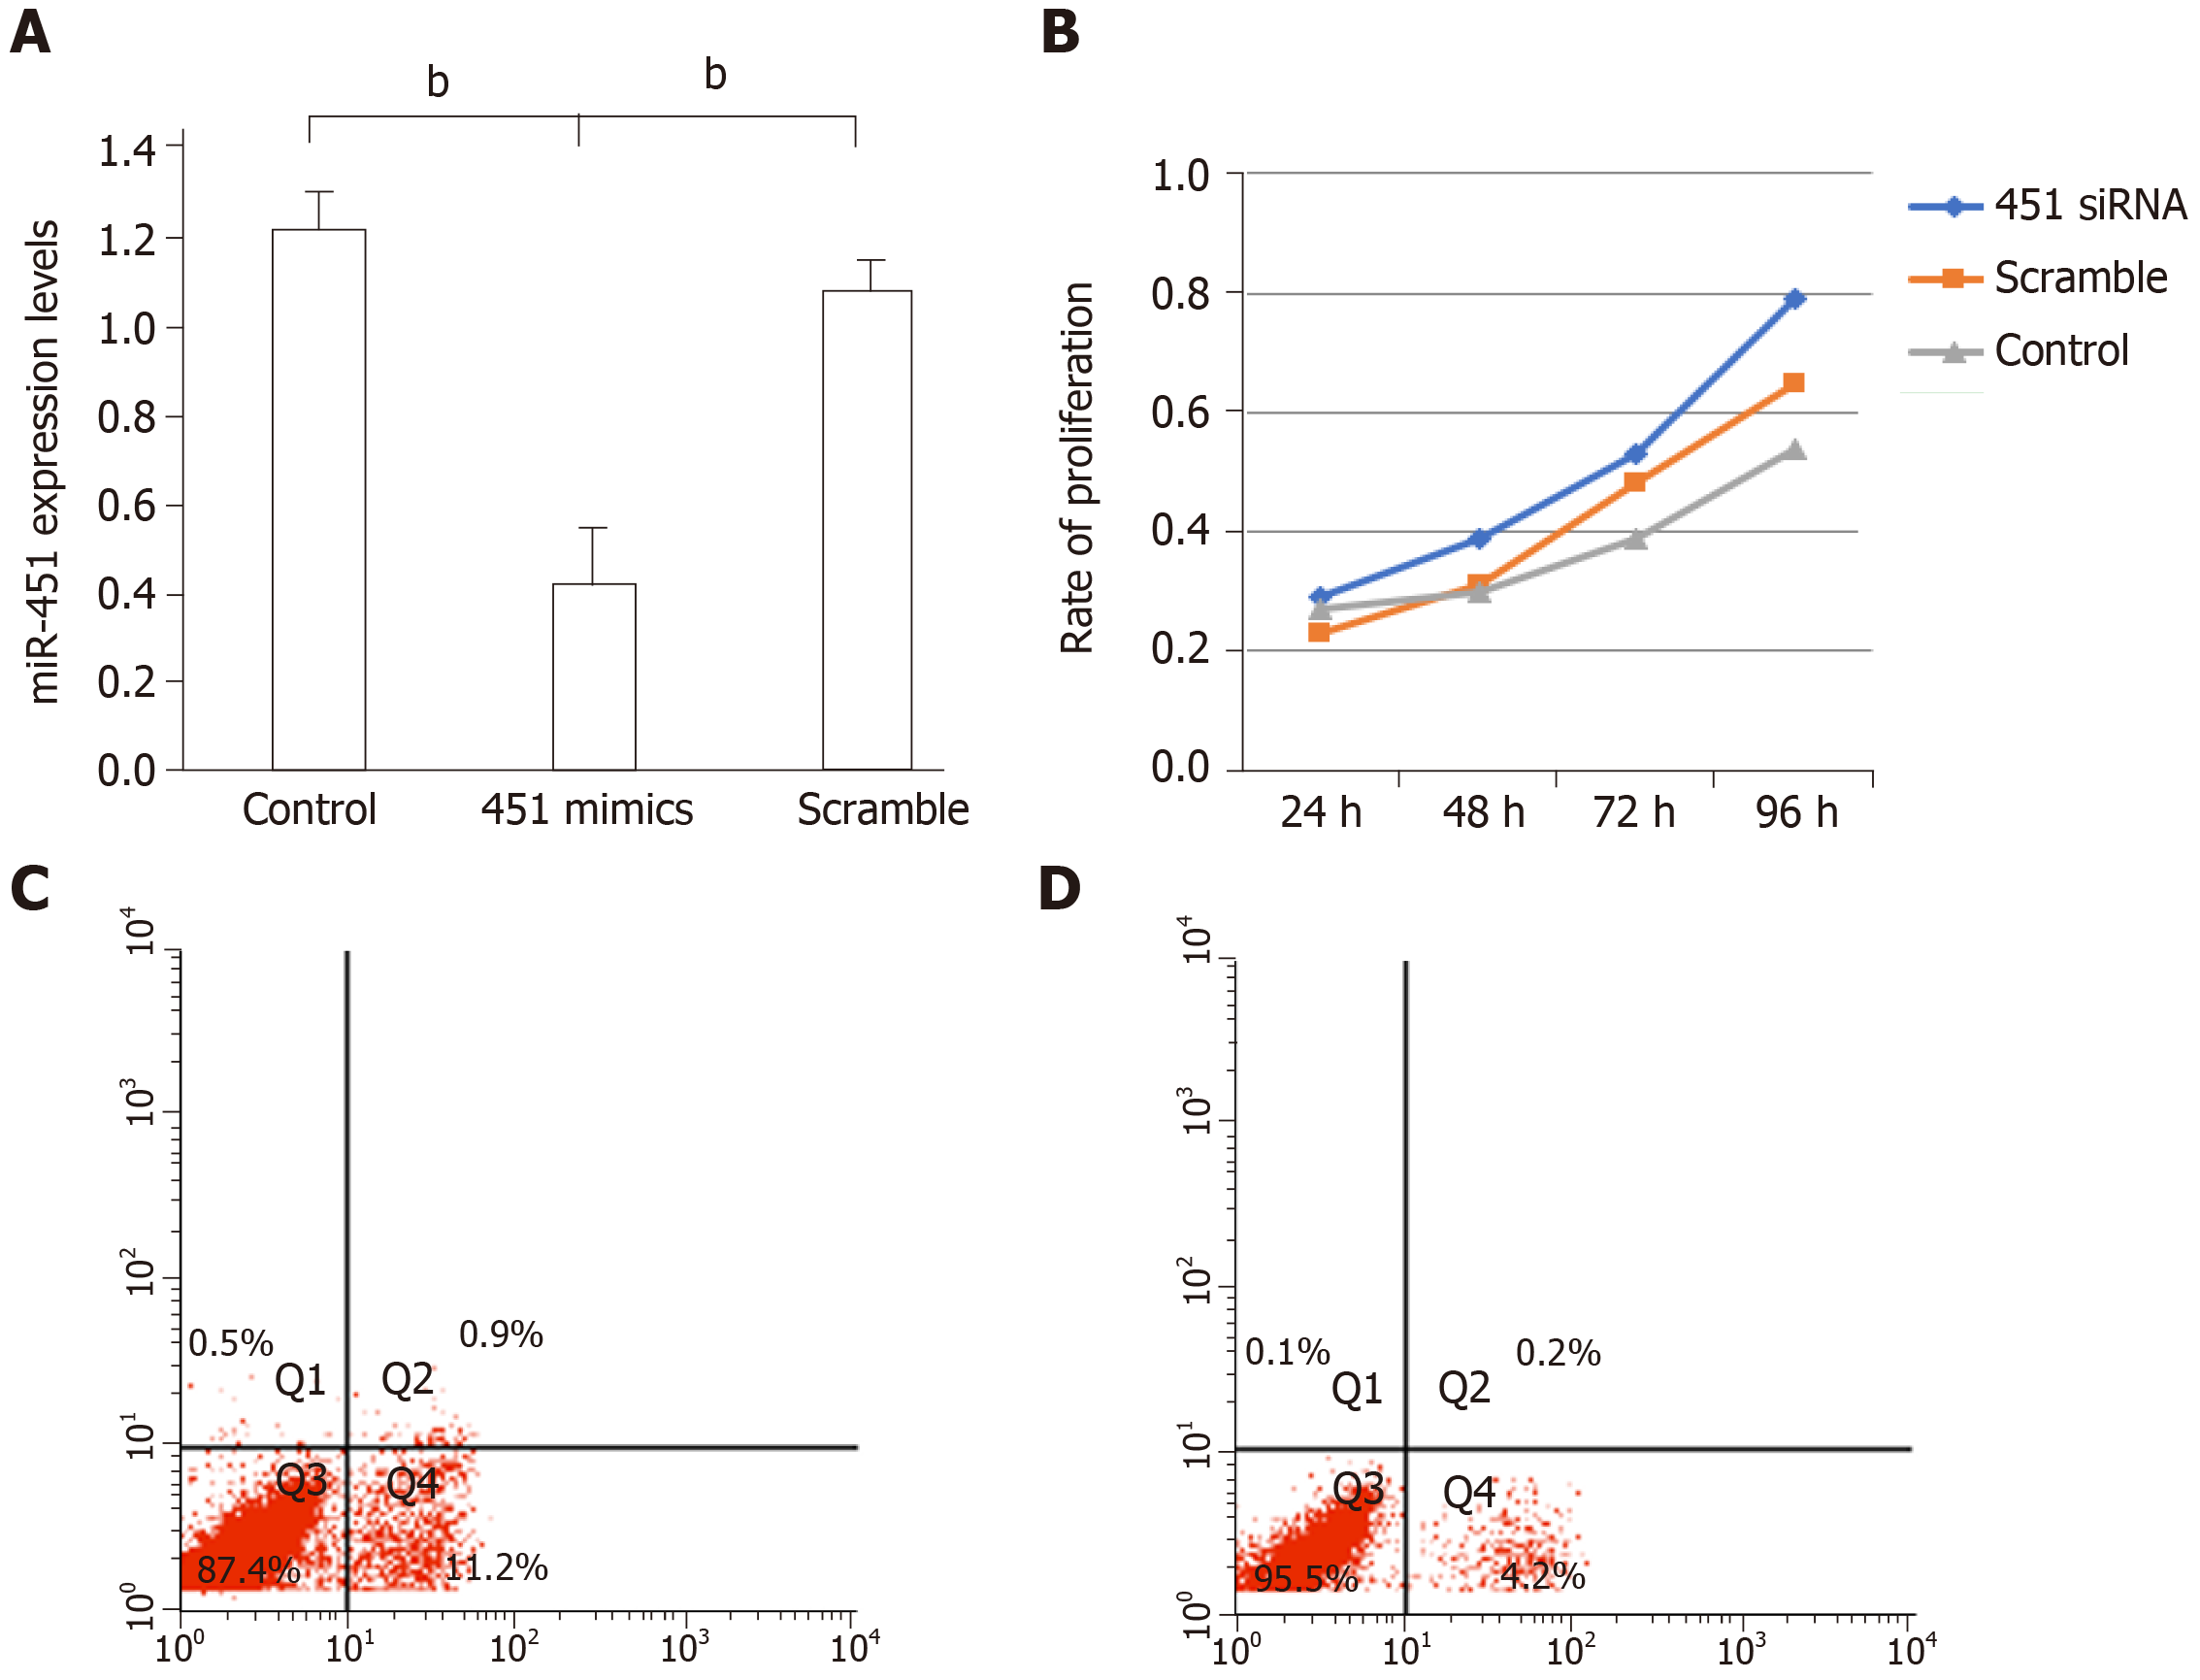
Figure 3 Transfection with miR-451 siRNA decreases apoptosis and promotes cell proliferation in control eutopic cells.
A: MiR-451 expression was significantly inhibited after transfection with miR-451 siRNA. Data are expressed as 2−ΔΔCt (mean ± SEM, n = 4). bP < 0.01 vs control and scrambled; B: Cell Counting Kit-8 assays revealed that the proliferation rate of cells transfected with miR-451 siRNA was higher than those of cells in the control and scrambled groups (aP < 0.05); C and D: Flow cytometric analysis of apoptosis in cells transfected with scrambled siRNA and miR-451, respectively.
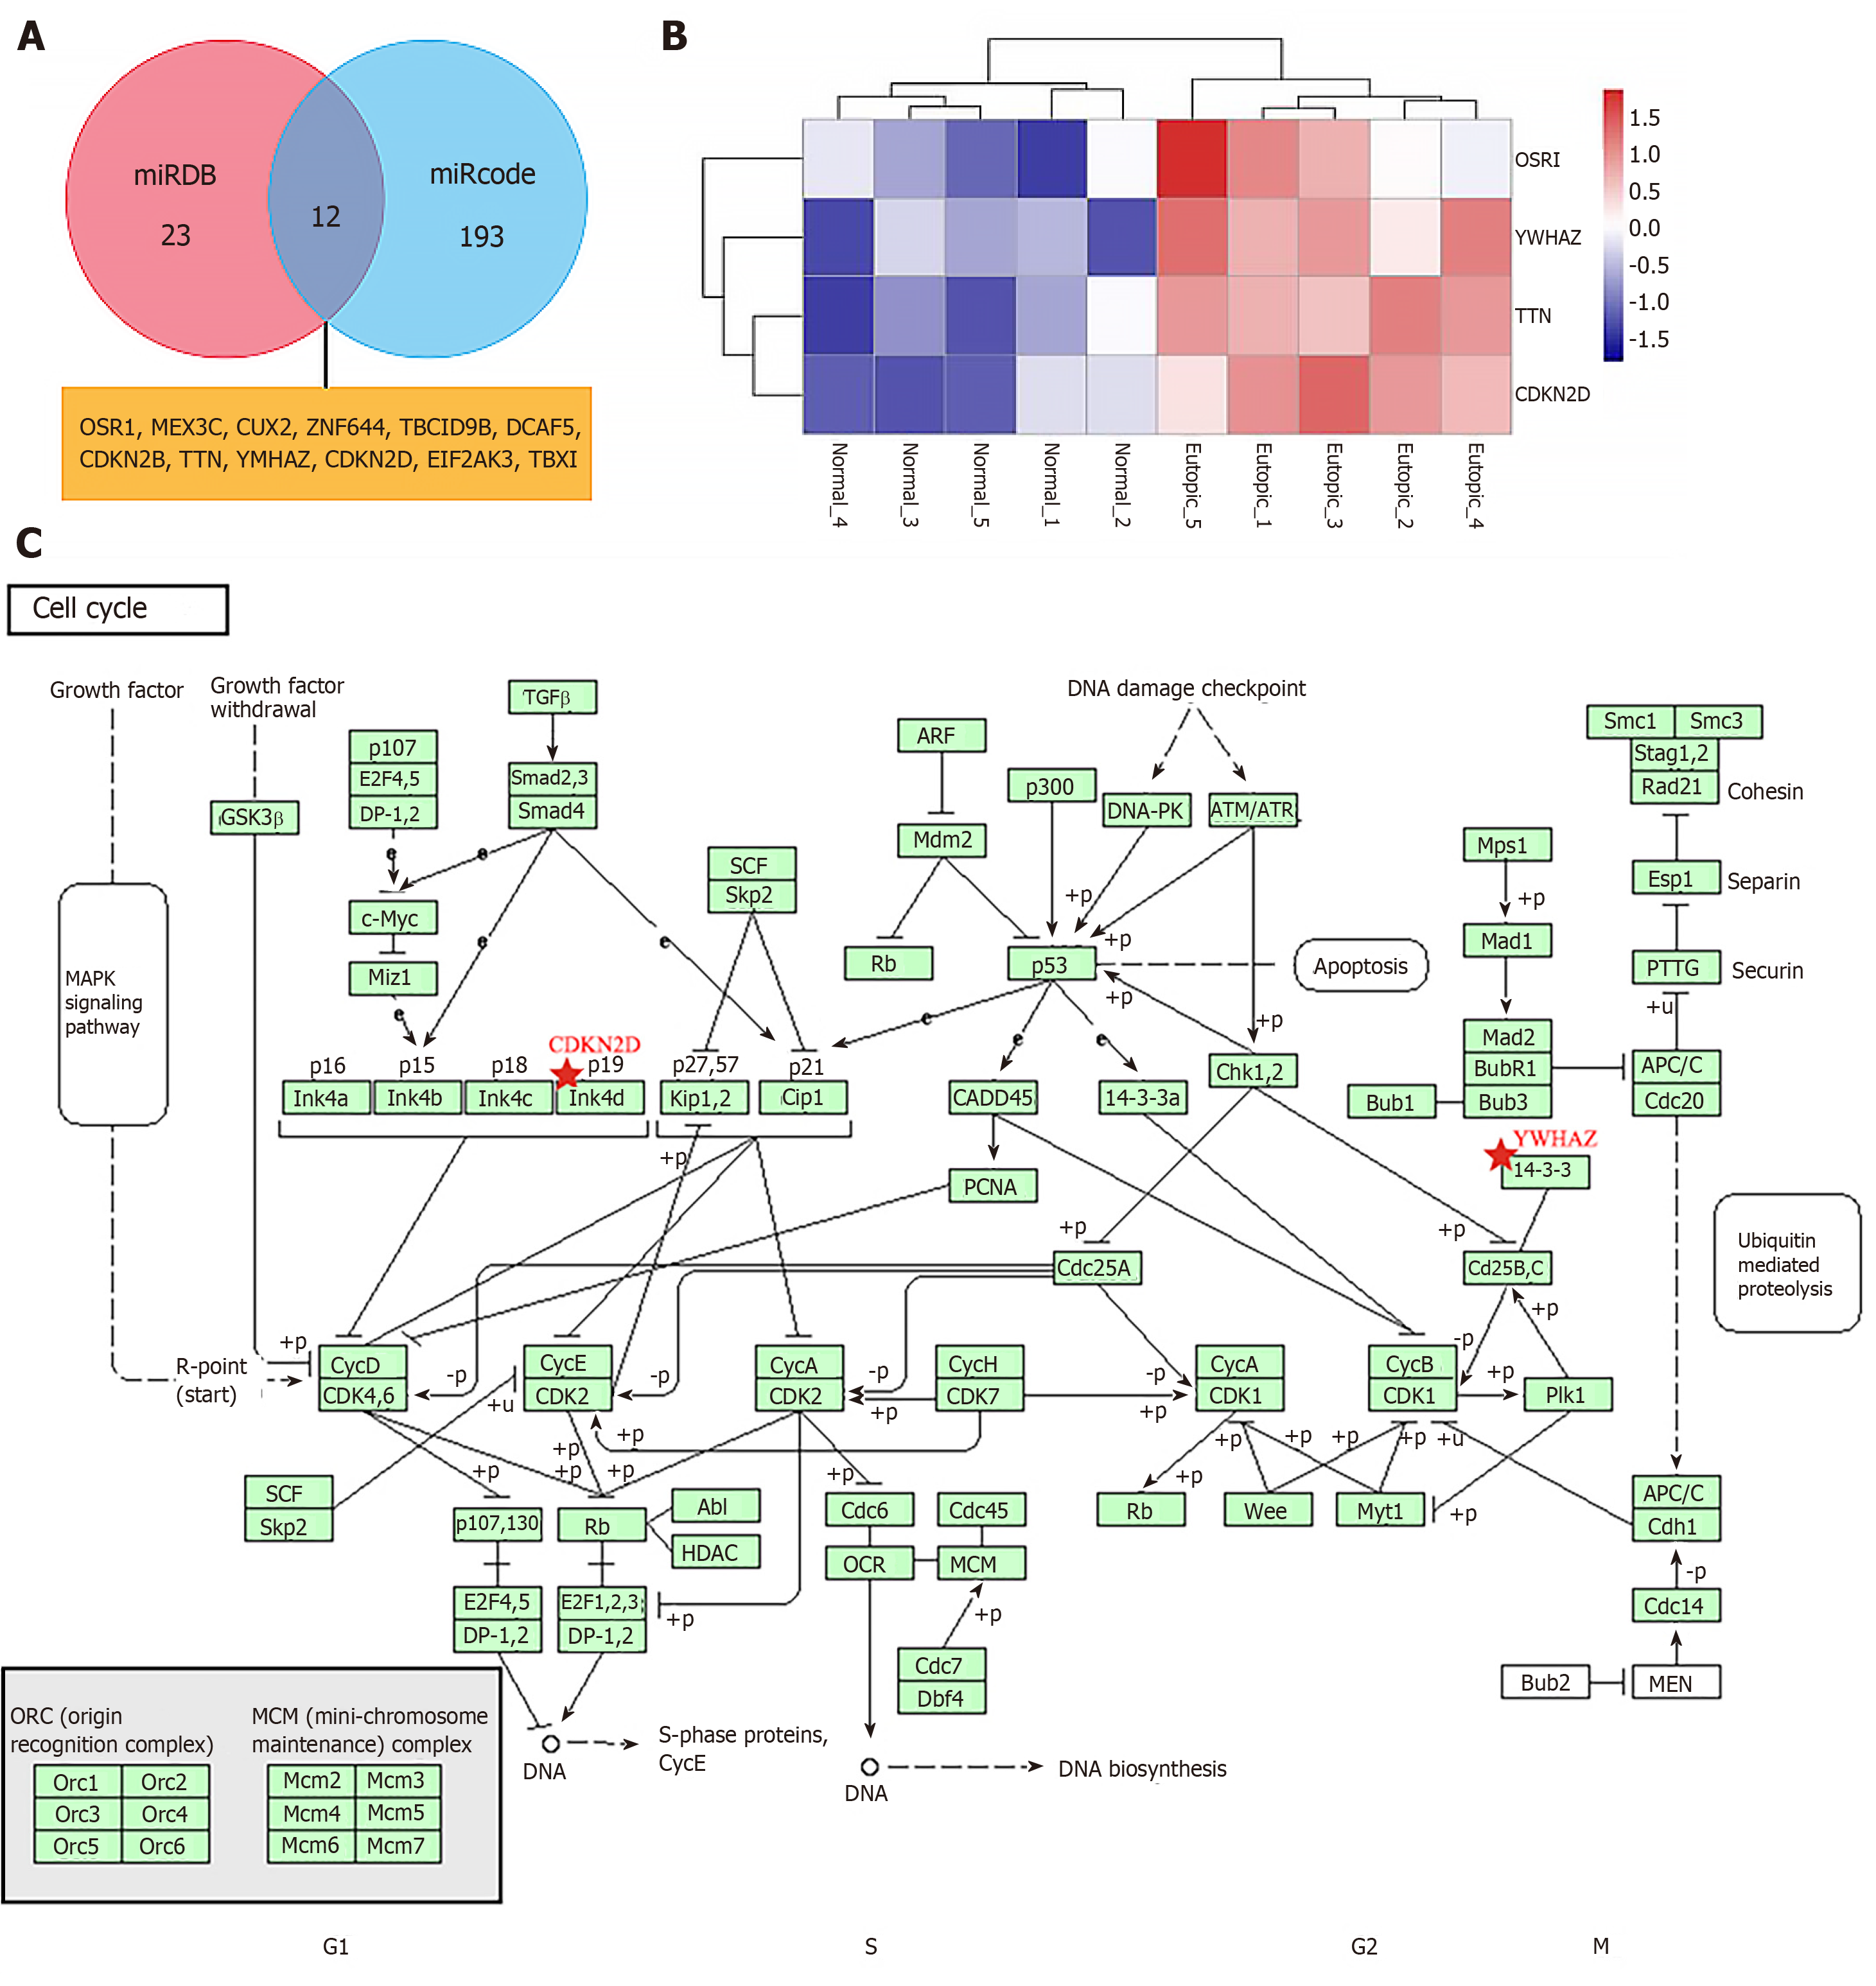
Figure 4 Results of bioinformatics analysis of miR-451 target genes according to the GSE7846 dataset.
A: Potential target genes of miR-451 predicted based on miRDB and miRcode databases; B: Heatmap of expression levels of OSR1, YWHAZ, TTN, and CDKN2D; C: Role of YWHAZ and CDKN2D in the cell cycle according to Kyoto Encyclopedia of Genes and Genomes pathway analysis.
- Citation: Gao S, Liu S, Gao ZM, Deng P, Wang DB. Reduced microRNA-451 expression in eutopic endometrium contributes to the pathogenesis of endometriosis. World J Clin Cases 2019; 7(16): 2155-2164
- URL: https://www.wjgnet.com/2307-8960/full/v7/i16/2155.htm
- DOI: https://dx.doi.org/10.12998/wjcc.v7.i16.2155


