Copyright
©The Author(s) 2019.
World J Clin Cases. Jun 26, 2019; 7(12): 1444-1455
Published online Jun 26, 2019. doi: 10.12998/wjcc.v7.i12.1444
Published online Jun 26, 2019. doi: 10.12998/wjcc.v7.i12.1444
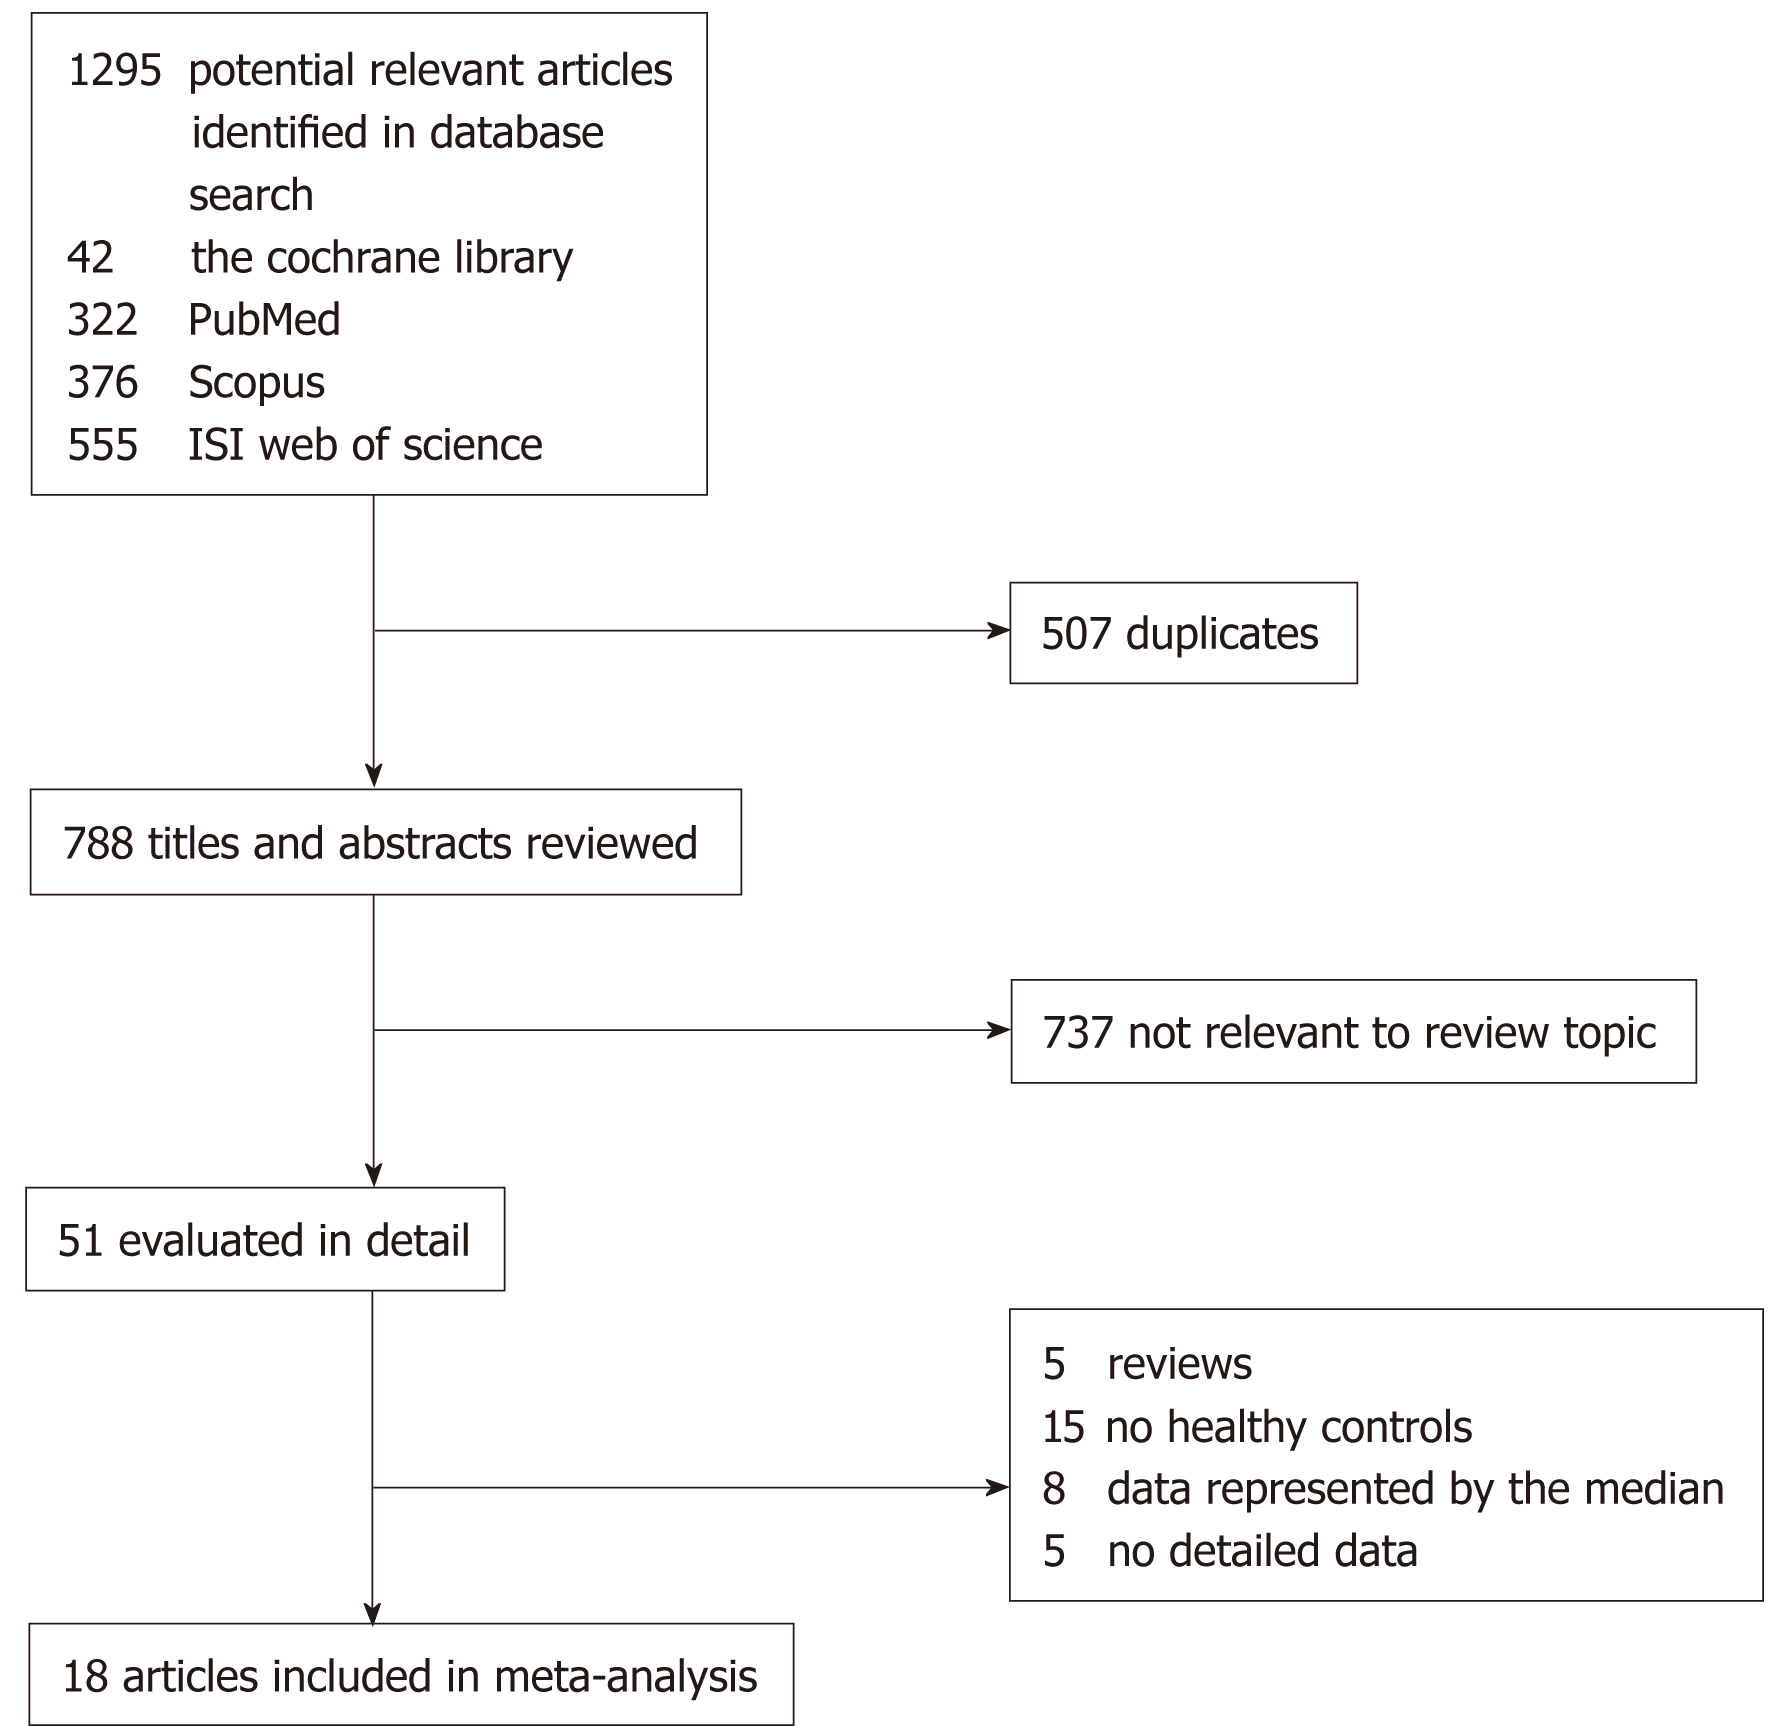
Figure 1 Flow chart of article selection for meta-analysis.
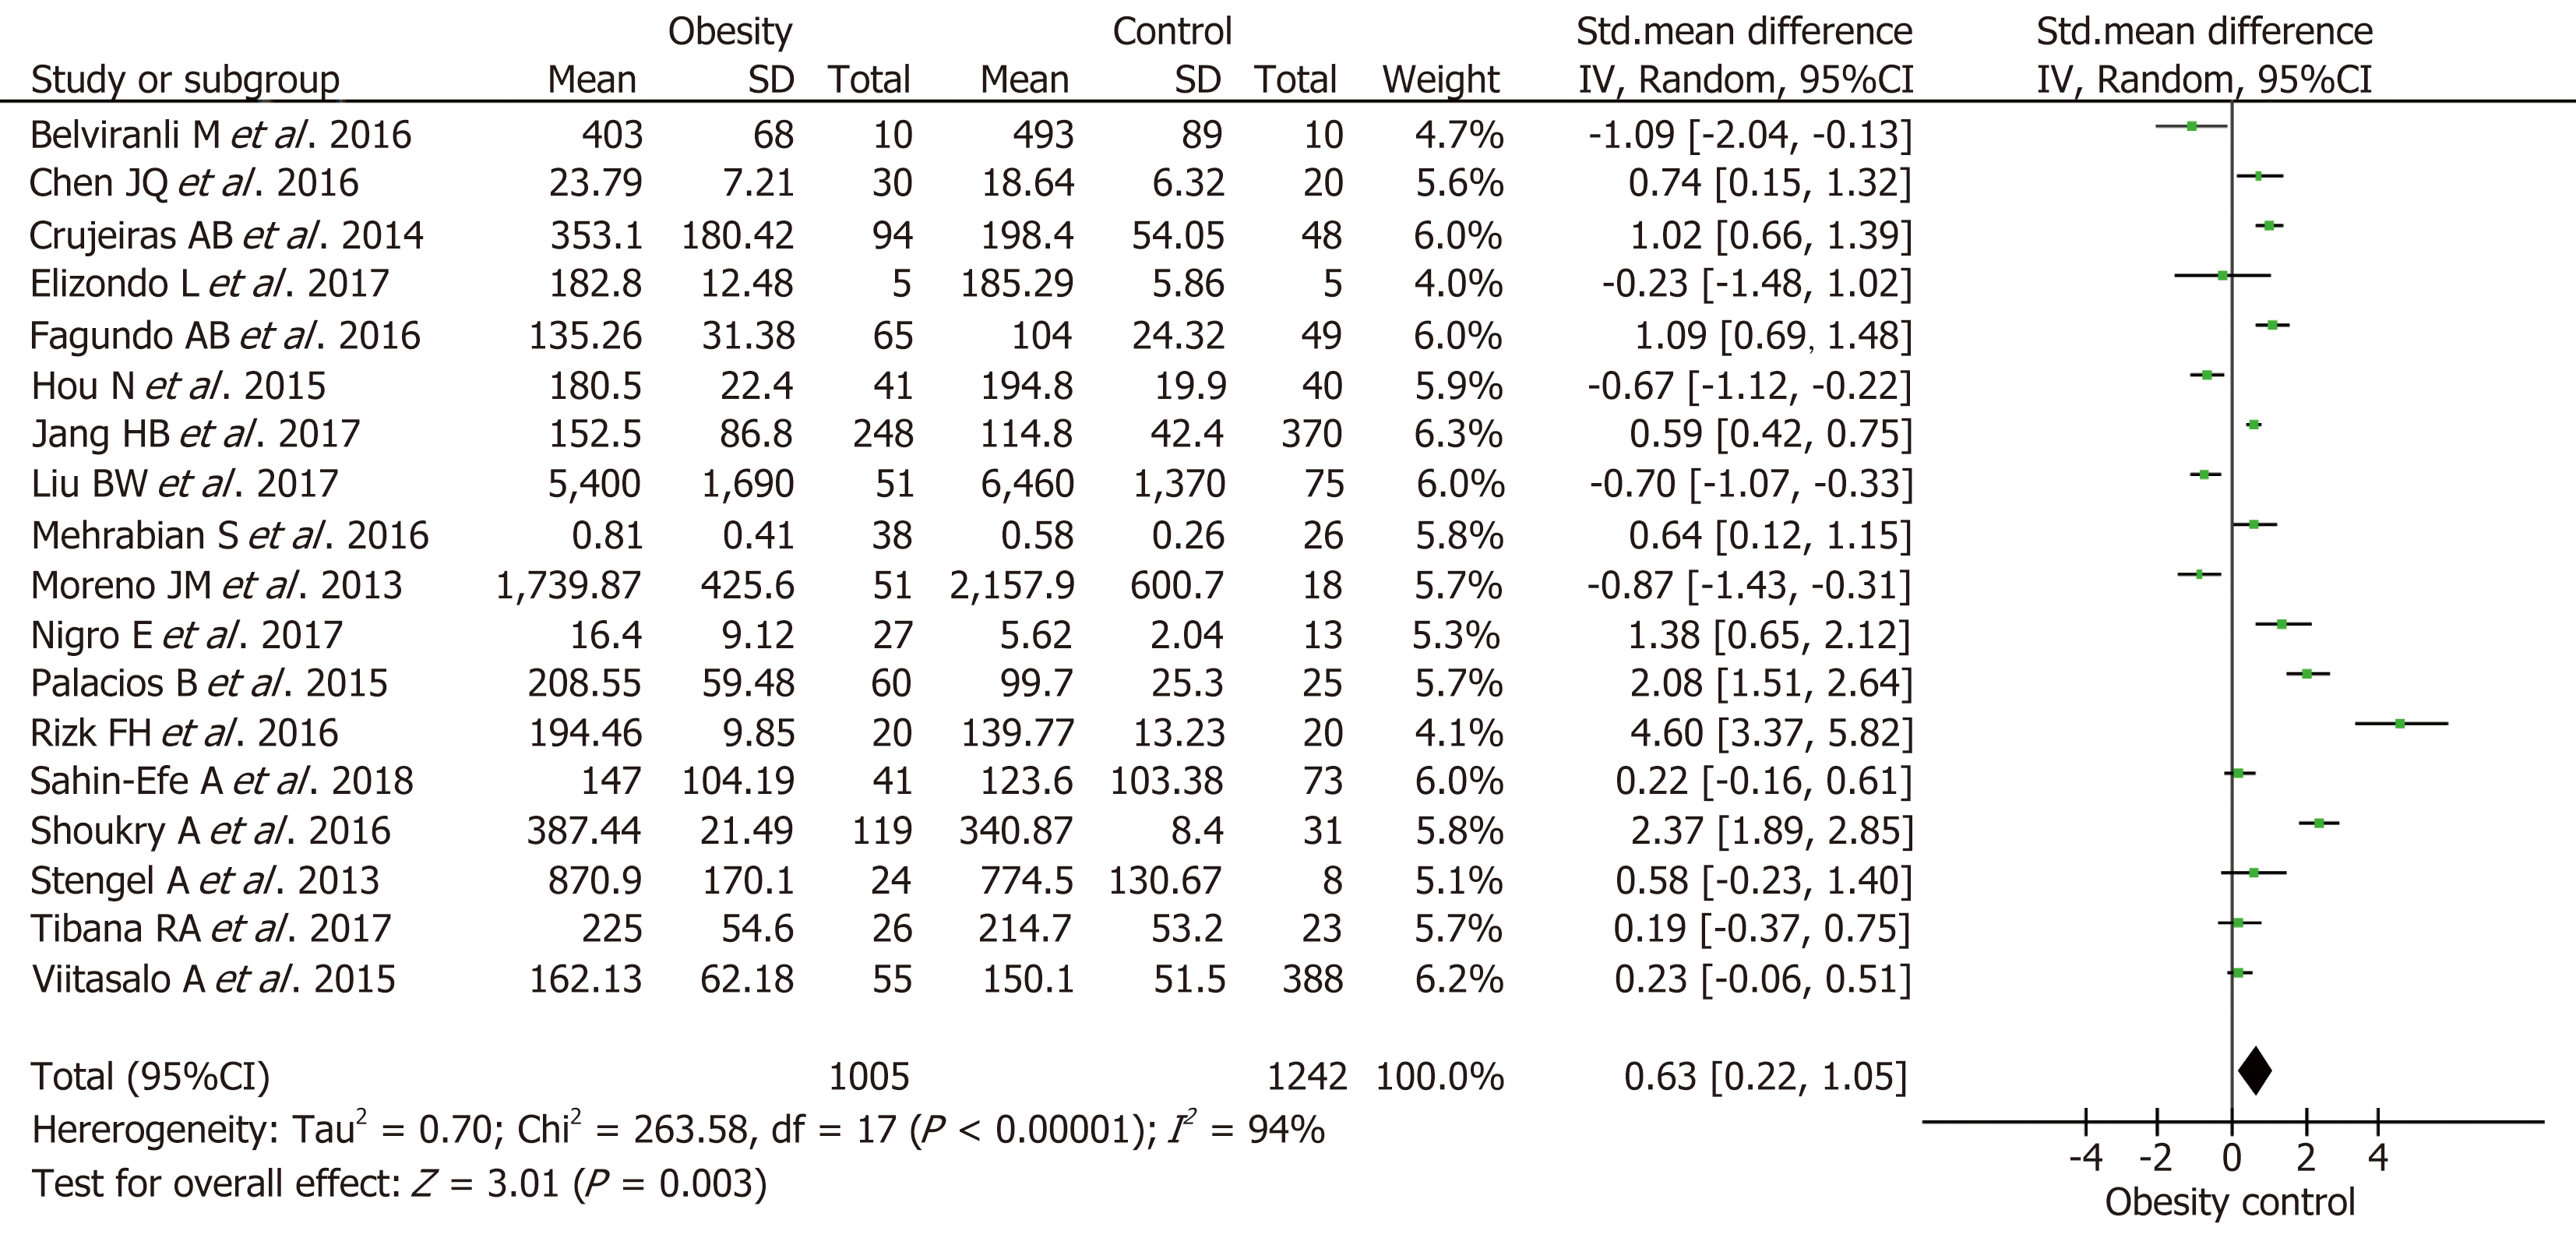
Figure 2 Forest plot of meta-analysis of the association between irisin and obesity.
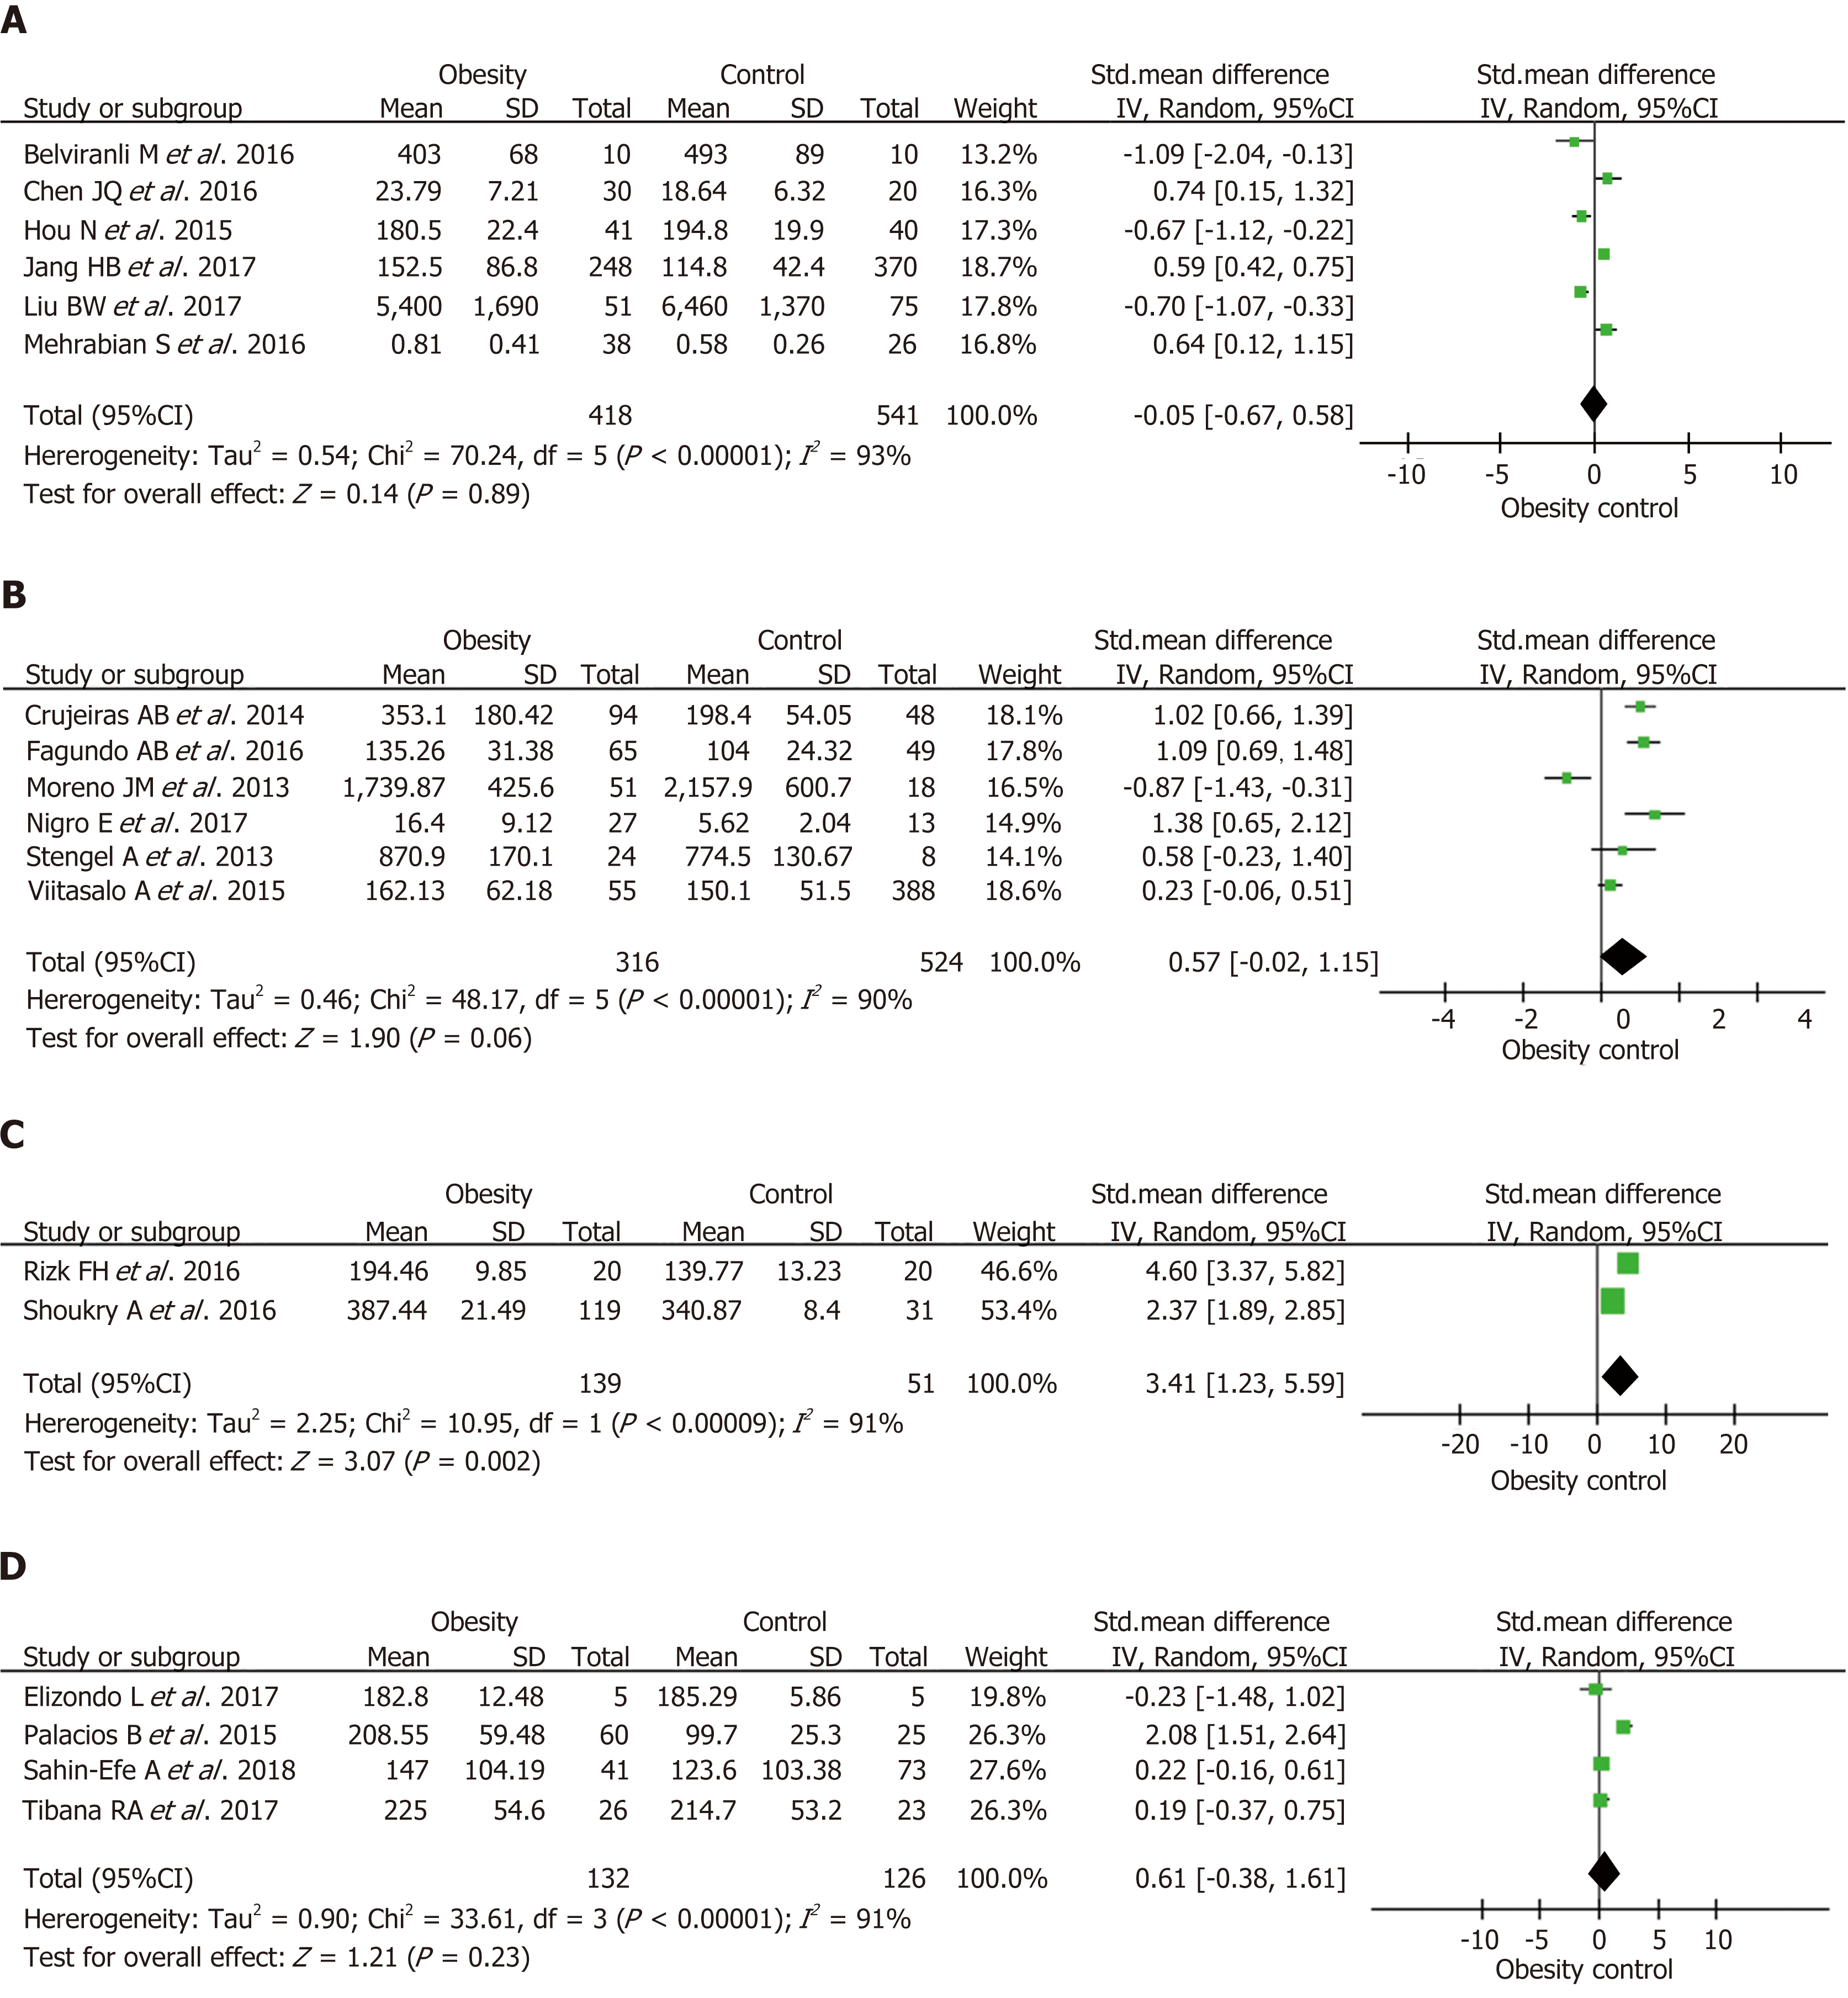
Figure 3 Forest plot of irisin in obese patients in different racial groups.
A: Forest plot of irisin in obese patients in Asia; B: Forest plot of irisin in obese patients in Europe; C: Forest plot of irisin in obese patients in Africa; D: Forest plot of irisin in obese patients in America.
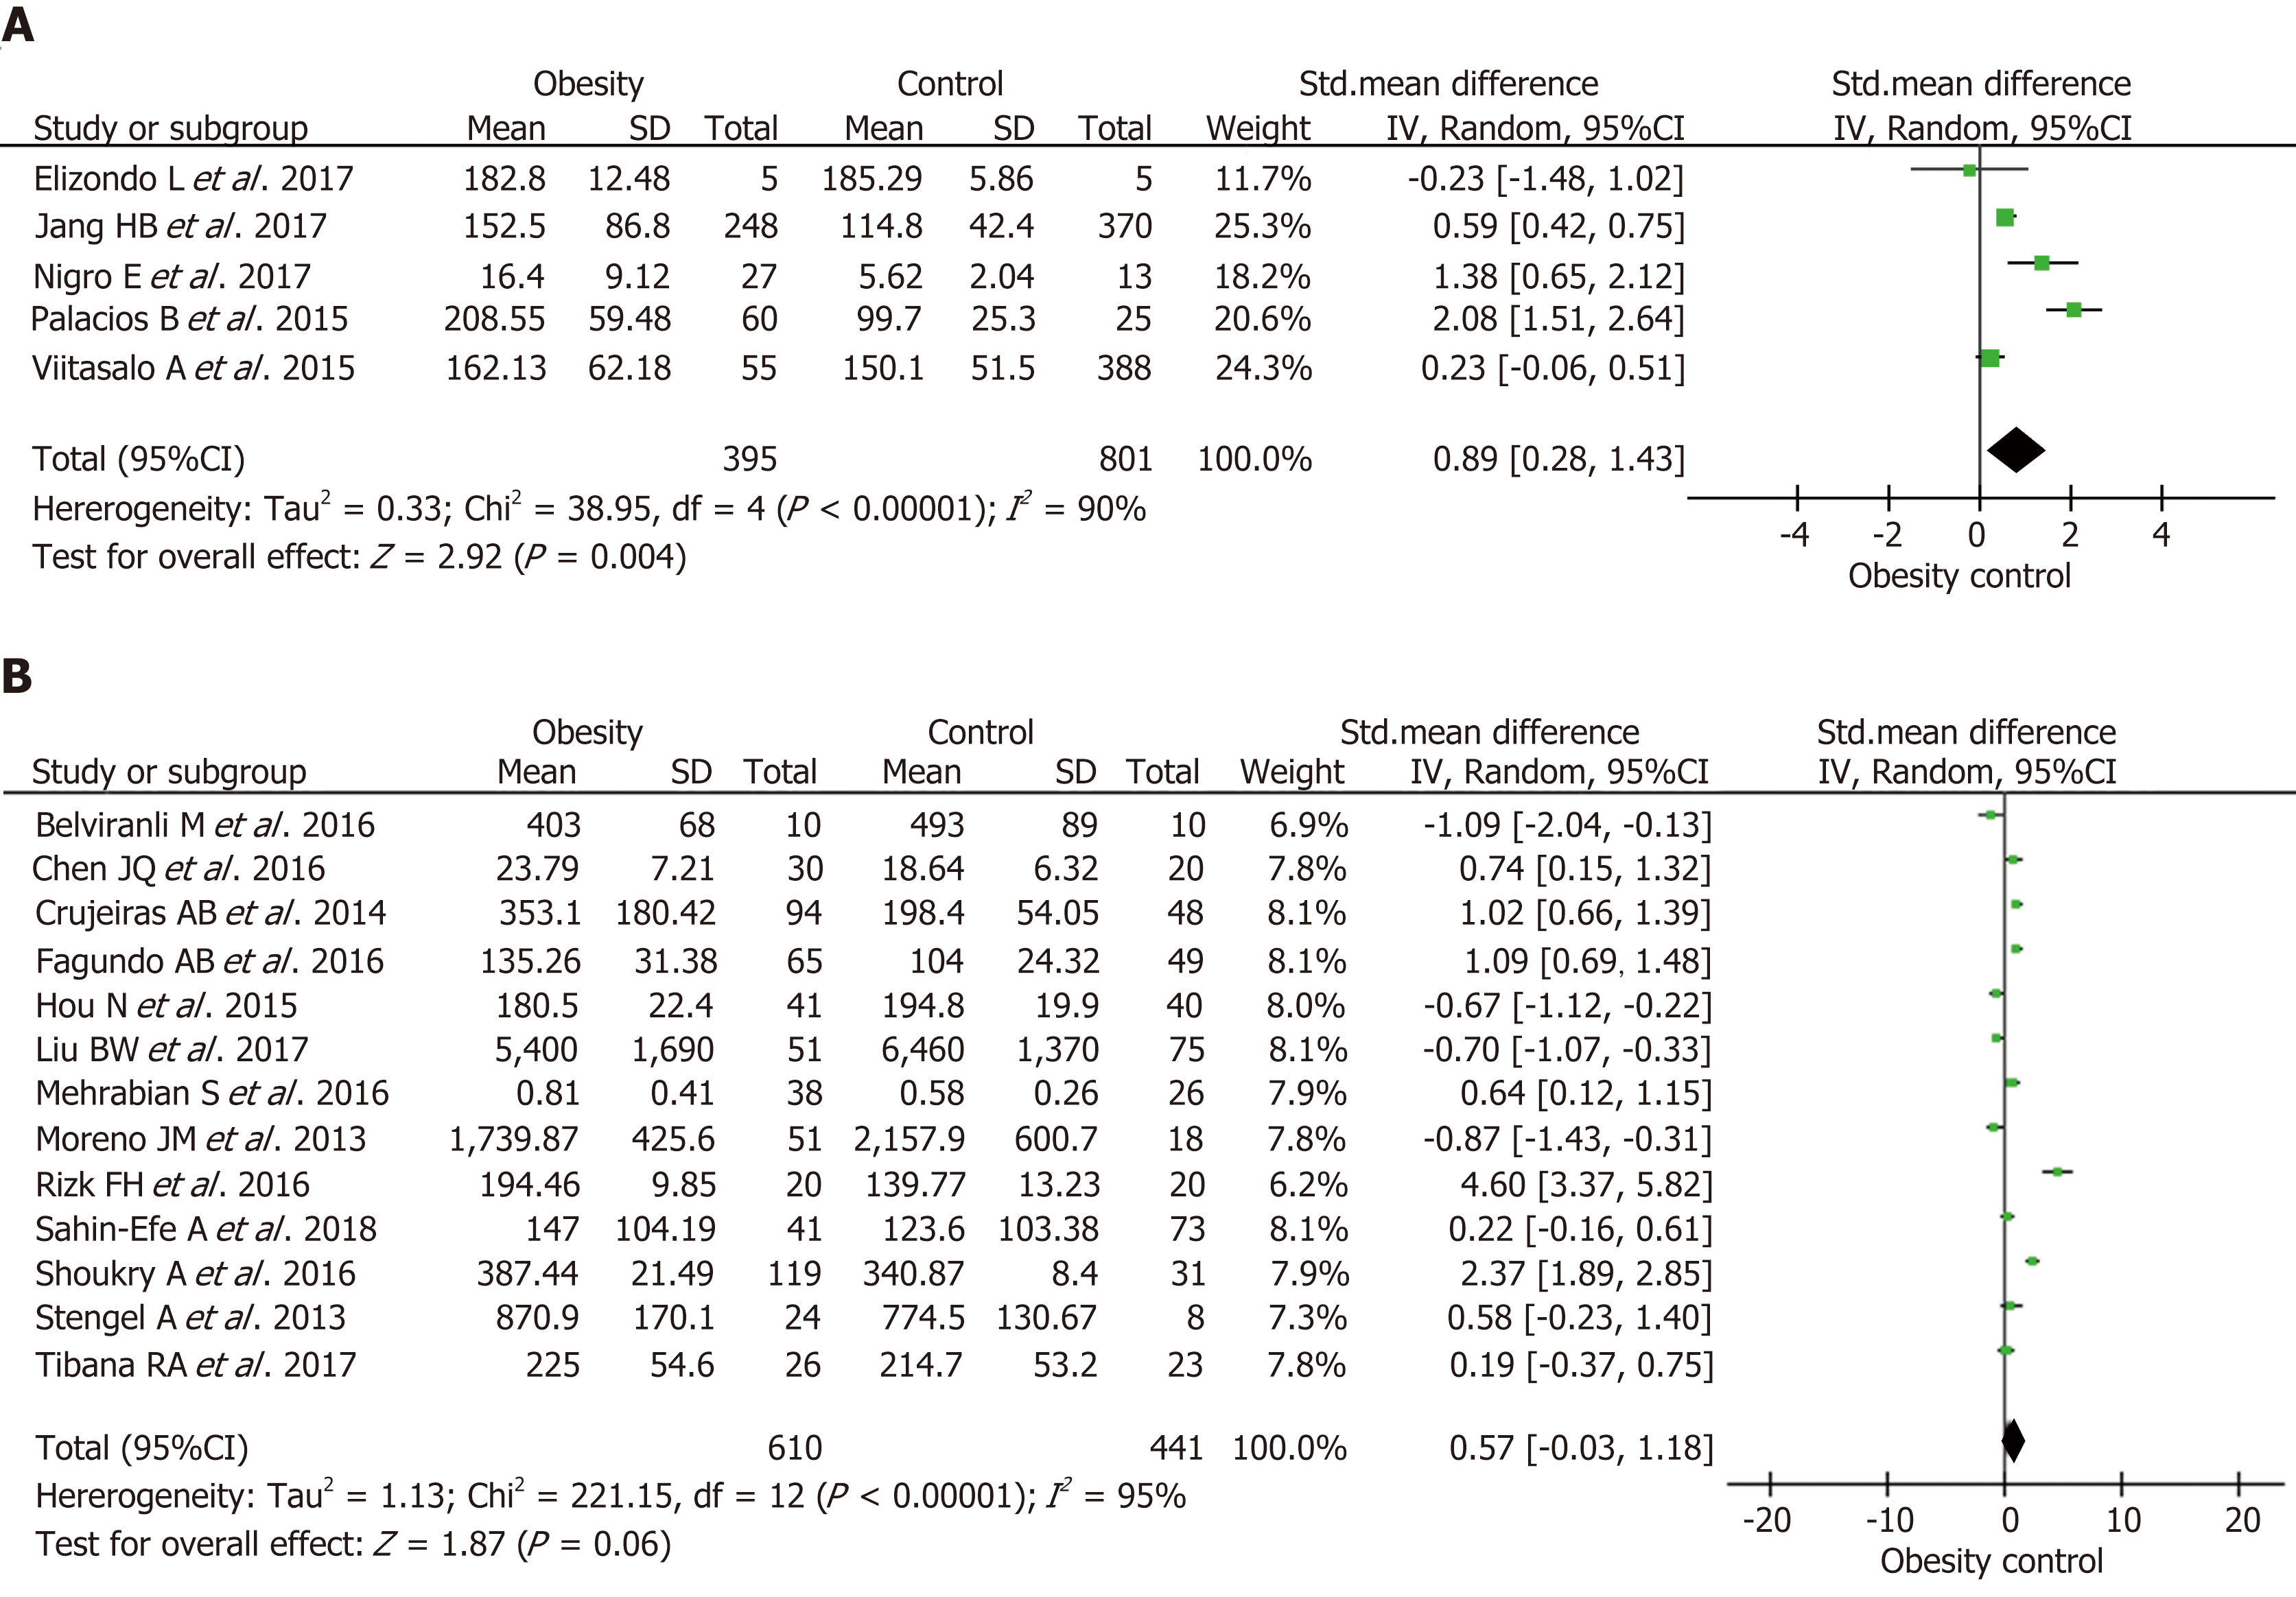
Figure 4 Forest plot of irisin in obese patients in children and adults.
A: Forest plot of irisin in obese children vs nonobese children; B: Forest plot of irisin in obese adults vs nonobese adults.
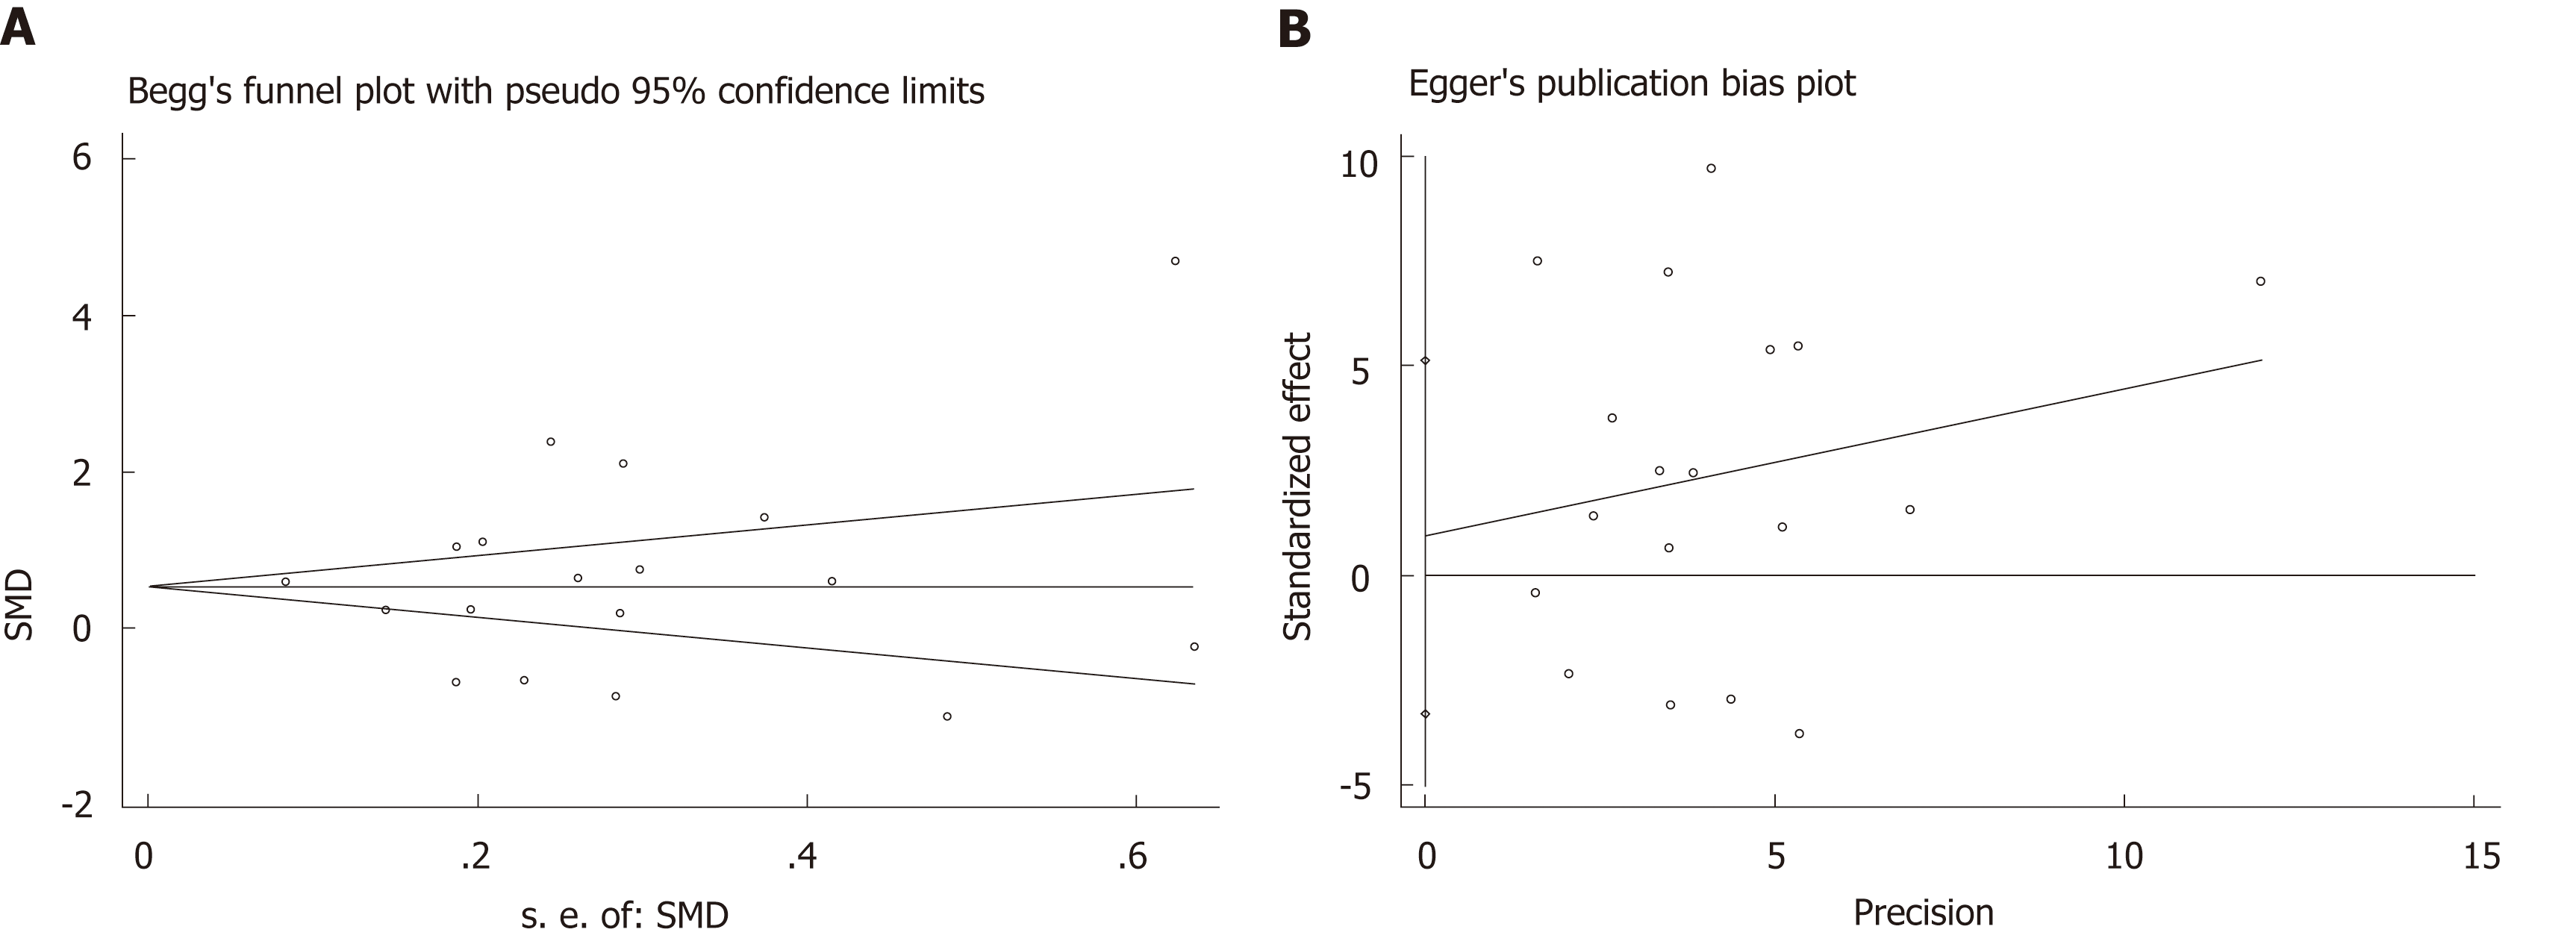
Figure 5 Analysis of publication bias.
A: Begg’s funnel plot had the expected funnel shape (Begg’s test P = 0.544); B: Egger’s publication bias plot (Egger’s test P = 0.65).
- Citation: Jia J, Yu F, Wei WP, Yang P, Zhang R, Sheng Y, Shi YQ. Relationship between circulating irisin levels and overweight/obesity: A meta-analysis. World J Clin Cases 2019; 7(12): 1444-1455
- URL: https://www.wjgnet.com/2307-8960/full/v7/i12/1444.htm
- DOI: https://dx.doi.org/10.12998/wjcc.v7.i12.1444


