Copyright
©The Author(s) 2022.
World J Clin Cases. Aug 16, 2022; 10(23): 8242-8248
Published online Aug 16, 2022. doi: 10.12998/wjcc.v10.i23.8242
Published online Aug 16, 2022. doi: 10.12998/wjcc.v10.i23.8242
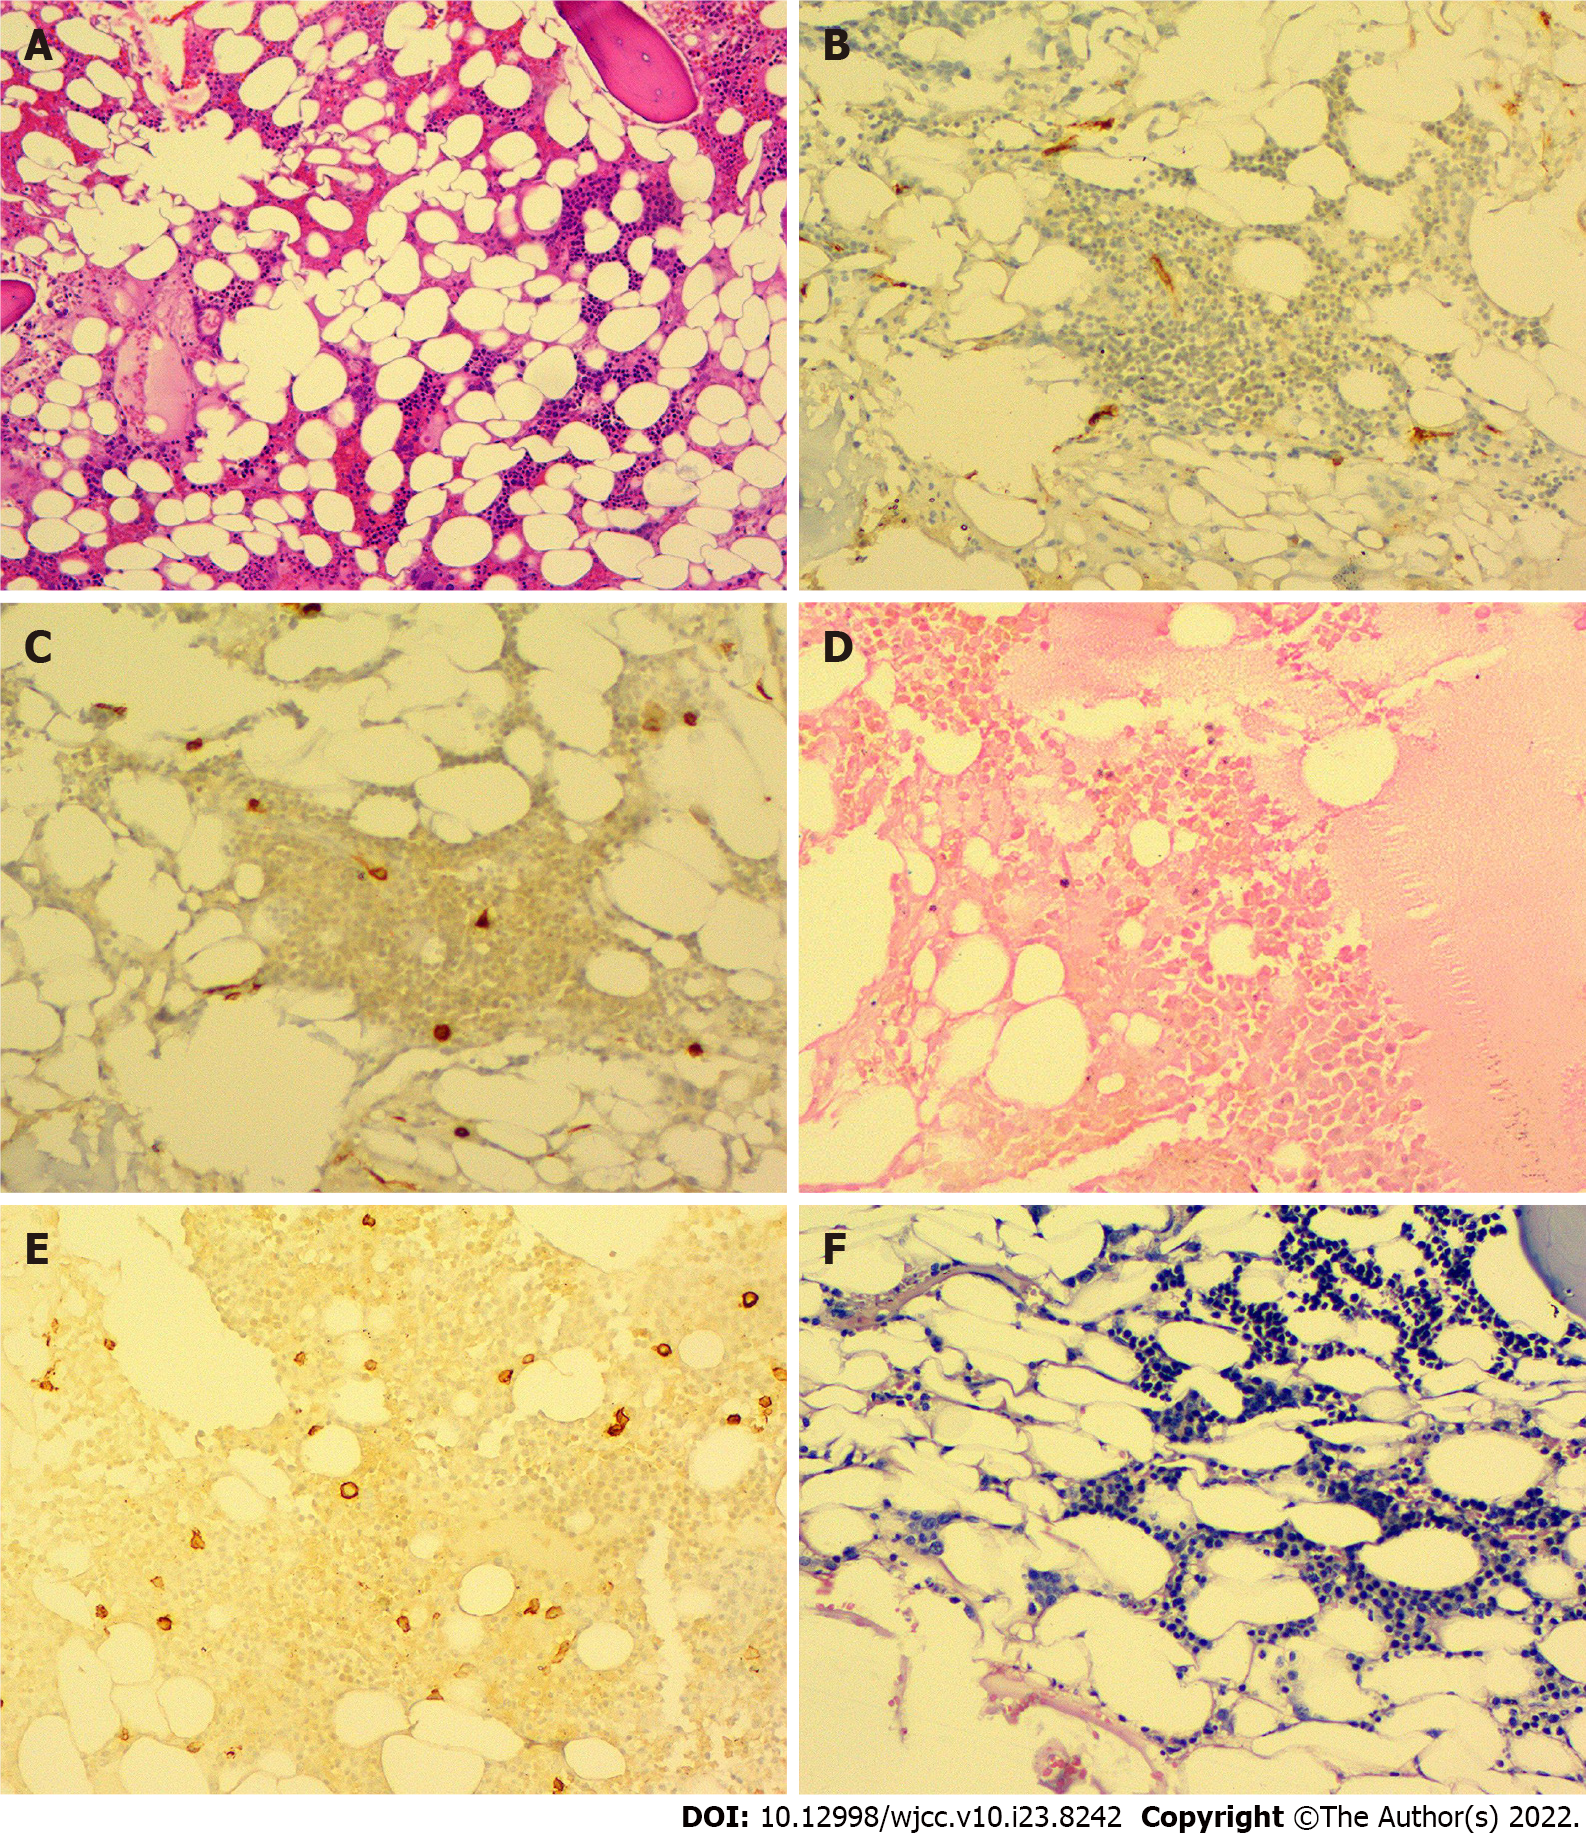
Figure 1 Bone marrow biopsy result.
A: CD34 (-); B: CD117 (minority +); C: myeloperoxidase (partial +); D: Reticular fiber (-); E: Perls (-); F: Eber (-).
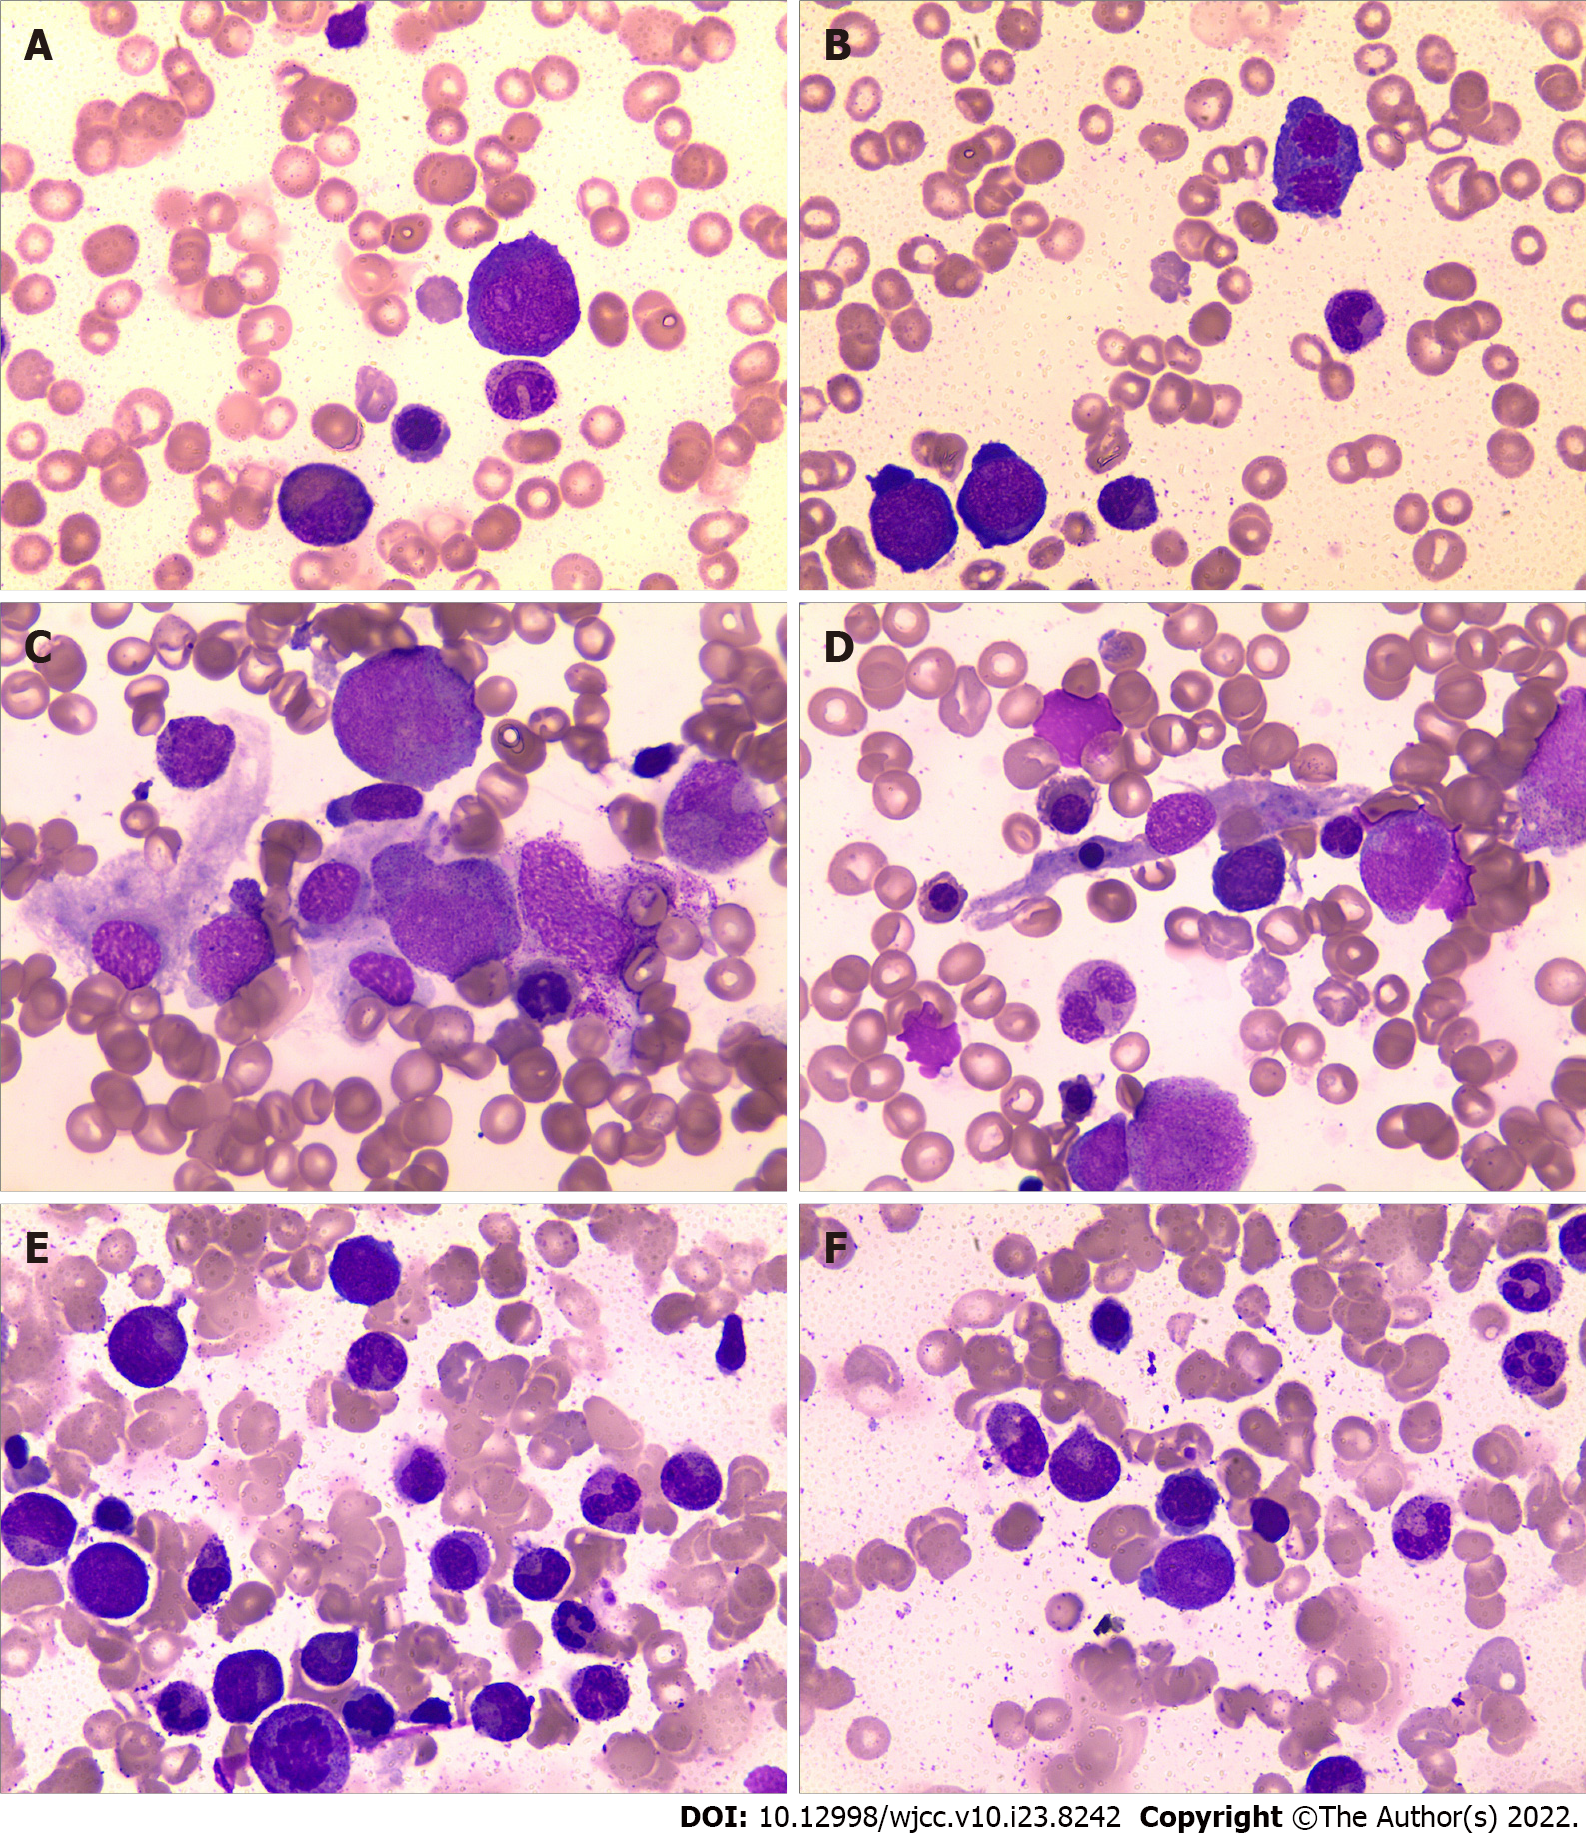
Figure 2 Morphological observation of bone marrow cells (100×).
A, B: Before immunosuppressive therapy; C, D: After immunosuppressive therapy for 6 mo; E, F: After immunosuppressive therapy for 12 mo.
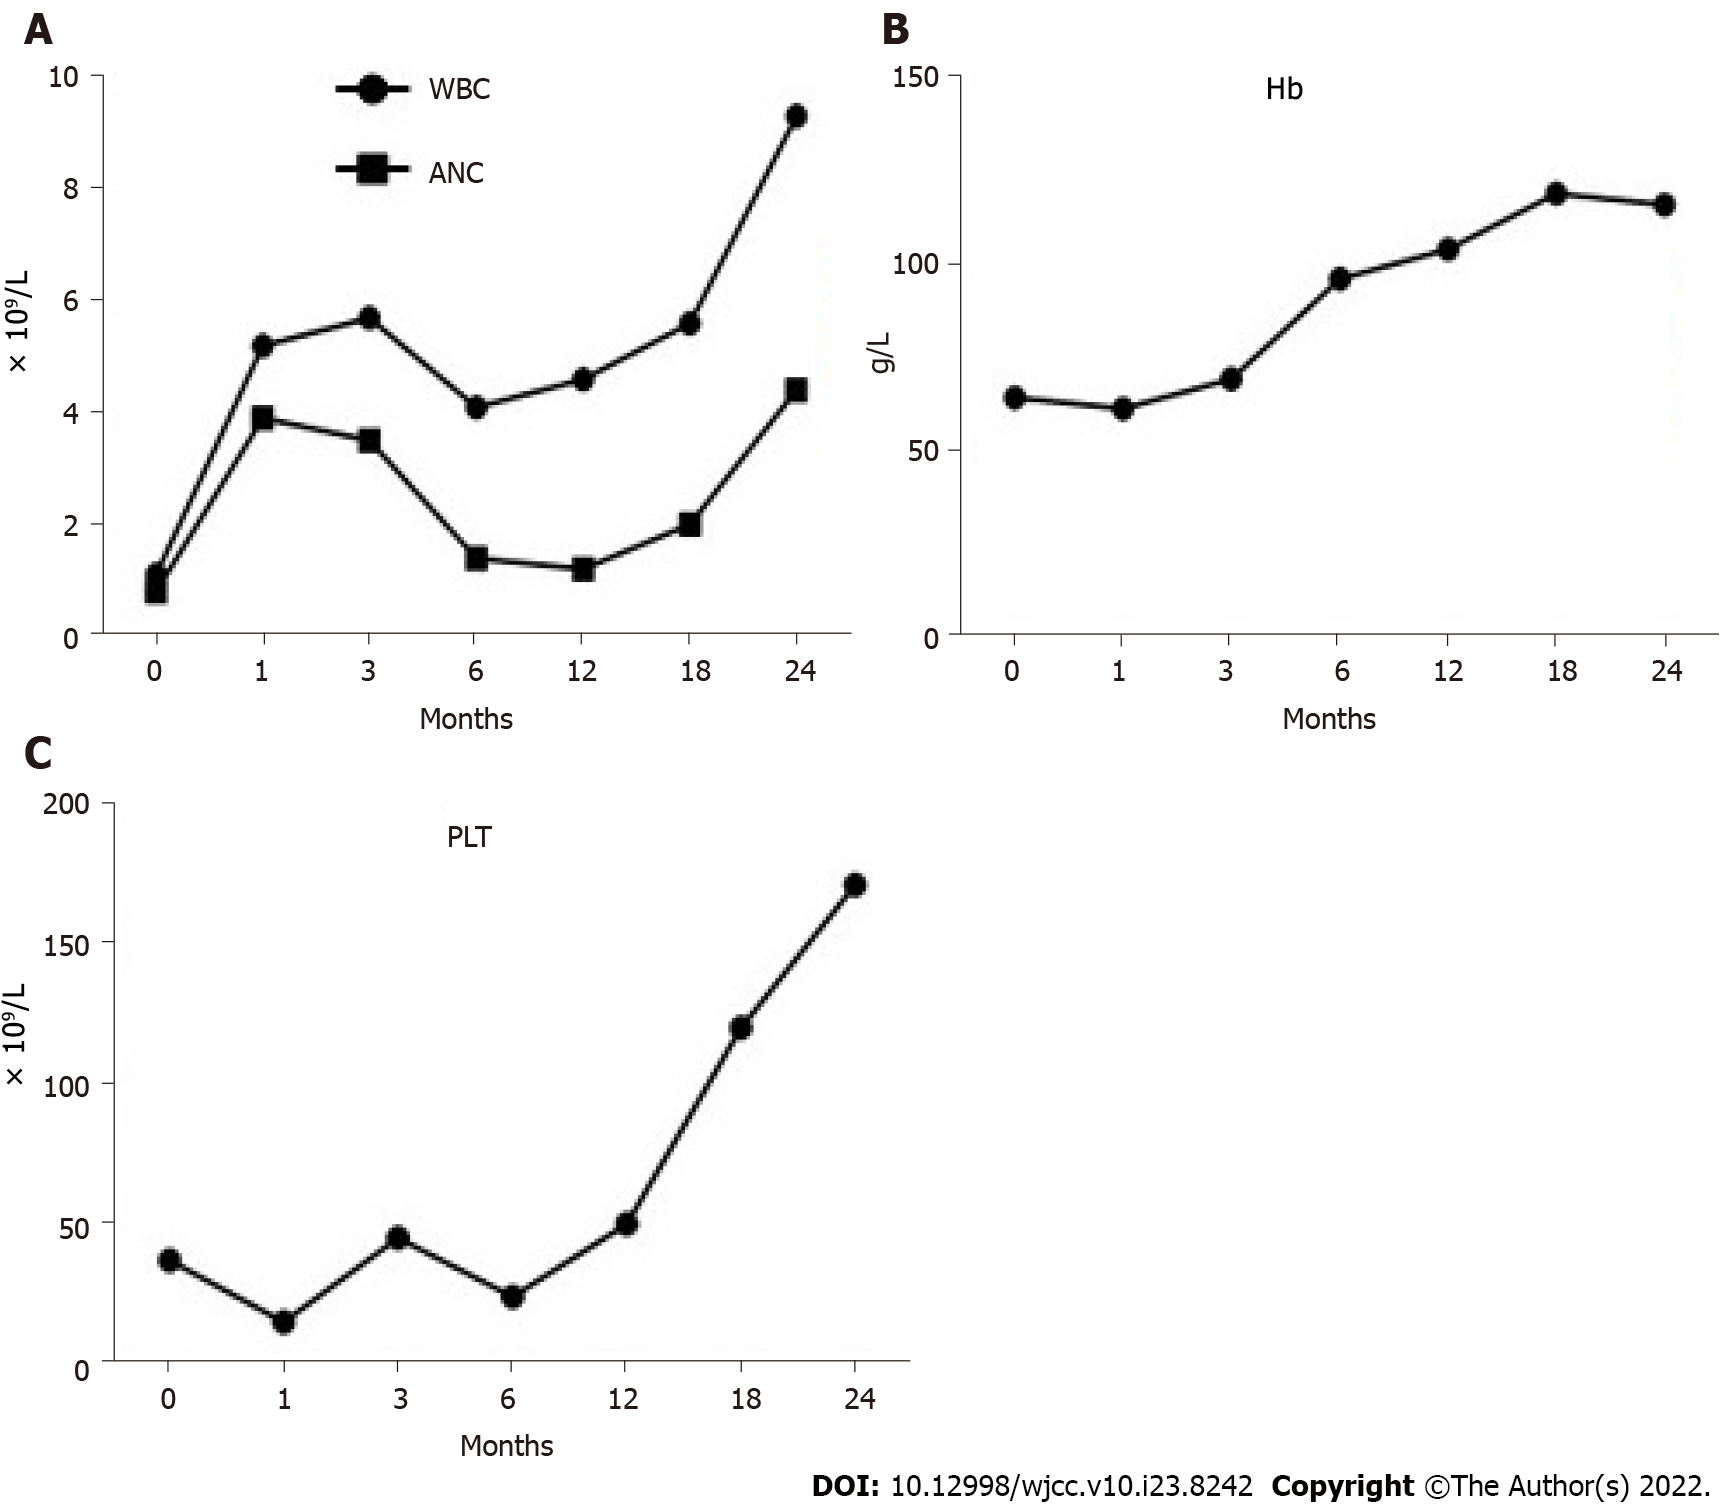
Figure 3 Changes in complete blood count as treatment progressed.
A: White blood cell (WBC) and absolute neutrophil count (ANC); B: Hemoglobin (Hb); C: Platelets (PLT).
- Citation: Zhang WJ, Wu LQ, Wang J, Lin SY, Wang B. Epstein–Barr-virus-associated hepatitis with aplastic anemia: A case report. World J Clin Cases 2022; 10(23): 8242-8248
- URL: https://www.wjgnet.com/2307-8960/full/v10/i23/8242.htm
- DOI: https://dx.doi.org/10.12998/wjcc.v10.i23.8242


