Copyright
©The Author(s) 2017.
World J Clin Pediatr. Feb 8, 2017; 6(1): 10-23
Published online Feb 8, 2017. doi: 10.5409/wjcp.v6.i1.10
Published online Feb 8, 2017. doi: 10.5409/wjcp.v6.i1.10
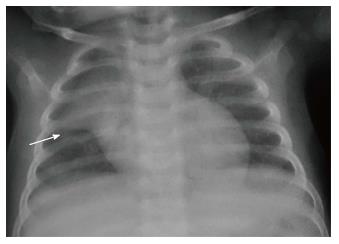
Figure 1 Frontal chest radiograph in an 11-mo-old boy with mild respiratory distress reveals normal thymus with characteristic “sail sign” (arrow).
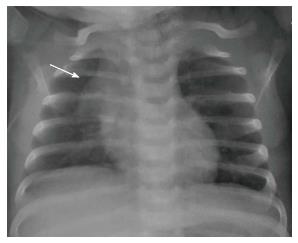
Figure 2 Frontal chest radiograph of a 2-mo-old girl with cough.
The thymus gland is prominent but normal. Note the impression of the anterior ribs on the thymus producing the “wave sign” (arrow).
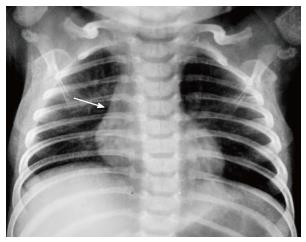
Figure 3 Frontal chest radiograph of a 2-year-old boy showing the inferior margin of the thymus merging with the cardiac silhouette - the “notch sign”(arrow).
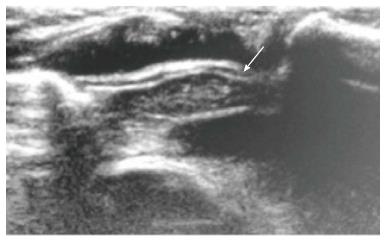
Figure 4 Normal sonographic (longitudinal view) appearance of the thymus gland in a 2-year-old boy with suspected mediastinal widening on chest radiograph.
The thymus is hypoechoic with multiple internal echogenic foci giving the characteristic “starry sky” appearance (arrow).
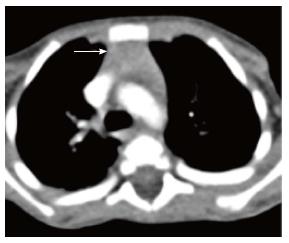
Figure 5 Normal appearance of the thymus on computed tomography scan of a 3-year-old boy.
Axial contrast-enhanced computed tomography section shows homogenous soft tissue density structure (arrow) in the anterior mediastinum. Note that there is no compression of the vascular structures or airway.
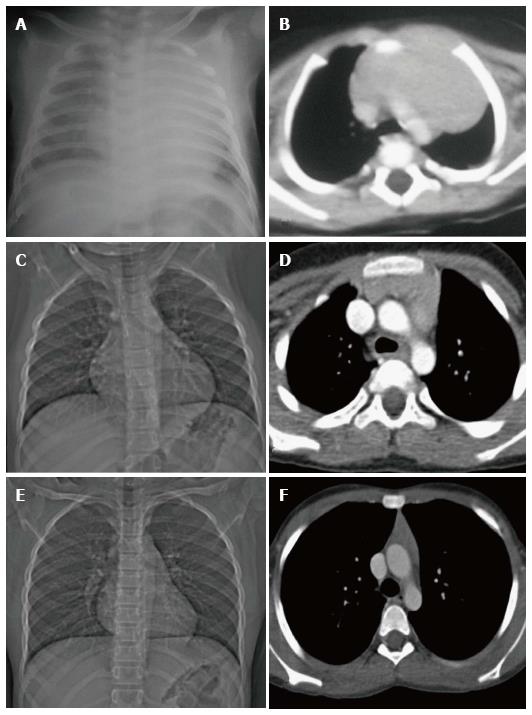
Figure 6 Normal variation in the appearance of the thymus with age.
Frontal radiographs and CECT axial images at ages of (A, B) 2 mo, (C, D) 7 years and (E, F) 12 years. Note that the initial prominent bilobed thymus in a neonate assumes a quadrilateral shape with convex margins in early childhood. Gradually it assumes a triangular configuration with straight margins. The CT density also decreases with age with fatty replacement occurring in adults.
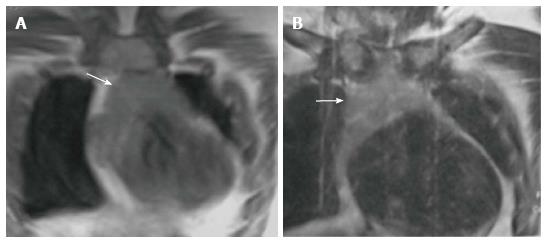
Figure 7 Normal appearance of the thymus on magnetic resonance imaging in a 1-year-old boy.
Coronal T1WI (A) and T2WI (B) show that the signal intensity of the thymus gland is homogeneous (arrow in A and B), greater than that of the muscle on T1WI and isointense to that of fat on T2WI.
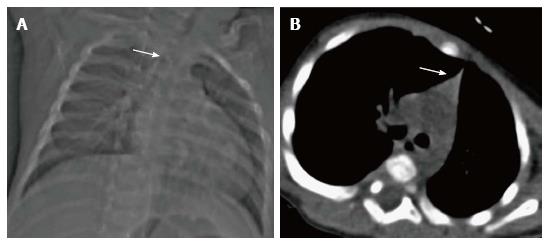
Figure 8 Thymic hypoplasia in a 3-mo-old male infant with primary immunodeficiency.
CT scanogram (A) reveals small size of the thymus, i.e., less than twice the width of the third thoracic vertebra (arrow). NCCT chest axial section (B) shows triangular configuration of the thymus (arrow) with straight margins (normal appearance in adolescents). Compare this with the normal appearance of the thymus in a 2-mo-old infant (Figure 6A and B).
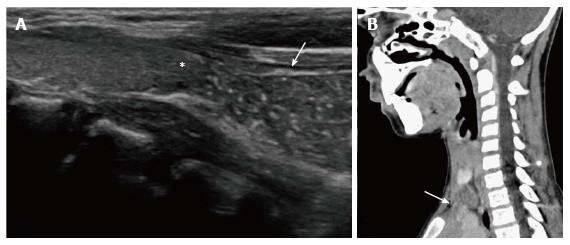
Figure 9 Cervical extension of the thymus in a 7-year-old male presenting with a lump in the neck.
USG (A) shows the characteristic “starry sky appearance” of the left lower cervical swelling (arrow) lying near the inferior pole of the left lobe of the thyroid (asterisk). CECT sagittal reformatted image (B) documents the anatomical contiguity (arrow) of this swelling with the mediastinal thymus.
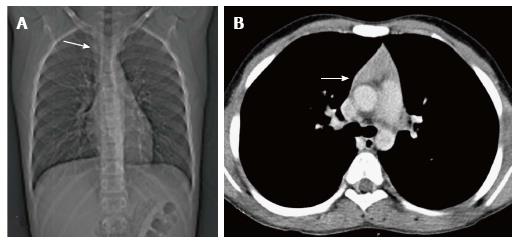
Figure 10 Thymic hyperplasia in a 12-year-old boy treated for Hodgkin’s lymphoma for 8 mo.
CT scanogram (A) shows subtle mediastinal widening (arrow). CECT axial section (B) shows mild thymic enlargement with convex margins and homogenous density (arrow) consistent with rebound hyperplasia.
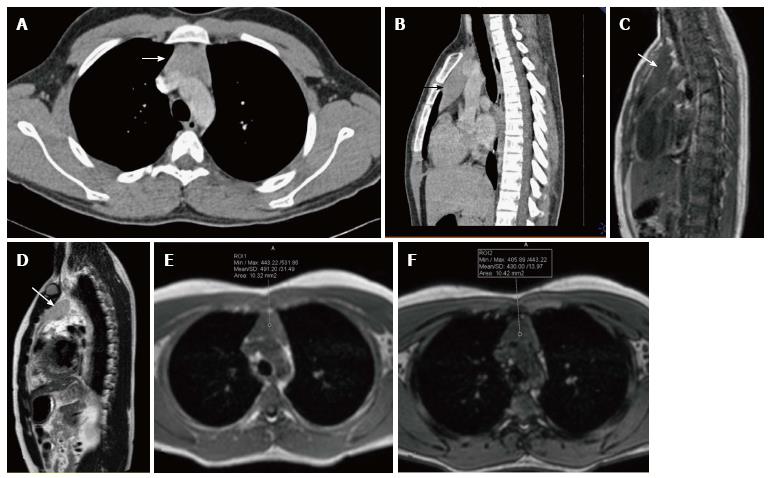
Figure 11 A 16-year-old male patient with myasthenia gravis.
CECT axial (A) and sagittal (B) sections showing mild diffuse symmetric enlargement of the thymus gland with a smooth contour (arrow in A and B). Sagittal T1WI (C) and T2WI (D) of the chest show that the thymus (arrow in C and D) is of homogenous signal intensity (isointense to skeletal muscle on T1WI and hyperintense on T2WI). Axial T1WI show a decrease in signal on opposed-phase image (F) when compared with in-phase image (E). The findings are consistent with thymic hyperplasia.
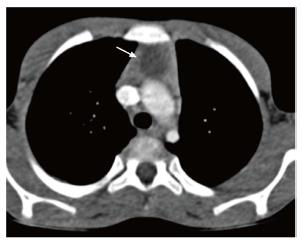
Figure 12 Thymic cyst in a 14-year-old boy treated for Hodgkin’s lymphoma.
CECT axial section reveals a small well-defined fluid-attenuating lesion (arrow) suggestive of cyst in the thymus.
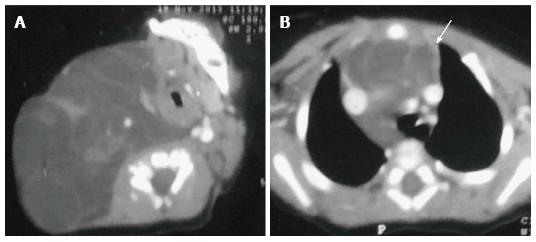
Figure 13 Thymic involvement by a large lymphatic malformation in a neonate diagnosed antenatally with cystic neck swelling.
A: Contrast-enhanced CT scan shows a large right-sided poorly circumscribed, multiloculated low attenuation mass in the infrahyoid neck with extension into the posterior cervical and retropharyngeal space; B: Axial sections at the level of origin of arch vessels reveal involvement of the thymus (arrow) by this mass and extension into the anterior and middle mediastinum.
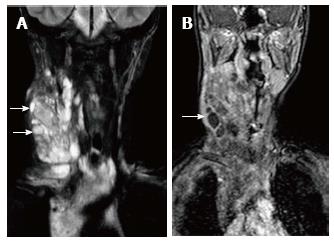
Figure 14 Lymphatic malformation in 13-year-old female patient.
Coronal T2WI (A) shows a large, multilocular cystic neck mass with multiple septations. The mass is extending into the superior and anterior mediastinum. Note the variable signal intensity in different locules (arrows). On coronal post contrast T1WI (B), there is enhancement of the wall and internal septations (arrow).
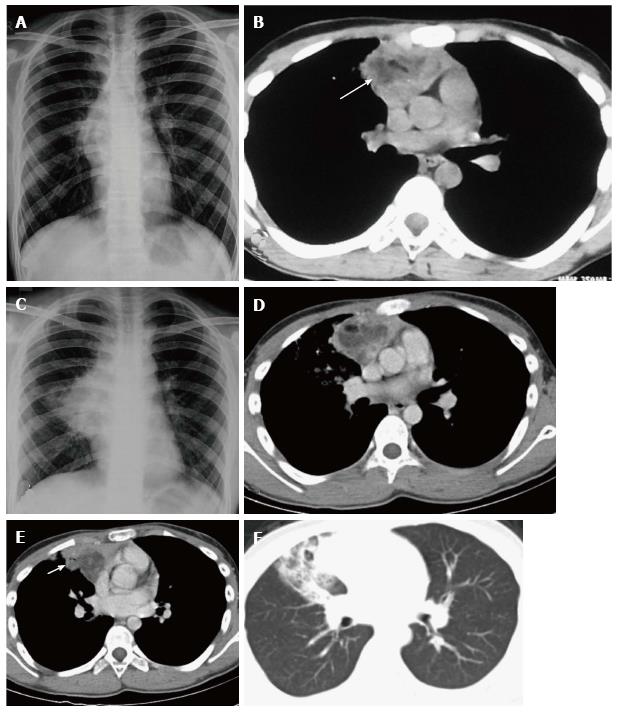
Figure 15 Ruptured anterior mediastinal teratoma in a 14-year-old male.
Chest radiograph (A) shows a lobulated soft tissue mass in the right hilar region with obscured inferior margin. CECT axial section (B) shows a heterogenous mass in the anterior mediastinum with soft tissue, fluid and fat suggestive of anterior mediastinal teratoma. The patient refused surgery and presented 5 mo later, with complaint of cough and expectoration of foul smelling material. Chest radiograph (C) shows a large right hilar mass with irregular margins and patchy consolidation in the adjacent right mid zone. CECT (D) also demonstrates the increase in the size of the mass and irregular margins. There is evidence of small air foci (arrow in E) within this mass with adjacent consolidation suggestive of rupture into the tracheobronchial tree. Axial CT lung window (F) shows the adjacent ground glass and consolidation in the right middle lobe.
Figure 16 Hodgkin lymphoma in a 12-year-old boy presenting with fever and weight loss for 6 mo.
CT scanogram (A) shows mediastinal widening (arrow) with lobulated contour. Axial CECT sections (B and C) reveal multiple, enlarged, homogenous lymph nodes in the region of the thymus (arrow in B and C) and paratracheal location (arrowhead in C). Note mild compression of SVC by this anterior mediastinal nodal mass (asterisk in B).
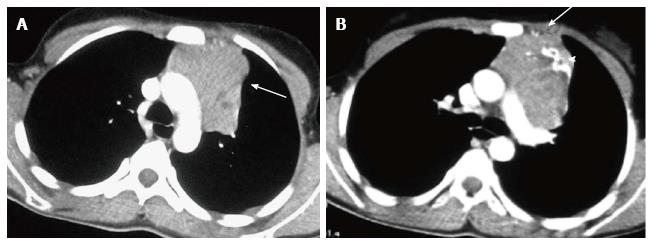
Figure 17 Invasive thymoma in a 13-year-old girl presenting with cough and chest pain.
CECT axial images reveal a heterogenously enhancing anterior mediastinal mass with irregular margins (arrow in A) and peripheral calcification (arrowhead in B). There is evidence of focal area of extension to subpleural region anteriorly (arrow in B).
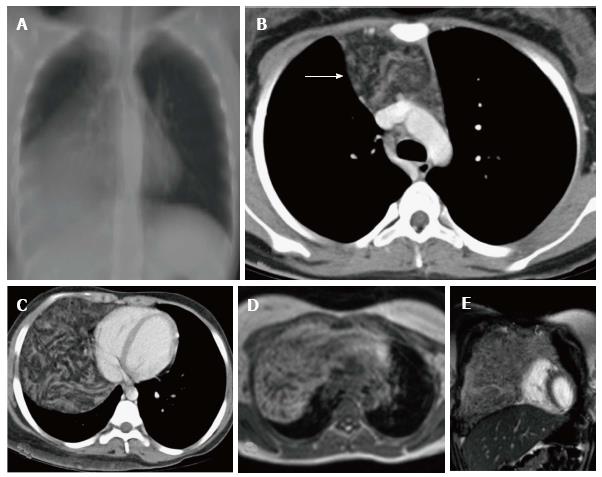
Figure 18 Thymolipoma in 17-year-old female.
Thick MPR (multiplanar reconstruction) in the coronal plane (A) shows a large anterior and middle mediastinal mass with low attenuation and sharp margins. CECT axial images (B and C) reveal a large anterior mediastinal mass lesion extending into the right hemithorax. The mass is predominantly of fat attenuation (arrow in A). Note that there is no displacement of the heart or great vessels. Axial T1WI (D) and coronal T2WI (E) show a large heterogenous fat containing mass with intervening fibrous septa. The mass has predominantly hyperintense signal on T1WI and intermediate signal on T2WI consistent with fat.
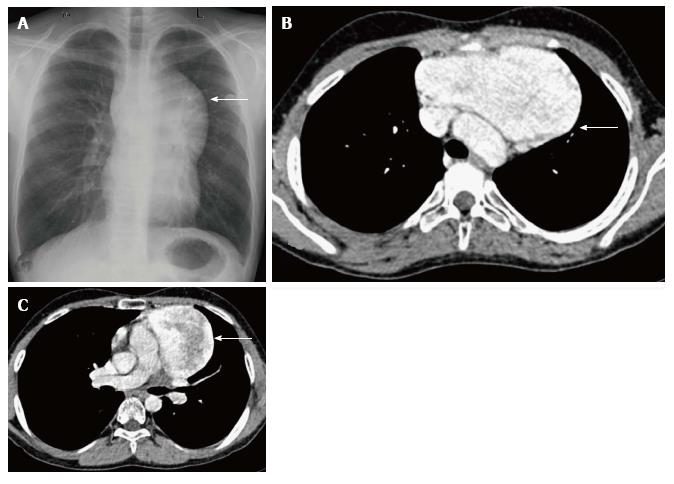
Figure 19 Incidentally detected cavernous hemangioma in 16-year-old male.
Frontal chest radiograph (A) reveals a well-defined, lobulated soft tissue density mass (arrow) with broad base towards the mediastinum and positive hilum overlay sign. CECT axial sections (B and C) show a sharply marginated mass lesion (arrow in B) anterior to the arch of the aorta. Note the intense post contrast enhancement with central heterogeneity (arrow in C).
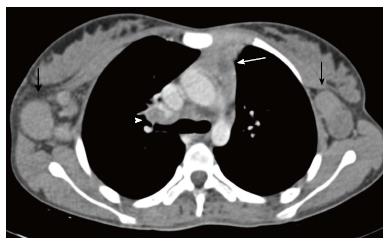
Figure 20 Tuberculosis in a 12-year-old girl presenting with fever and loss of weight and appetite for 3 mo.
CECT axial section reveals heterogenous appearance of the thymus with central low attenuation areas (arrow). There is presence of necrotic right hilar lymph node (arrowhead) and enlarged bilateral axillary lymph nodes (black arrows).
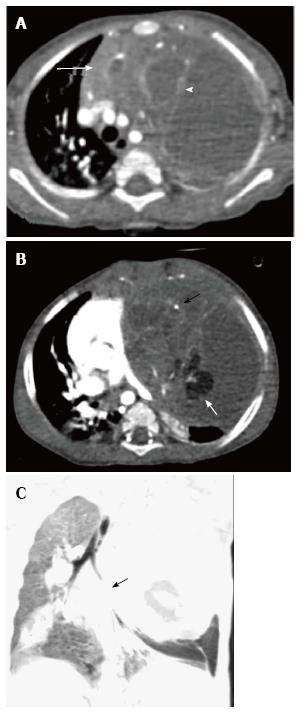
Figure 21 Immature teratoma in a 1-year-old boy.
CECT axial sections (A and B) reveal a large cystic mass in the anterior mediastinum. The mass has enhancing solid component (arrow in A), internal septations (arrowhead in A), fat (white arrow in B), and calcific foci (black arrow in B). Note the mass effect on heart and mediastinal vascular structures. Coronal minimum intensity projection image (C) shows the narrowing of left lower lobe bronchus (arrow) and basal atelectasis.
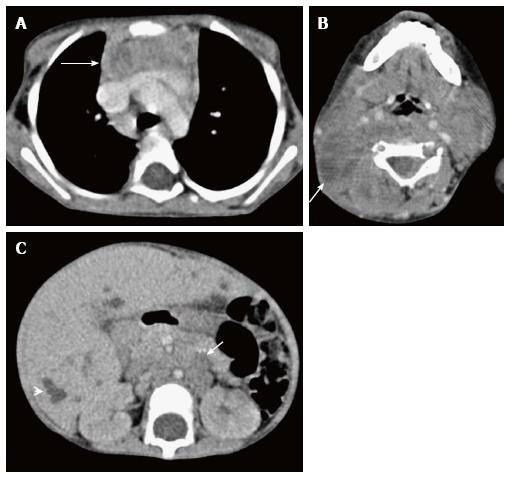
Figure 22 Thymic involvement in systemic Langerhans cell histiocytosis in a 2-year-old girl.
CECT axial section at the level of the arch of the aorta (A) shows heterogenous appearance of the thymus with a nodular outline (arrow). Axial section of the suprahyoid neck (B) shows multiple bilateral enlarged lymph nodes with cystic change (arrow). CECT of the abdomen (C) reveals hepatomegaly with multiple small focal hypodense lesions (arrowhead) in both lobes of the liver and enlarged retroperitoneal lymph nodes (arrow).
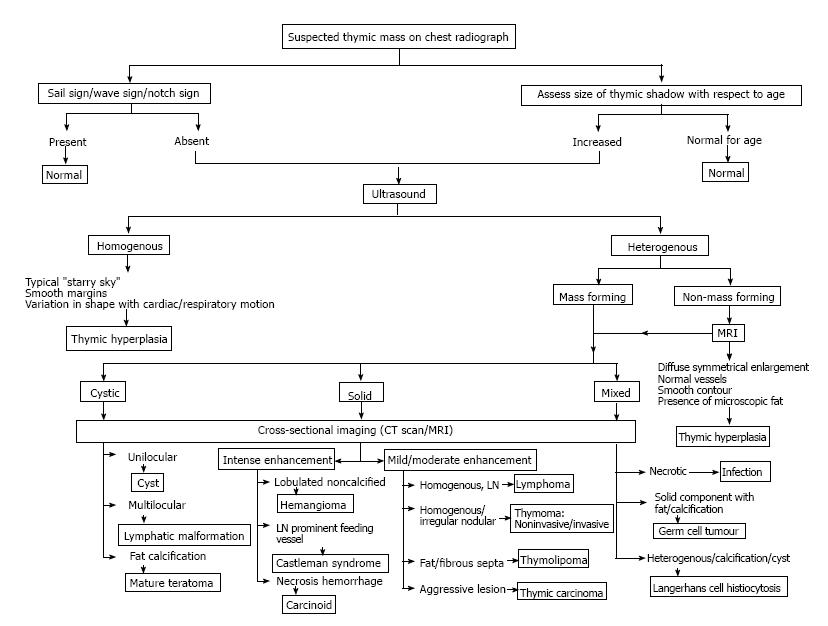
Figure 23 Imaging approach to the evaluation of a suspected thymic mass.
- Citation: Manchanda S, Bhalla AS, Jana M, Gupta AK. Imaging of the pediatric thymus: Clinicoradiologic approach. World J Clin Pediatr 2017; 6(1): 10-23
- URL: https://www.wjgnet.com/2219-2808/full/v6/i1/10.htm
- DOI: https://dx.doi.org/10.5409/wjcp.v6.i1.10


