Copyright
©2011 Baishideng Publishing Group Co.
World J Clin Oncol. May 10, 2011; 2(5): 229-236
Published online May 10, 2011. doi: 10.5306/wjco.v2.i5.229
Published online May 10, 2011. doi: 10.5306/wjco.v2.i5.229
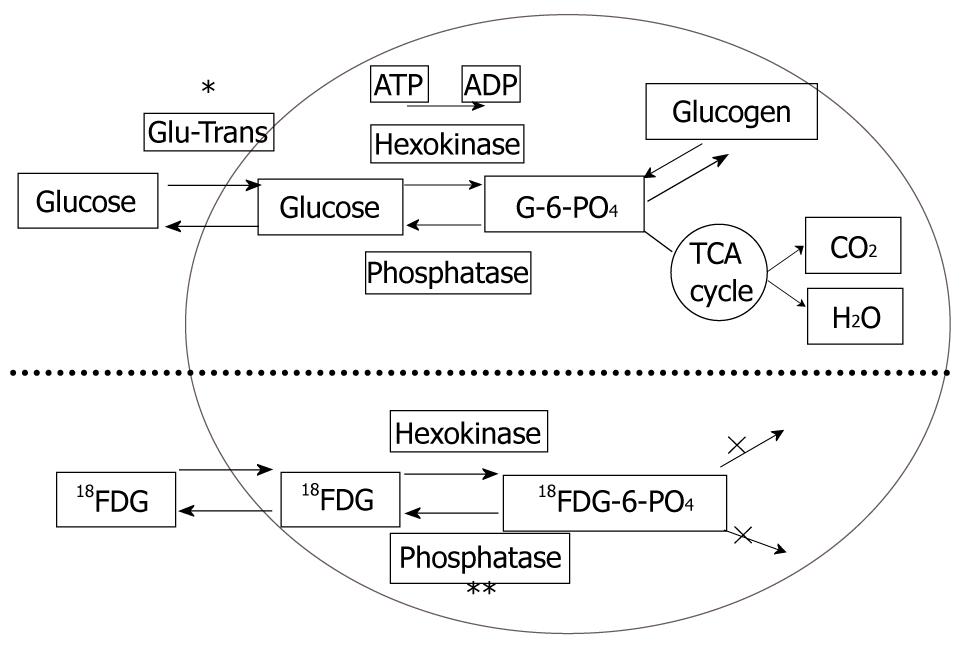
Figure 1 Schema of the metabolic pathway of glucose and 18-F-fluorodeoxyglucose in cells.
fluorodeoxyglucose has the same pathway as glucose up to the phosphorylation process, and does not progress further. Most malignant cells are known to have overexpression of the glucose transporter (*) and low activity of phosphatase(**).
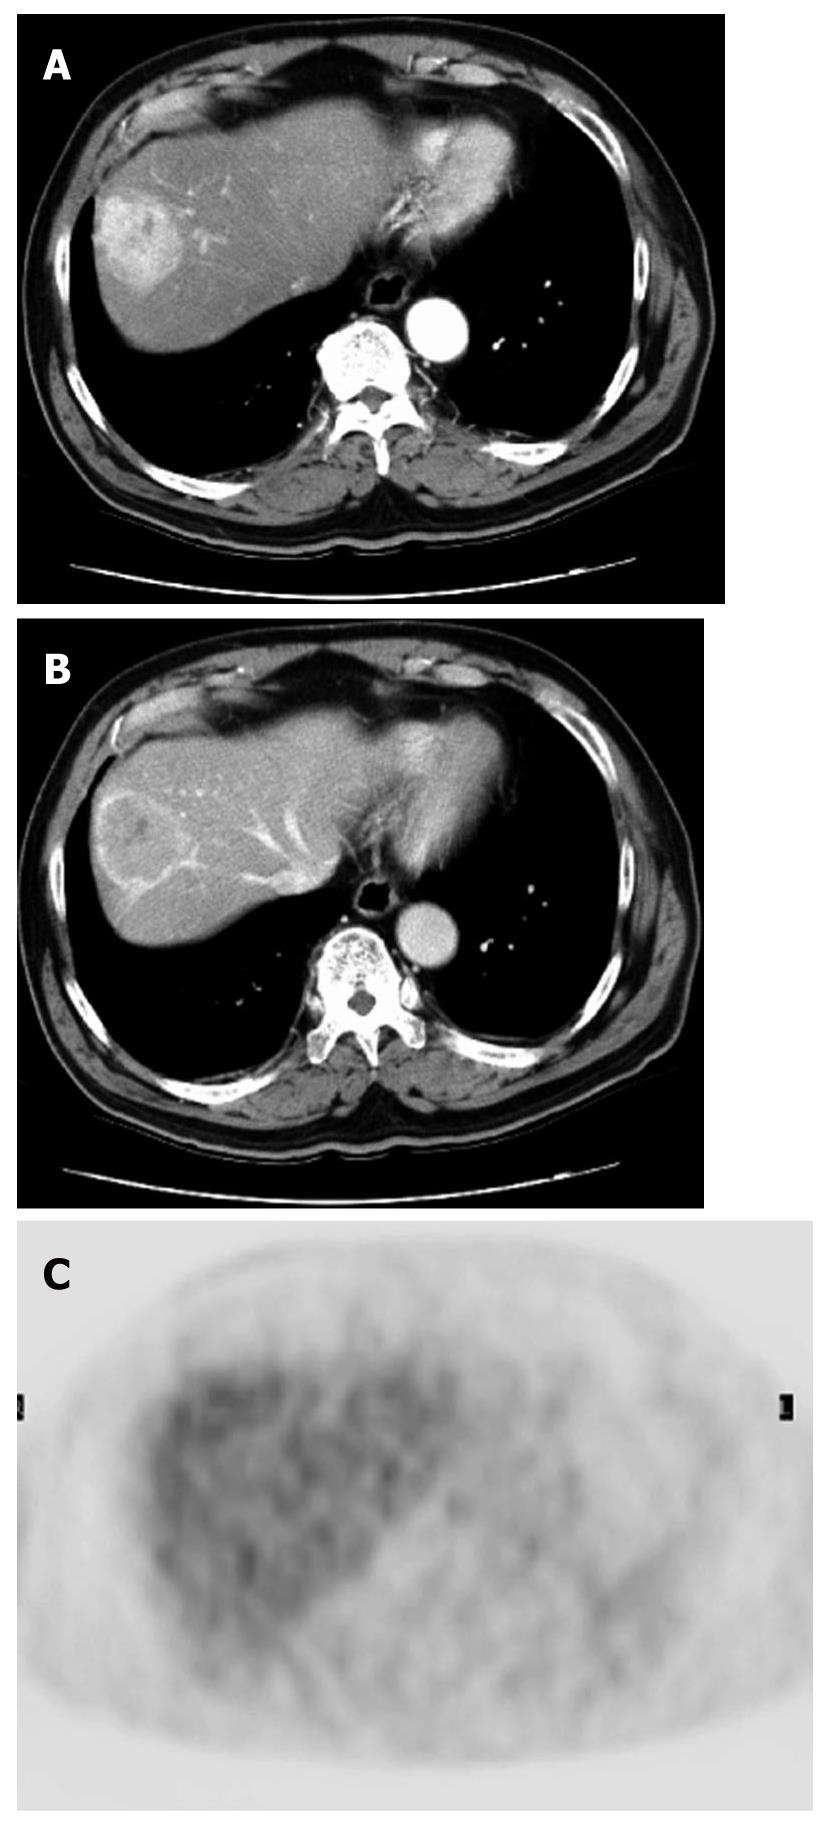
Figure 2 A case of well-differentiated hepatocellular carcinoma.
A, B: Arterial and portal phase of dynamic computed tomography. Typical enhancement pattern of hepatocellular carcinoma is shown; C: FDG-PET. There is no fluorodeoxyglucose uptake.
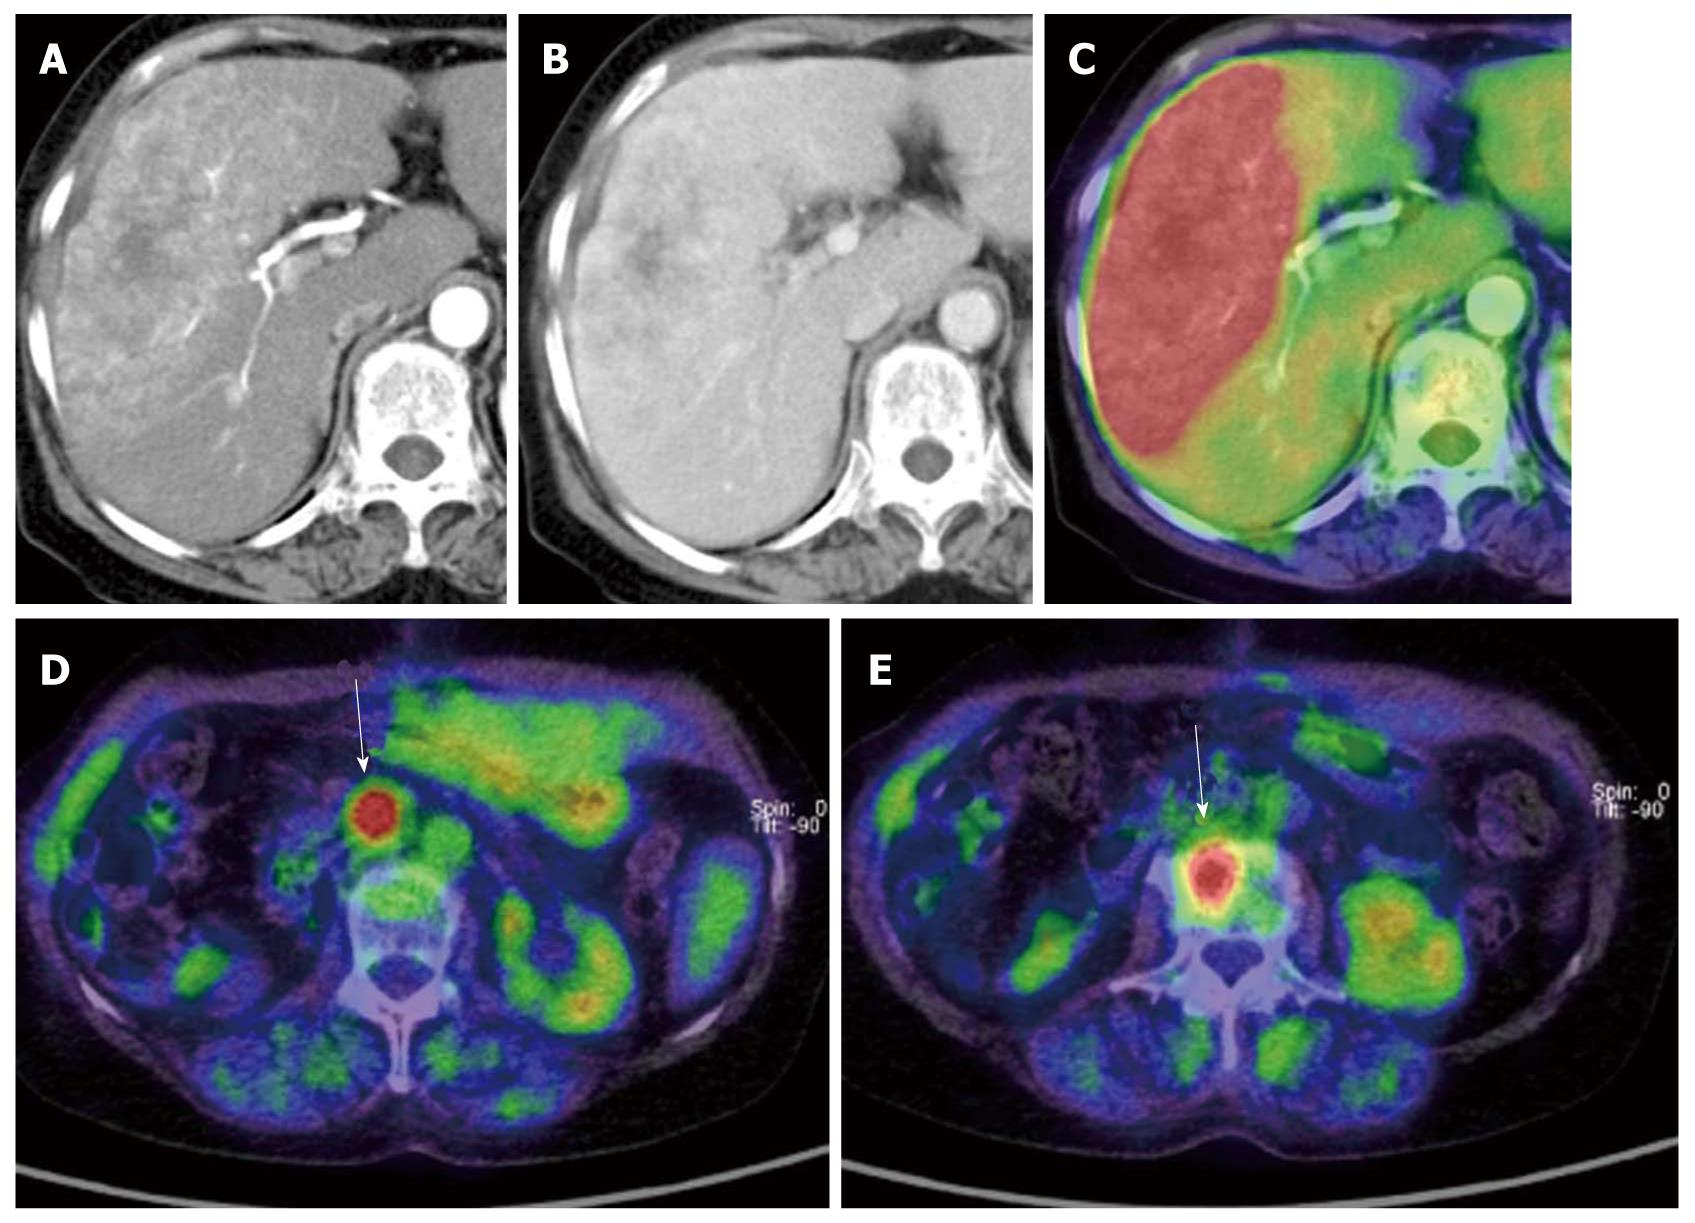
Figure 3 A case of mixed-type hepatocellular carcinoma with extrahepatic metastases.
A: Arterial phase of dynamic computed tomography (CT); B: Portal phase of dynamic CT. The tumor shows early enhancement which is a feature of hepatocellular carcinoma (HCC), although it also has a lobular border and delayed enhancement which are features of cholangiocellular carcinoma. Pathological diagnosis was mixed-type HCC; C: This type of HCC shows strong accumulation; D, E: This case also has lymph node and bone metastases (arrows).
Figure 4 A case of recurrent hepatocellular carcinoma after right lobectomy.
A, B: Arterial and portal phase of dynamic computed tomography (CT). Although tumor shadow was noted at the cut surface of the liver, it is difficult to determine recurrence due to poor enhancement; C: The tumor was diagnosed as recurrence of hepatocellular carcinoma because of strong fluorodeoxyglucose deposit (arrows).
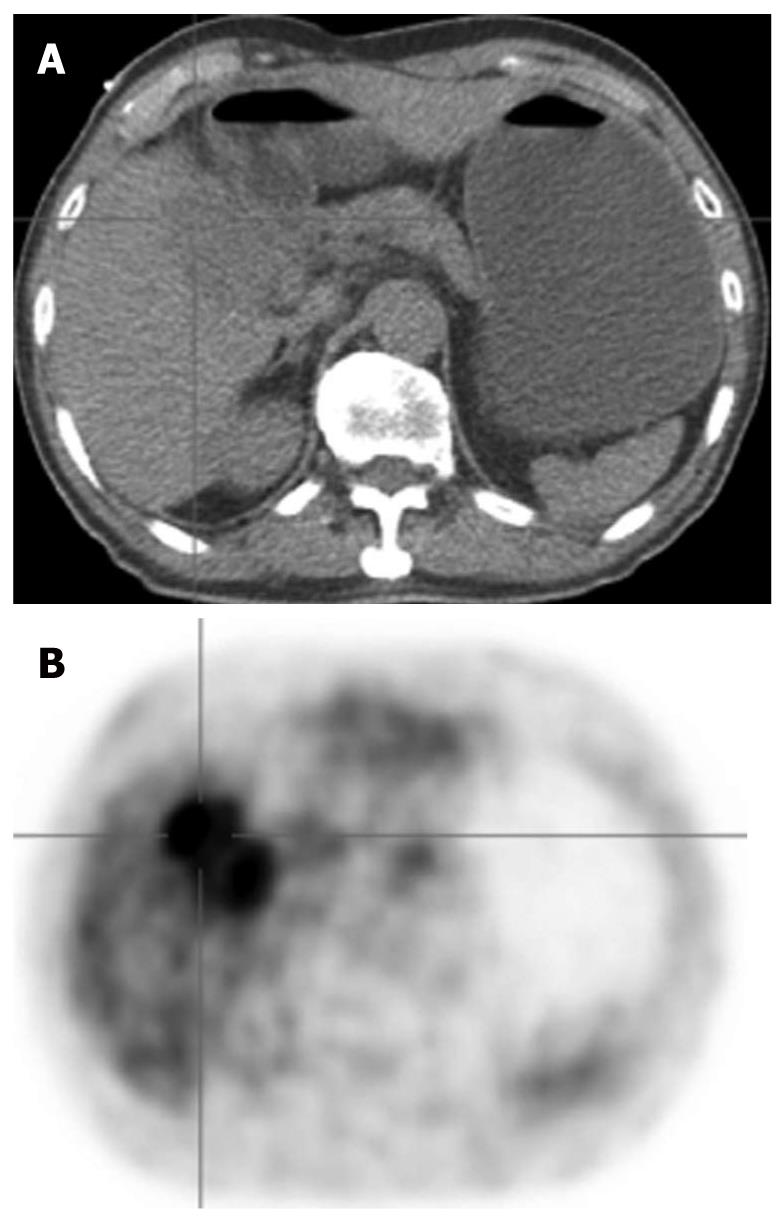
Figure 5 A case of cholangiocellular carcinoma.
A: Non-contrast computed tomography (CT) obtained by PET/CT (low-dose CT); B: FDG-PET. Cholangiocellular carcinoma is usually depicted as an FDG-avid tumor unlike hepatocellular carcinoma.
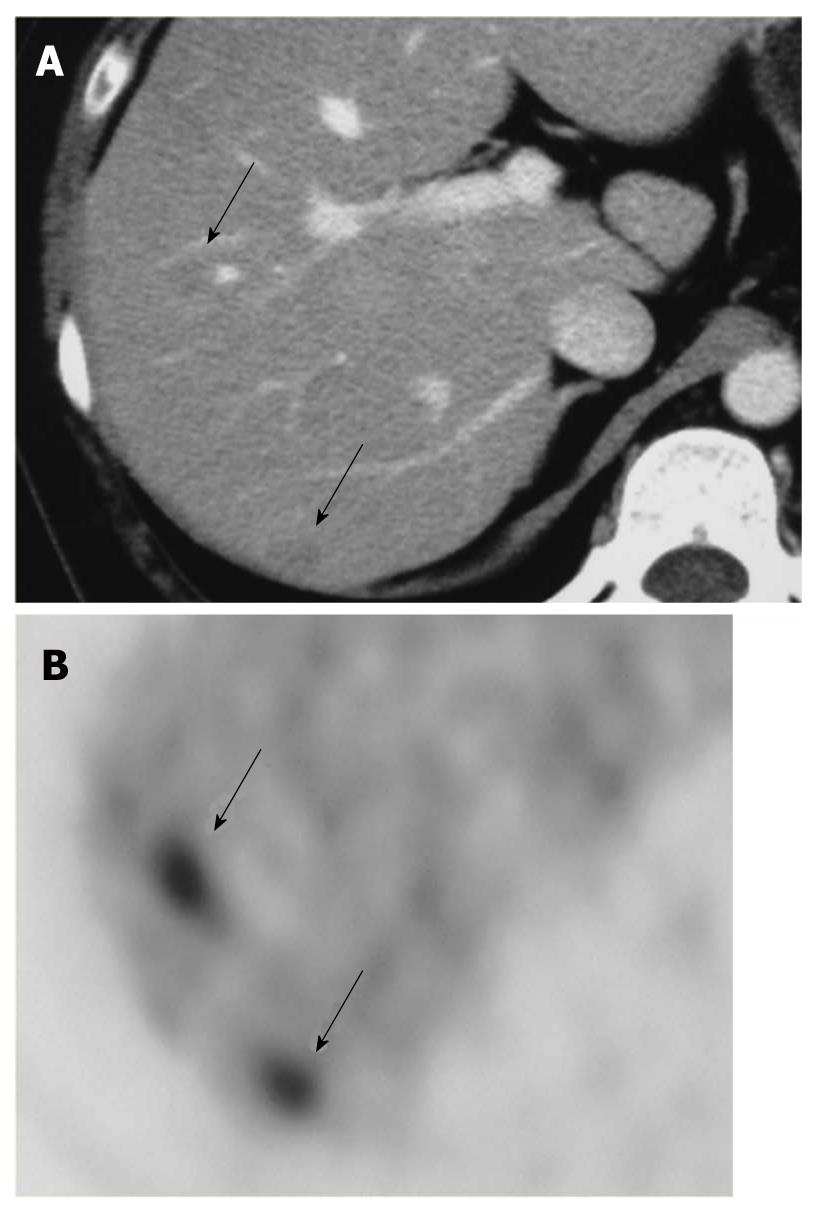
Figure 6 Liver metastases due to cervical cancer; A: CECT shows unclear low density areas in the liver (arrows).
B: FDG-PET clearly depicts two liver metastases (arrows).
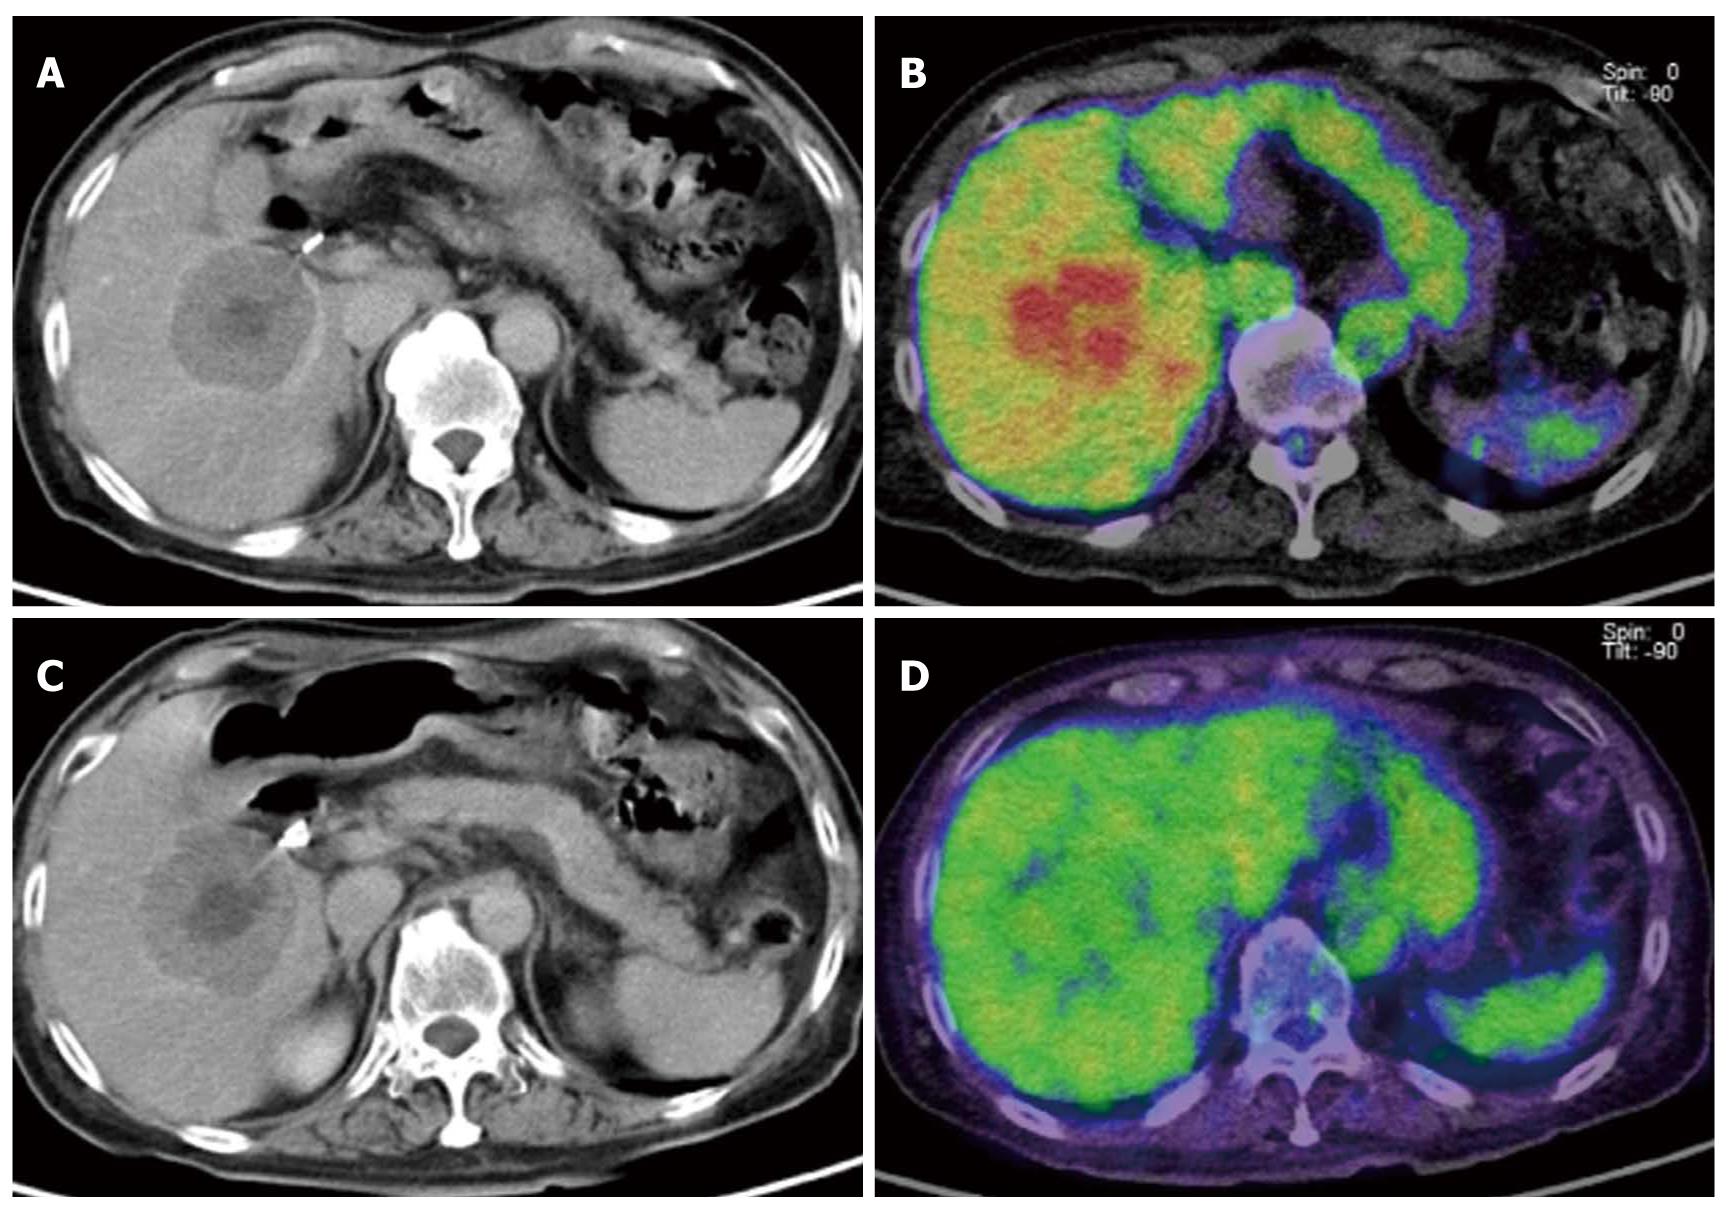
Figure 7 Monitoring therapeutic effect in liver metastases due to GIST gastrointestinal stromal tumor using Gleevec (imatinib mesylate).
A, B: Before chemotherapy. A: CECT demonstrated bull’s eye like low density in the liver, which was consistent with metastases; B: The metastatic tumor shown as an FDG-avid mass; C, D: After chemotherapy. (C) CECT shows similar mass before chemotherapy although (D) fluorodeoxyglucose (FDG) uptake significantly decreased. FDG-PET may more correctly reflect the therapeutic effect than CECT.
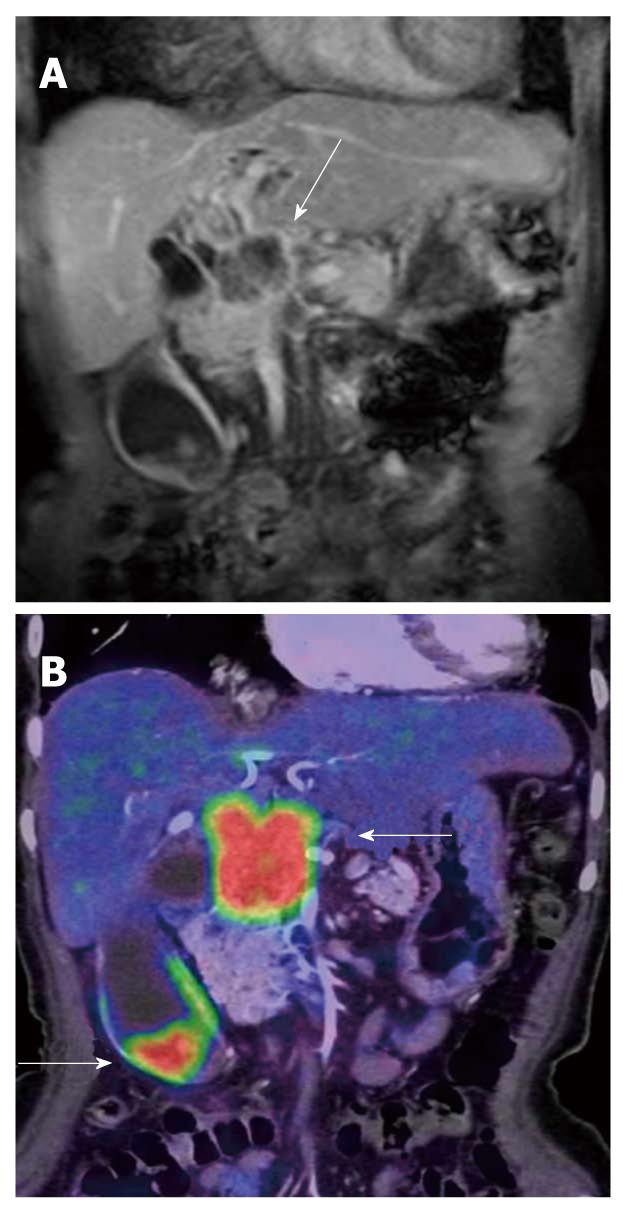
Figure 8 Gall bladder cancer with lymph node metastases near the pancreatic head.
A: CE-MRI (coronal section) shows poorly enhanced tumor near the pancreatic head (arrow). The tumor was thought to be a primary lesion at first; B: PET/CT (with CE) demonstrated two FDG-avid lesions (arrow). Gall bladder cancer and its metastases usually show strong FDG deposits.
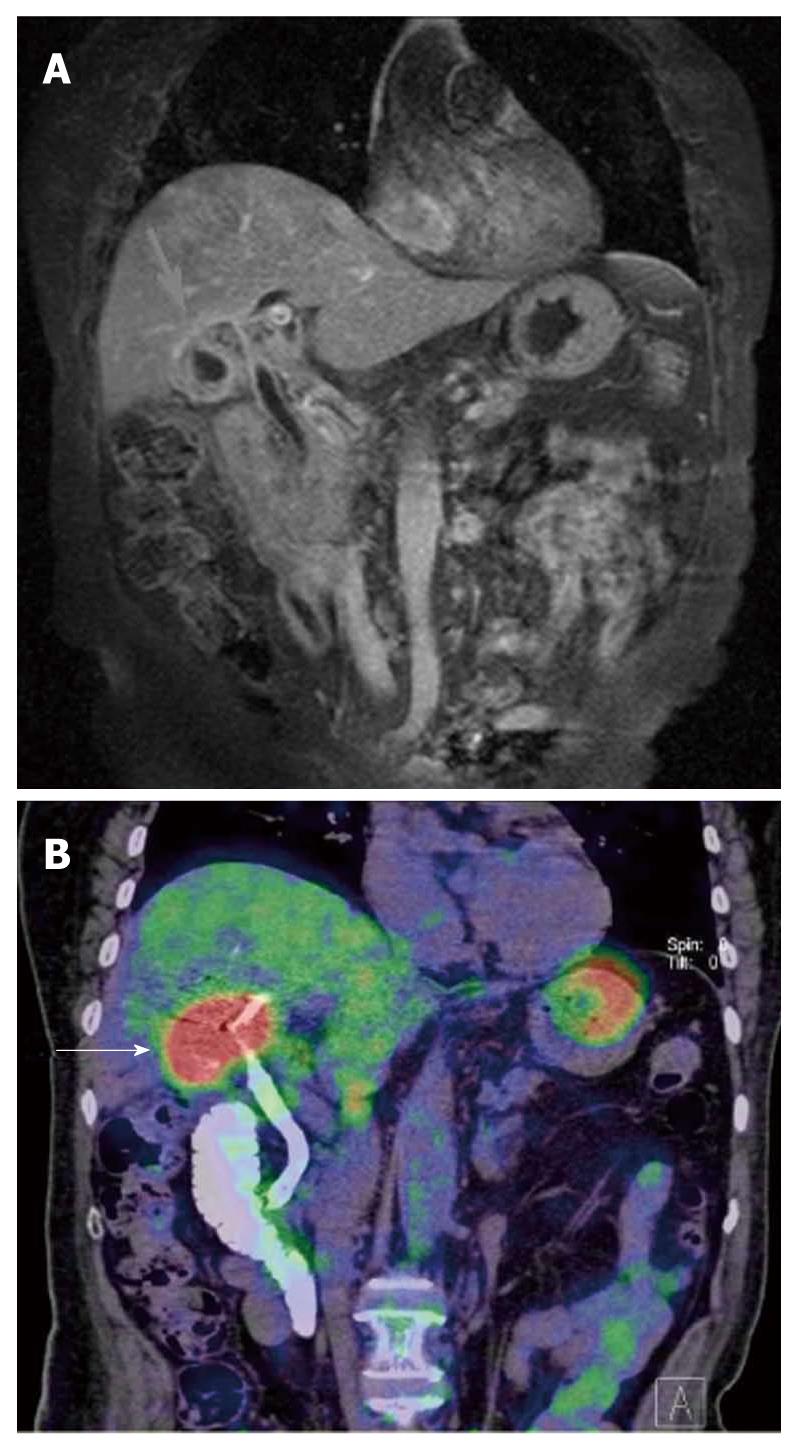
Figure 9 A case of acute cholecystitis.
A: CE-MRI (coronal section) shows irregular wall thickening of gall bladder (arrow) with hilar bile duct stenosis; B: PET/CT performed after PTC. Gall bladder shows strong FDG accumulation (arrow) although pathological diagnosis was acute cholecysitits. Discrimination between active inflammation and tumor is difficult using accumulation of fluorodeoxyglucose.
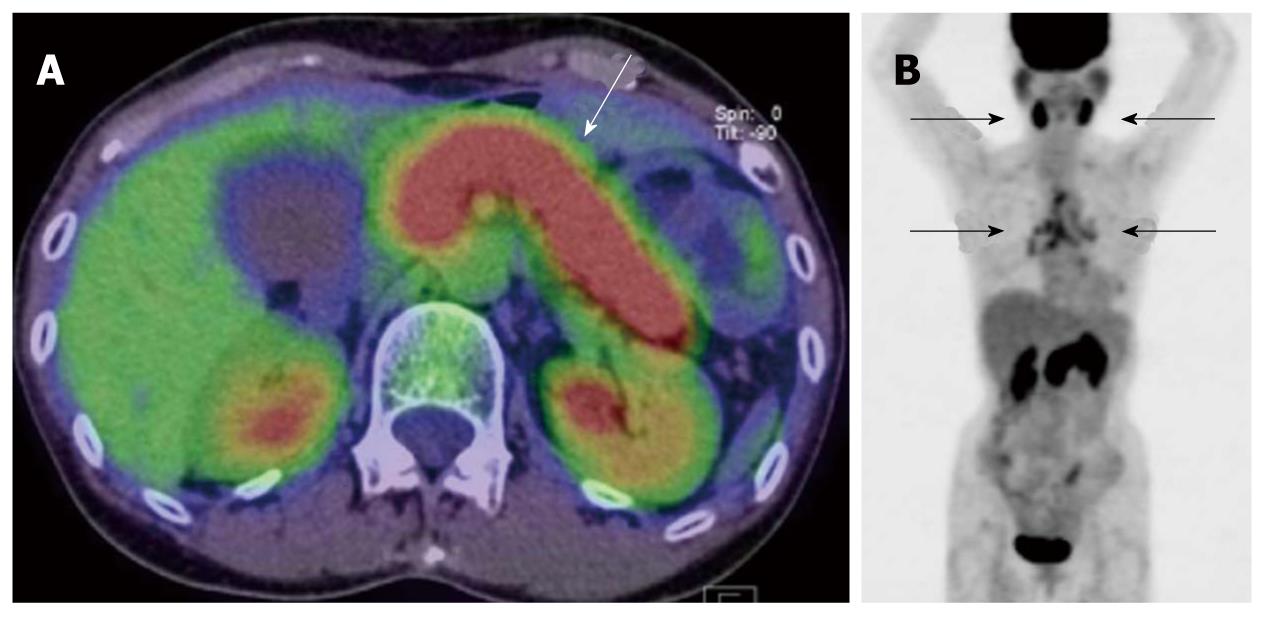
Figure 10 IgG4 related pancreatitis.
A: PET/CT shows strong fluorodeoxyglucose (FDG) accumulation in the whole pancreas with swelling (arrow); B: MIP image of PET. Besides diffuse uptake in the pancreas, symmetrical FDG deposits were noted in the bilateral salivary glands and hilar, mediastinal lymph nodes (arrows). Distribution in the involved organs is characteristic of this disease.
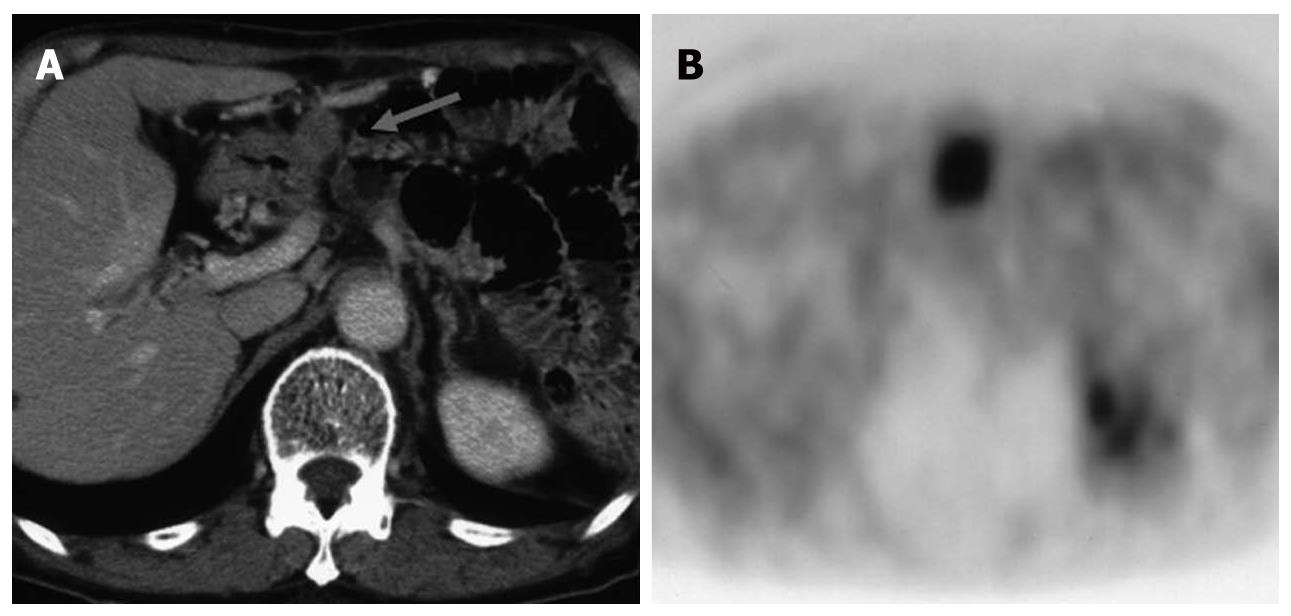
Figure 11 A case of elevated tumor marker after resection of pancreatic cancer.
A: Small nodule (arrow) was missed by initial CECT; B: PET detected the nodule much more clearly.
- Citation: Murakami K. FDG-PET for hepatobiliary and pancreatic cancer: Advances and current limitations. World J Clin Oncol 2011; 2(5): 229-236
- URL: https://www.wjgnet.com/2218-4333/full/v2/i5/229.htm
- DOI: https://dx.doi.org/10.5306/wjco.v2.i5.229


