
















Copyright: ©Author(s) 2026.
World J Clin Oncol. Oct 24, 2026; 17(10): 125453
Published online Oct 24, 2026. doi: 10.5306/wjco.125453
Published online Oct 24, 2026. doi: 10.5306/wjco.125453
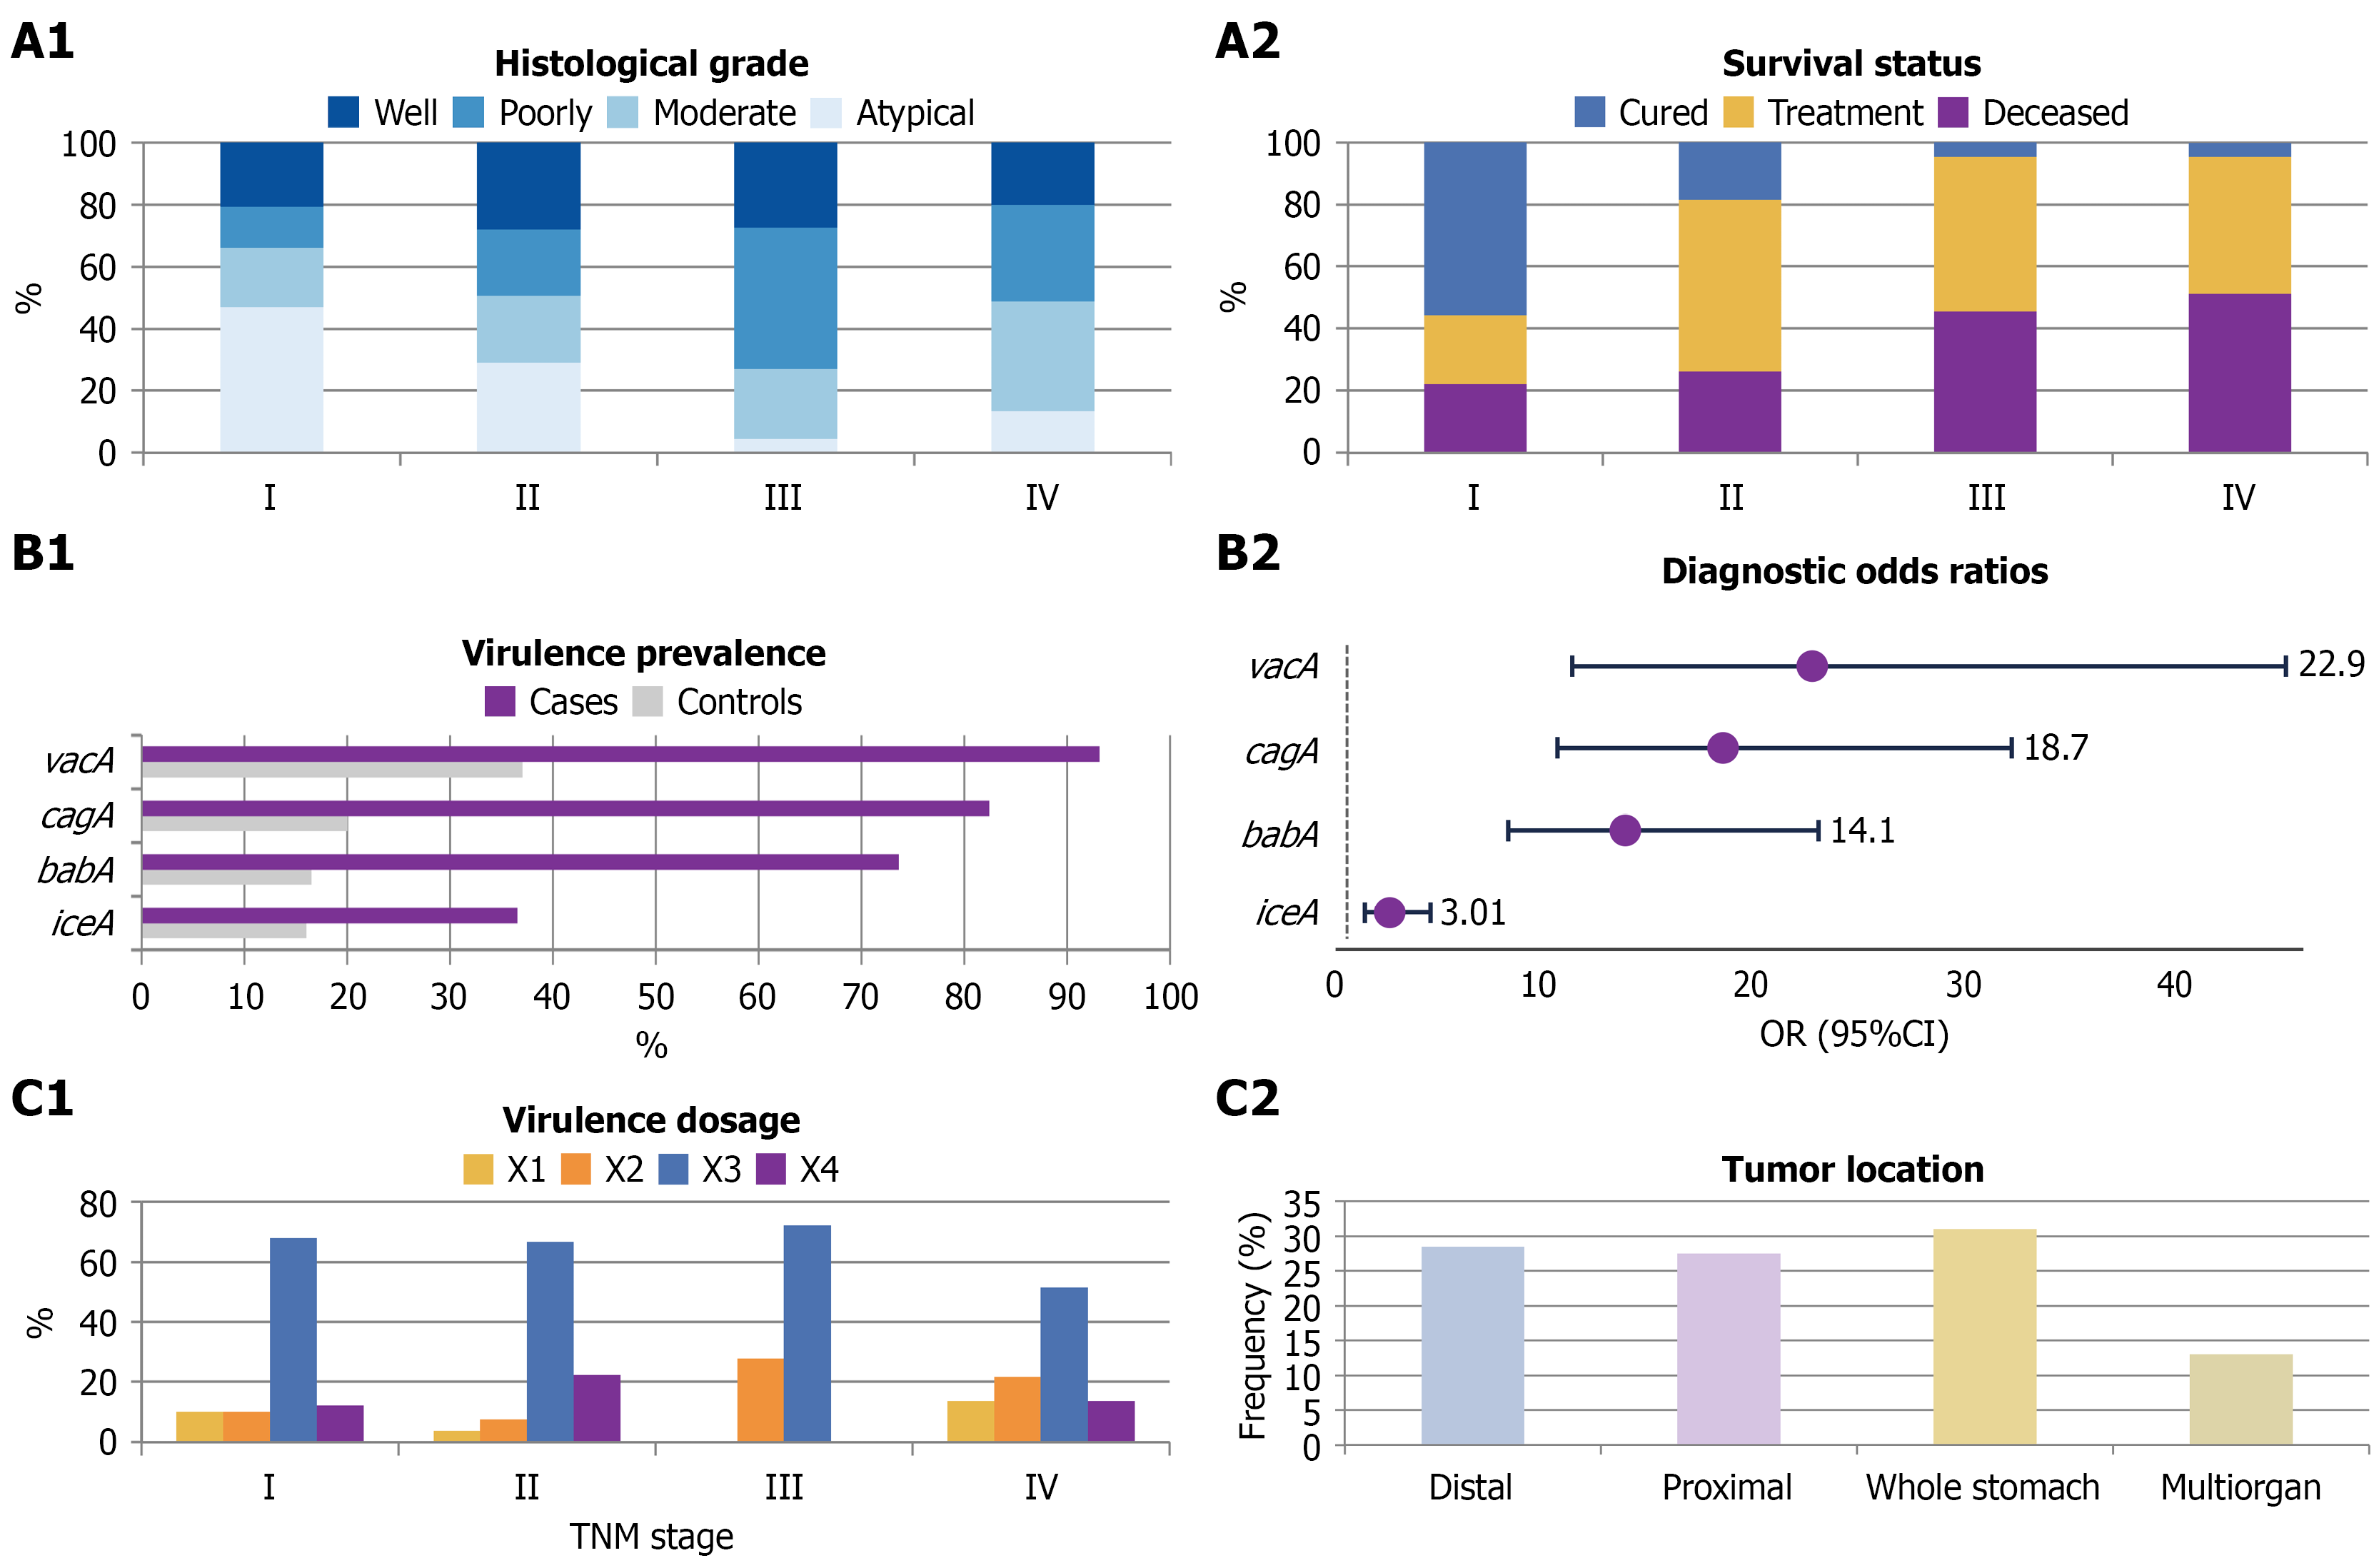
Figure 1 Clinicopathological and molecular profile of gastric cancer (n = 200).
A: Clinical progression (A1 and A2) demonstrates a stage-dependent movement toward poorer tumor differentiation (P = 0.001), accompanied by a pronounced reduction in cure rates from 55.9% in stage I to 4.4% in stage IV (P < 0.001); B: Virulence-associated risk (B1-B2) compares the distributions of Helicobacter pylori (H. pylori) genotypes in cases and controls. The strongest associations with malignancy are observed for the toxigenic factors, particularly vacuolating cytotoxin A [odds ratio (OR) = 22.9] and cytotoxin-associated gene A (OR = 18.7) (P < 0.001); C: Genomic complexity and anatomy. Panel C1 depicts stage-related differences in virulence-gene accumulation (P = 0.045): The quadruple genotype (X4) reaches its highest frequency in stage II, whereas the triple genotype (X3) occurs more frequently in advanced disease. Panel C2 presents the distribution of tumor anatomical location across four categories. Data shown in B1, B2, and C1 were obtained from the molecularly confirmed H. pylori-positive sub-cohort (n = 159) for identification of pathogen-specific risk factors. TNM: Tumor-node-metastasis; OR: Odds ratio; CI: Confidence interval.
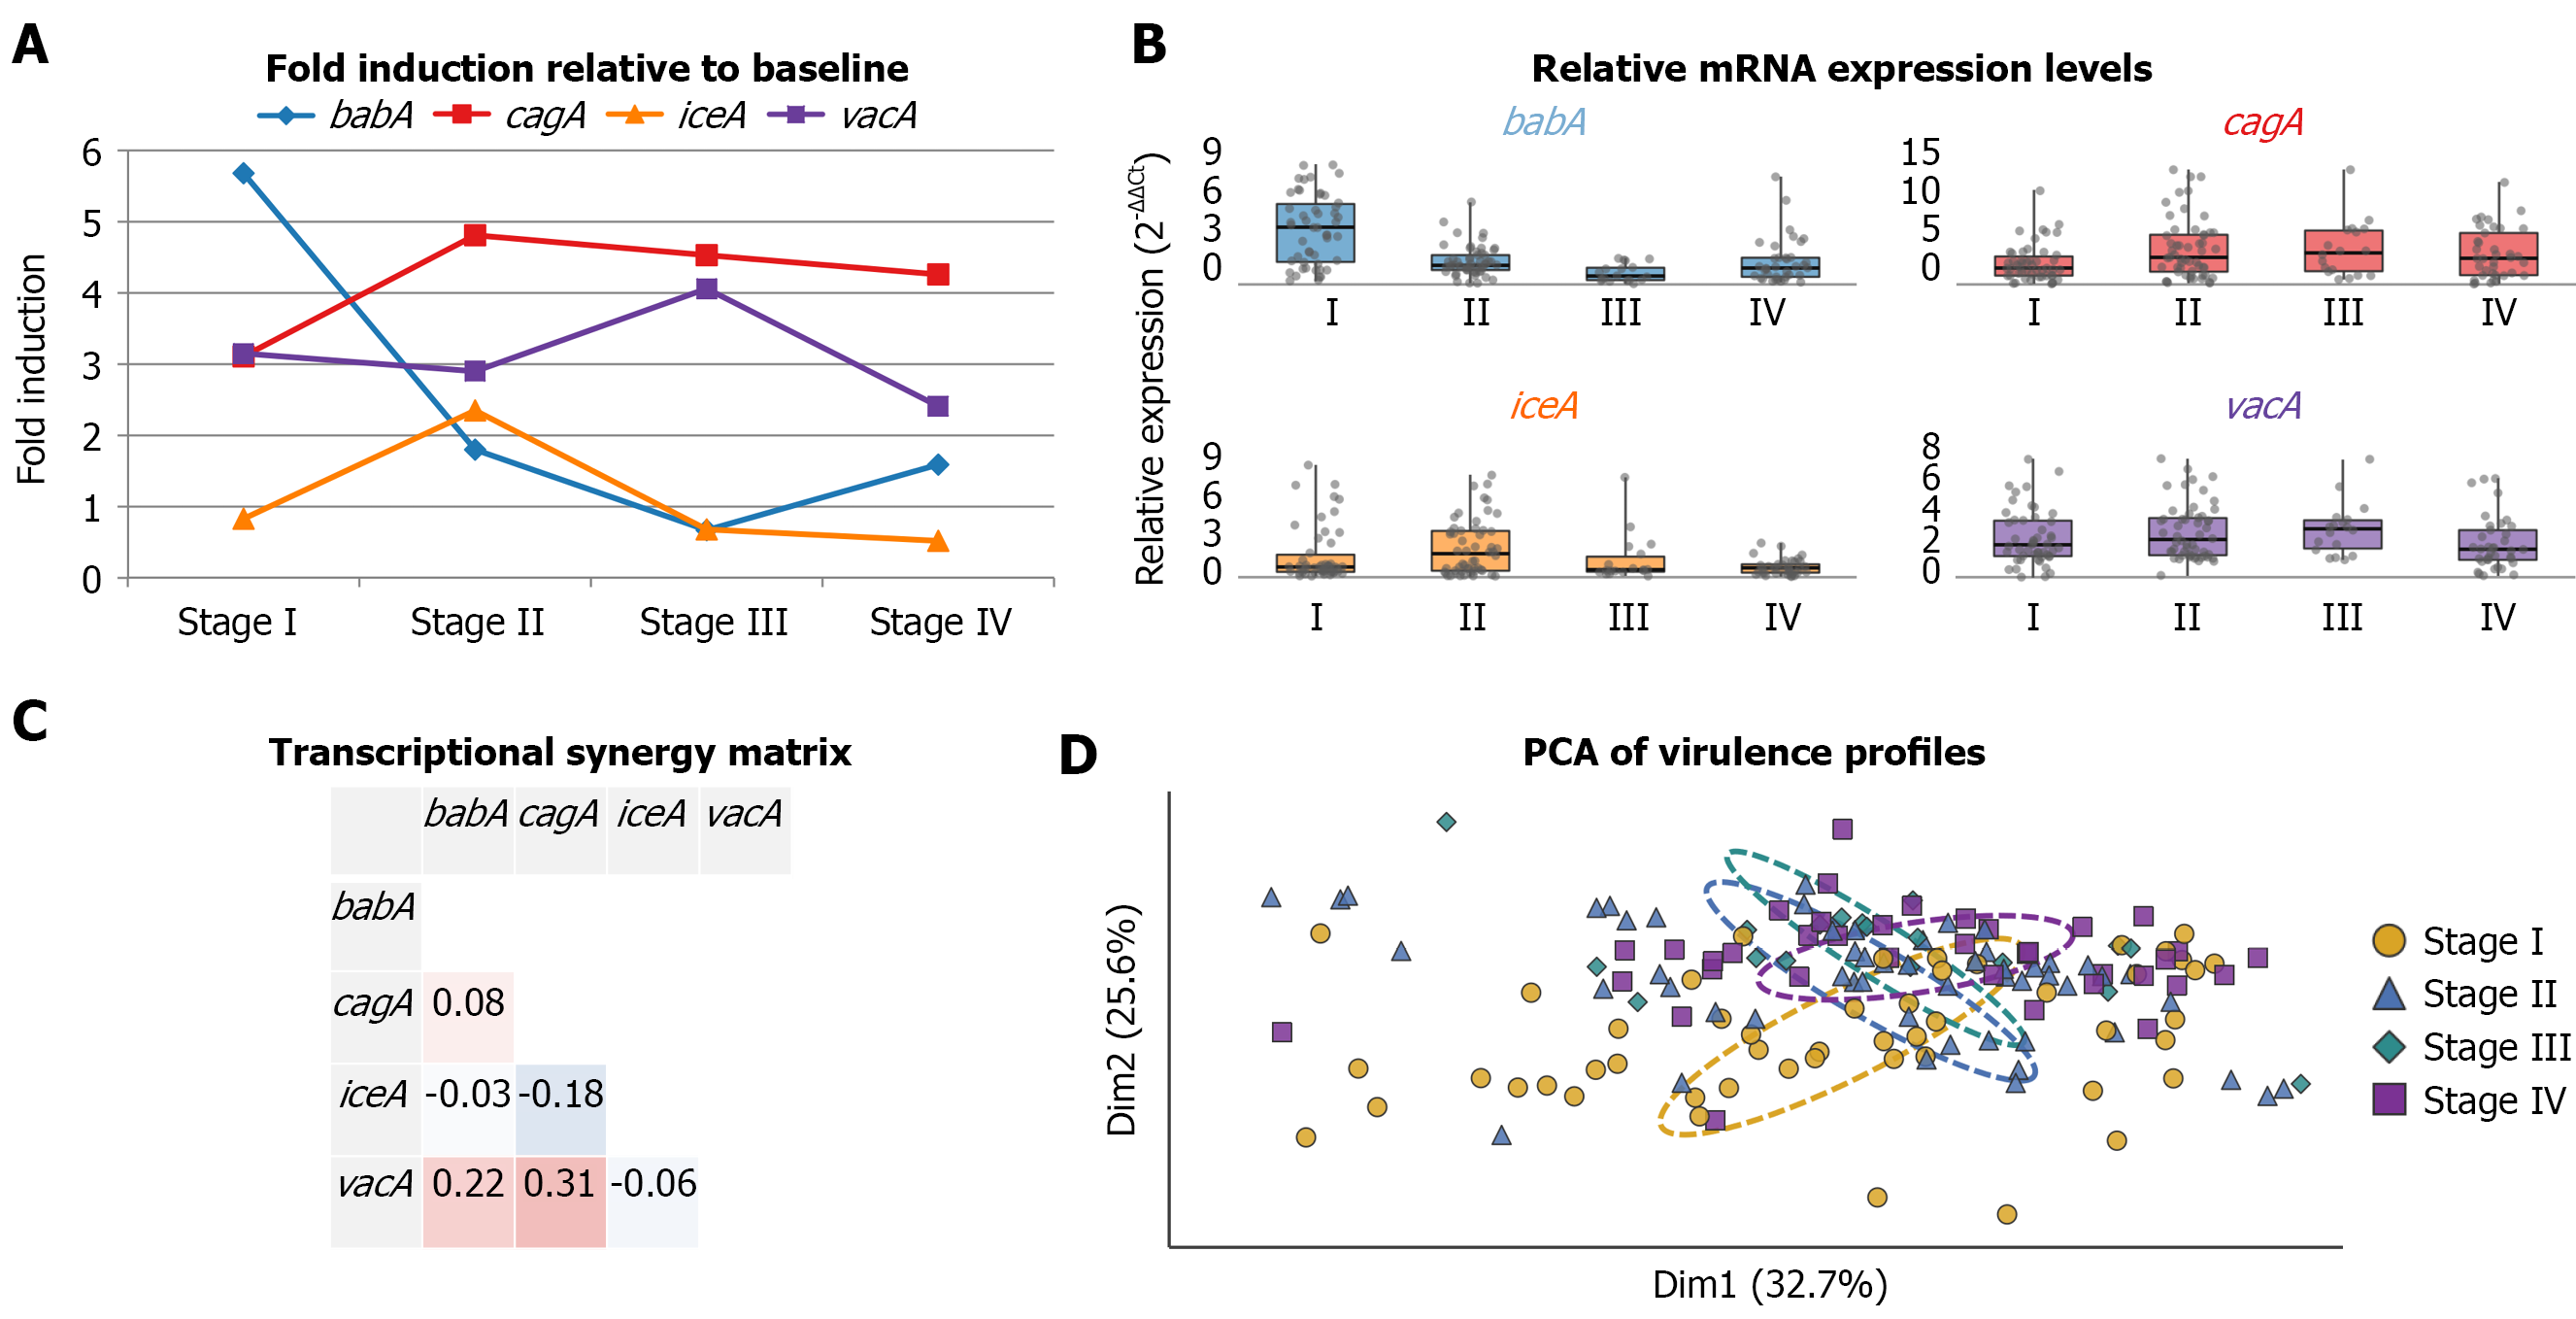
Figure 2 Transcriptional transition from bacterial adherence to host-cell invasion across clinical stages of gastric cancer.
A: Fold induction of major virulence transcripts relative to baseline expression in asymptomatic controls is shown, with the dashed horizontal line indicating y = 1. A distinct “crossover” is evident at stage II: Expression of the adhesin gene blood group antigen-binding adhesin A (babA) decreases, while cytotoxin-associated gene A (cagA) and vacuolating cytotoxin A (vacA), the toxigenic factors, become progressively upregulated; B: Relative mRNA expression of cagA, vacA, babA, and induced by contact with epithelium gene A according to stage. Values are expressed as 2-ΔΔCt; boxes indicate the interquartile range (IQR), horizontal lines indicate medians, and whiskers extend to 1.5 × IQR; C: The Spearman’s rank correlation matrix summarizes transcriptional relationships among virulence factors. Correlation coefficients (r) are represented by the color scale, including the significant positive relationship between cagA and vacA (r = 0.31); D: Principal component analysis of molecular profiles demonstrates progressive directional separation with 90% confidence ellipses, consistent with a global microbial-transcriptome shift from early-stage (stage I) to advanced (stage IV) gastric cancer. PCA: Principal component analysis; cagA: Cytotoxin-associated gene A; vacA: Vacuolating cytotoxin A; babA: Blood group antigen-binding adhesin A; iceA: Induced by contact with epithelium gene A.
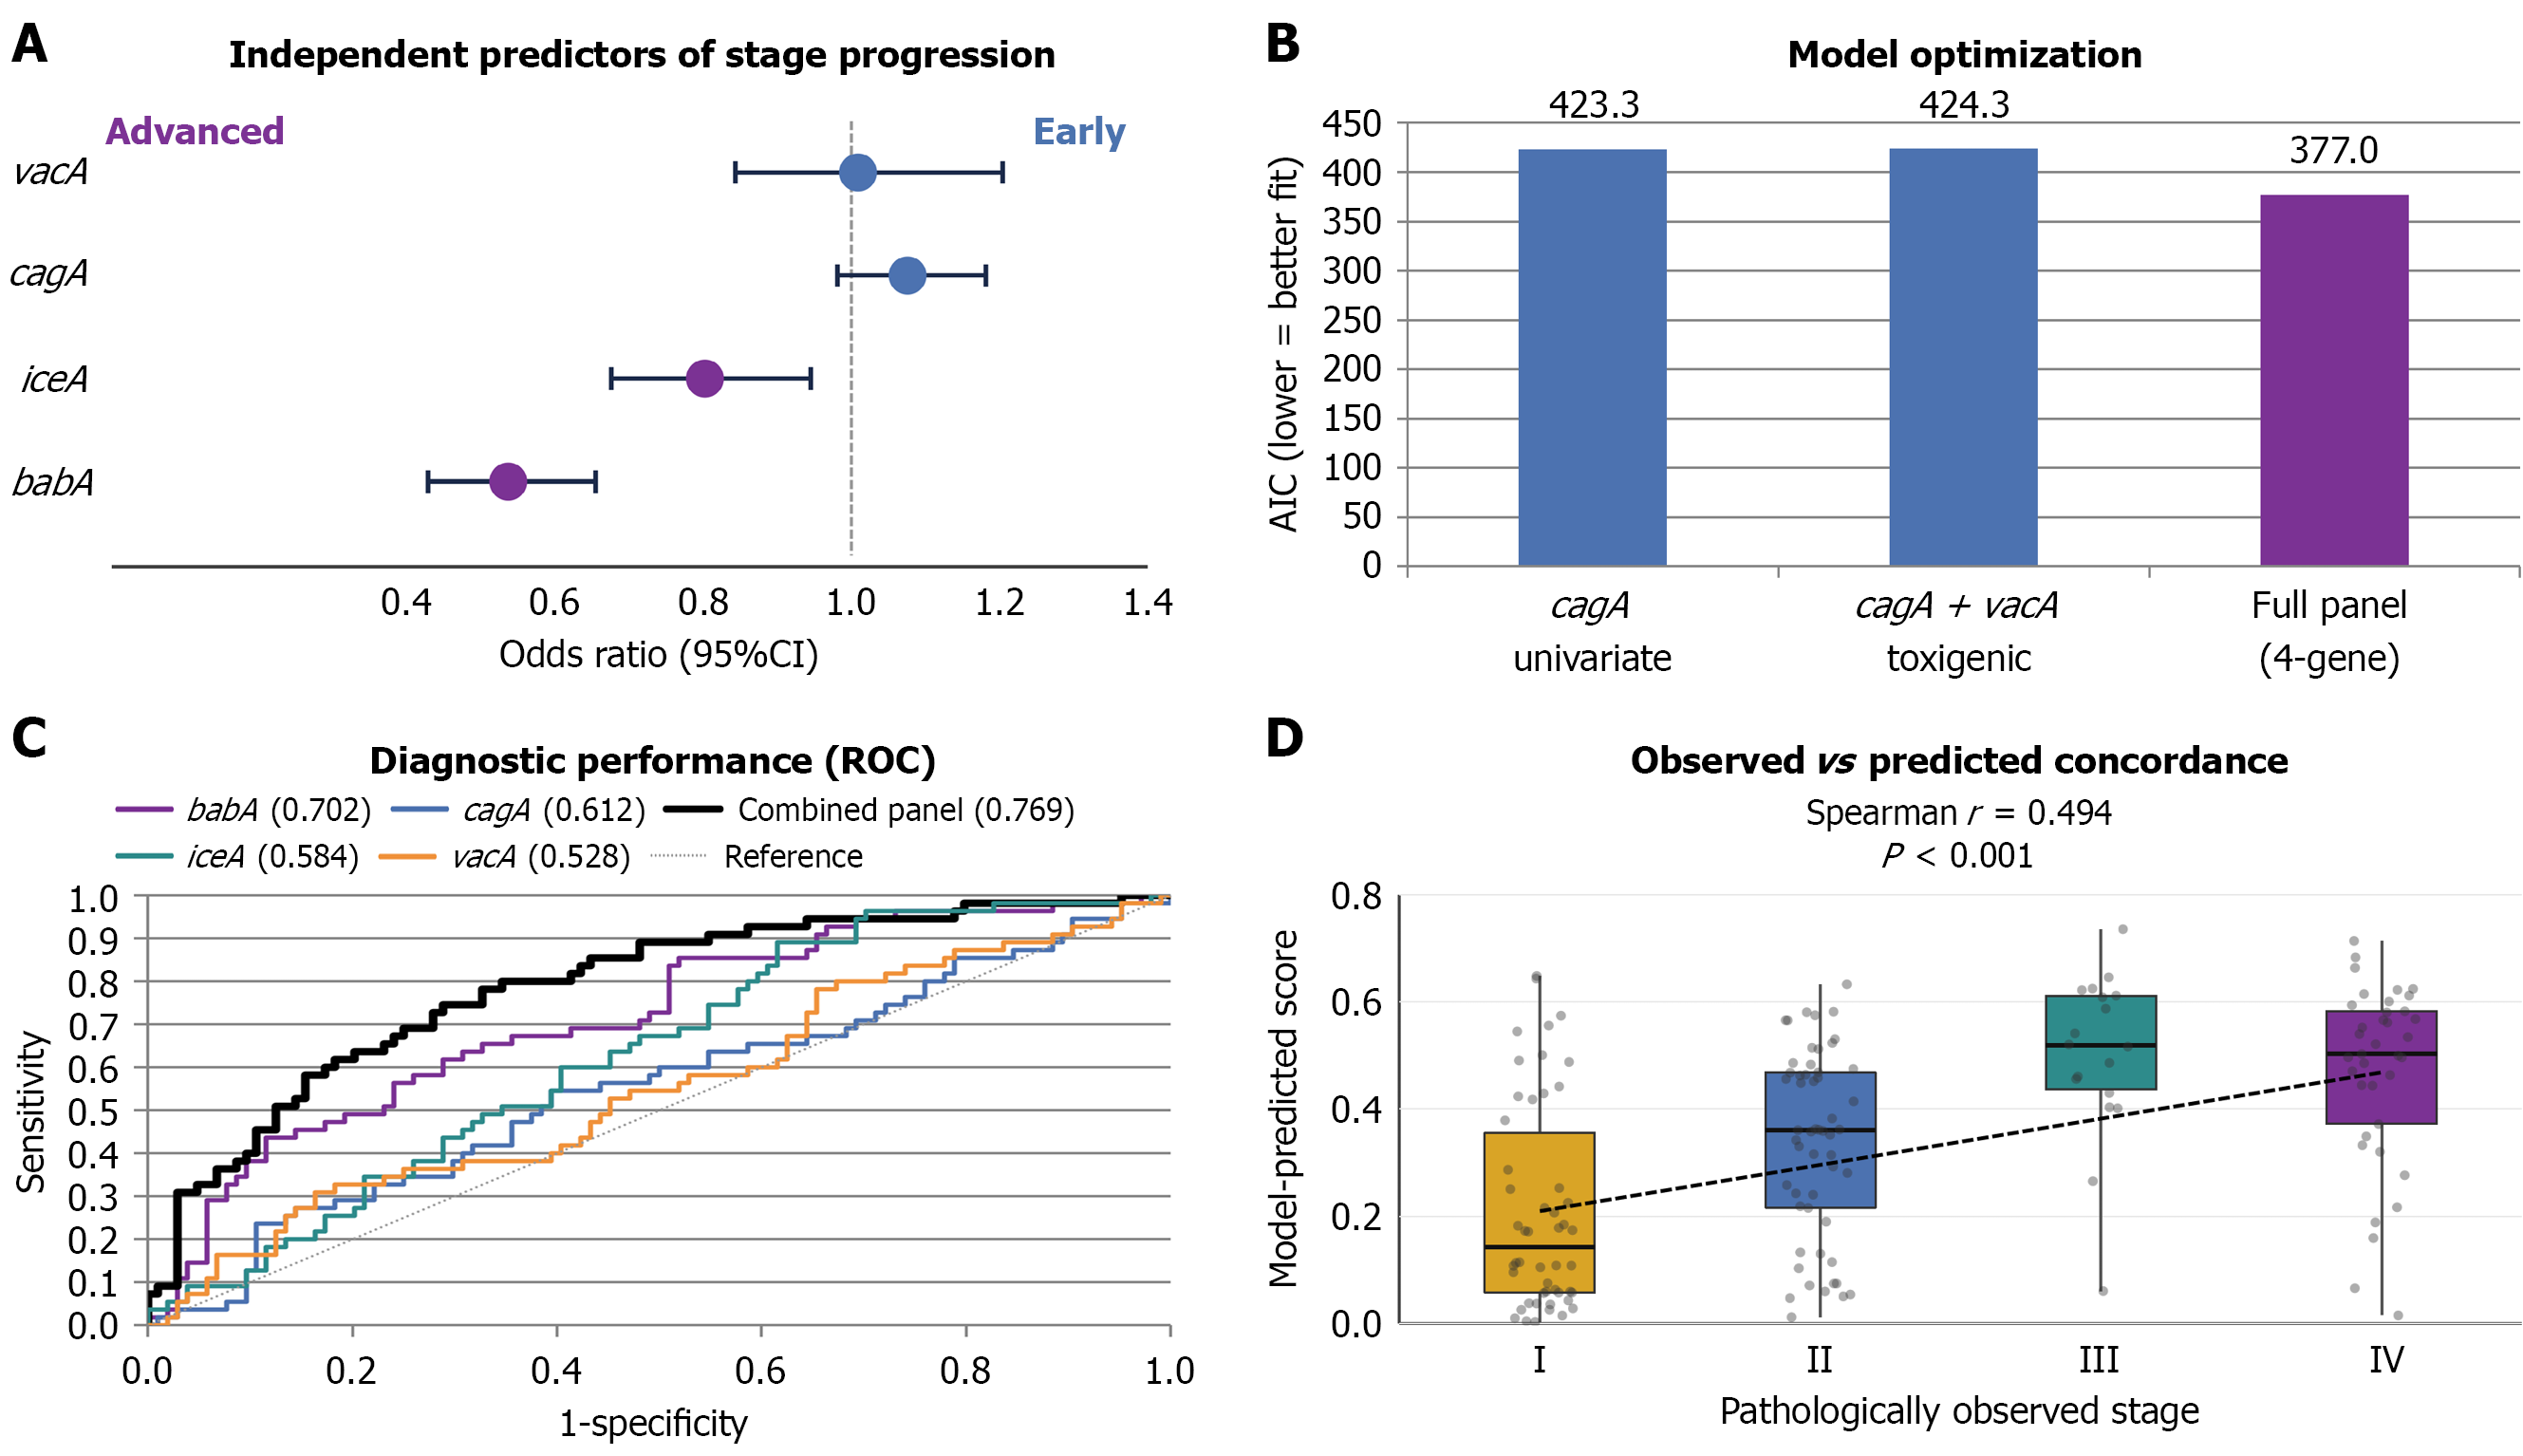
Figure 3 Validation and discriminative utility of the multigene transcriptional signature (n = 159).
A: Odds ratios (OR) with 95%CIs are displayed. Blood group antigen-binding adhesin A (babA) (OR = 0.536) and induced by contact with epithelium gene A (OR = 0.802) are the only independent discriminators of advanced-stage disease that reach statistical significance (purple markers, P < 0.05); B: Comparison of Akaike information criterion scores indicates superior fit for the full panel (377) relative to the univariate (423.3) and dual-toxin (424.3) models; C: Receiver operating characteristic analysis shows that the combined signature (thick black line) reaches an area under the curve of 0.769 (apparent; falling to 0.747 on pooled 5-fold cross-validation) and performs better than the individual markers; D: Boxplots show a significant relationship between pathological stage and transcriptional scores (Spearman r = 0.494, P < 0.001), with babA downregulation providing the strongest association. ROC: Receiver operating characteristic; cagA: Cytotoxin-associated gene A; vacA: Vacuolating cytotoxin A; babA: Blood group antigen-binding adhesin A; iceA: Induced by contact with epithelium gene A.
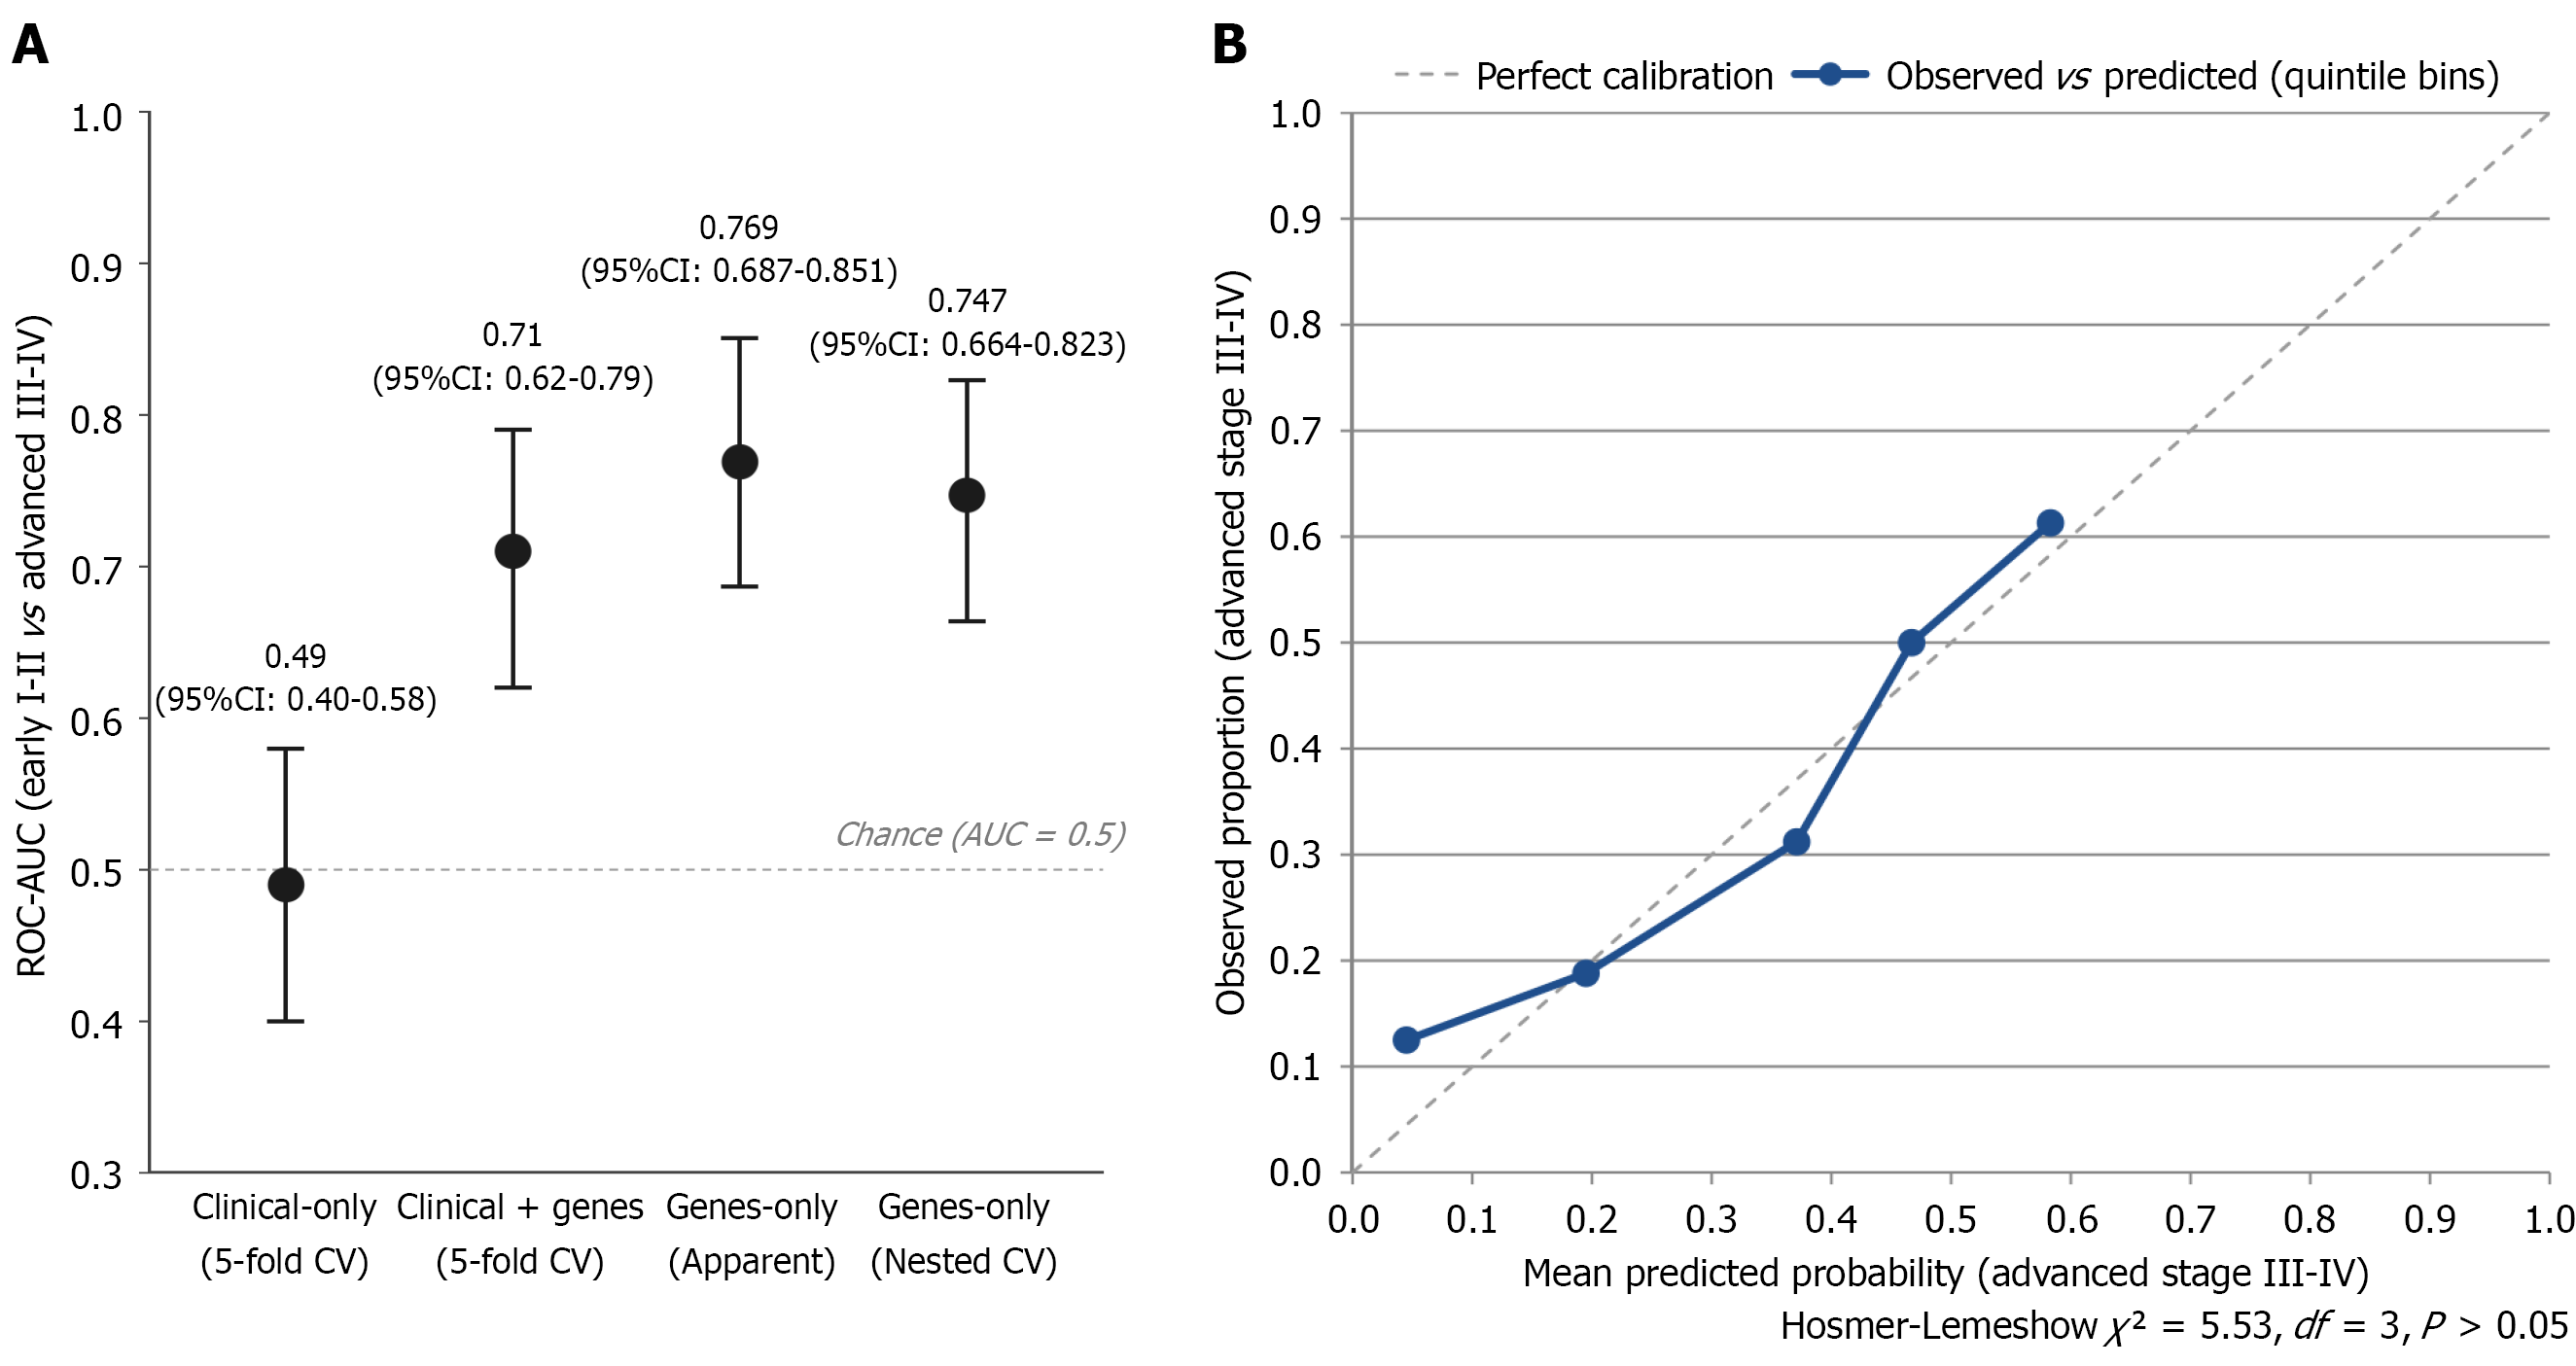
Figure 4 Discrimination, incremental value, and calibration of the combined four-gene transcriptional signature (n = 159).
A: Discrimination across model specifications was evaluated using receiver operating characteristic area under the curve (AUC) for distinguishing early (stages I-II) from advanced (stages III-IV) cases. The four-gene panel alone achieved AUC = 0.747 (cross-validated), vs AUC = 0.49 for the clinical-variables-only model. The dotted reference line represents chance-level discrimination (AUC = 0.5); B: Calibration assessed by comparing the observed proportion of advanced-stage (III-IV) cases to the mean model-predicted probability across five equal-sized bins of pooled out-of-fold predicted probabilities. The dashed diagonal line indicates perfect calibration. Calibration was adequate (Hosmer-Lemeshow χ2 = 5.53, df = 3, P > 0.05). AUC: Area under the curve; ROC: Receiver operating characteristic; CV: Cross-validation.
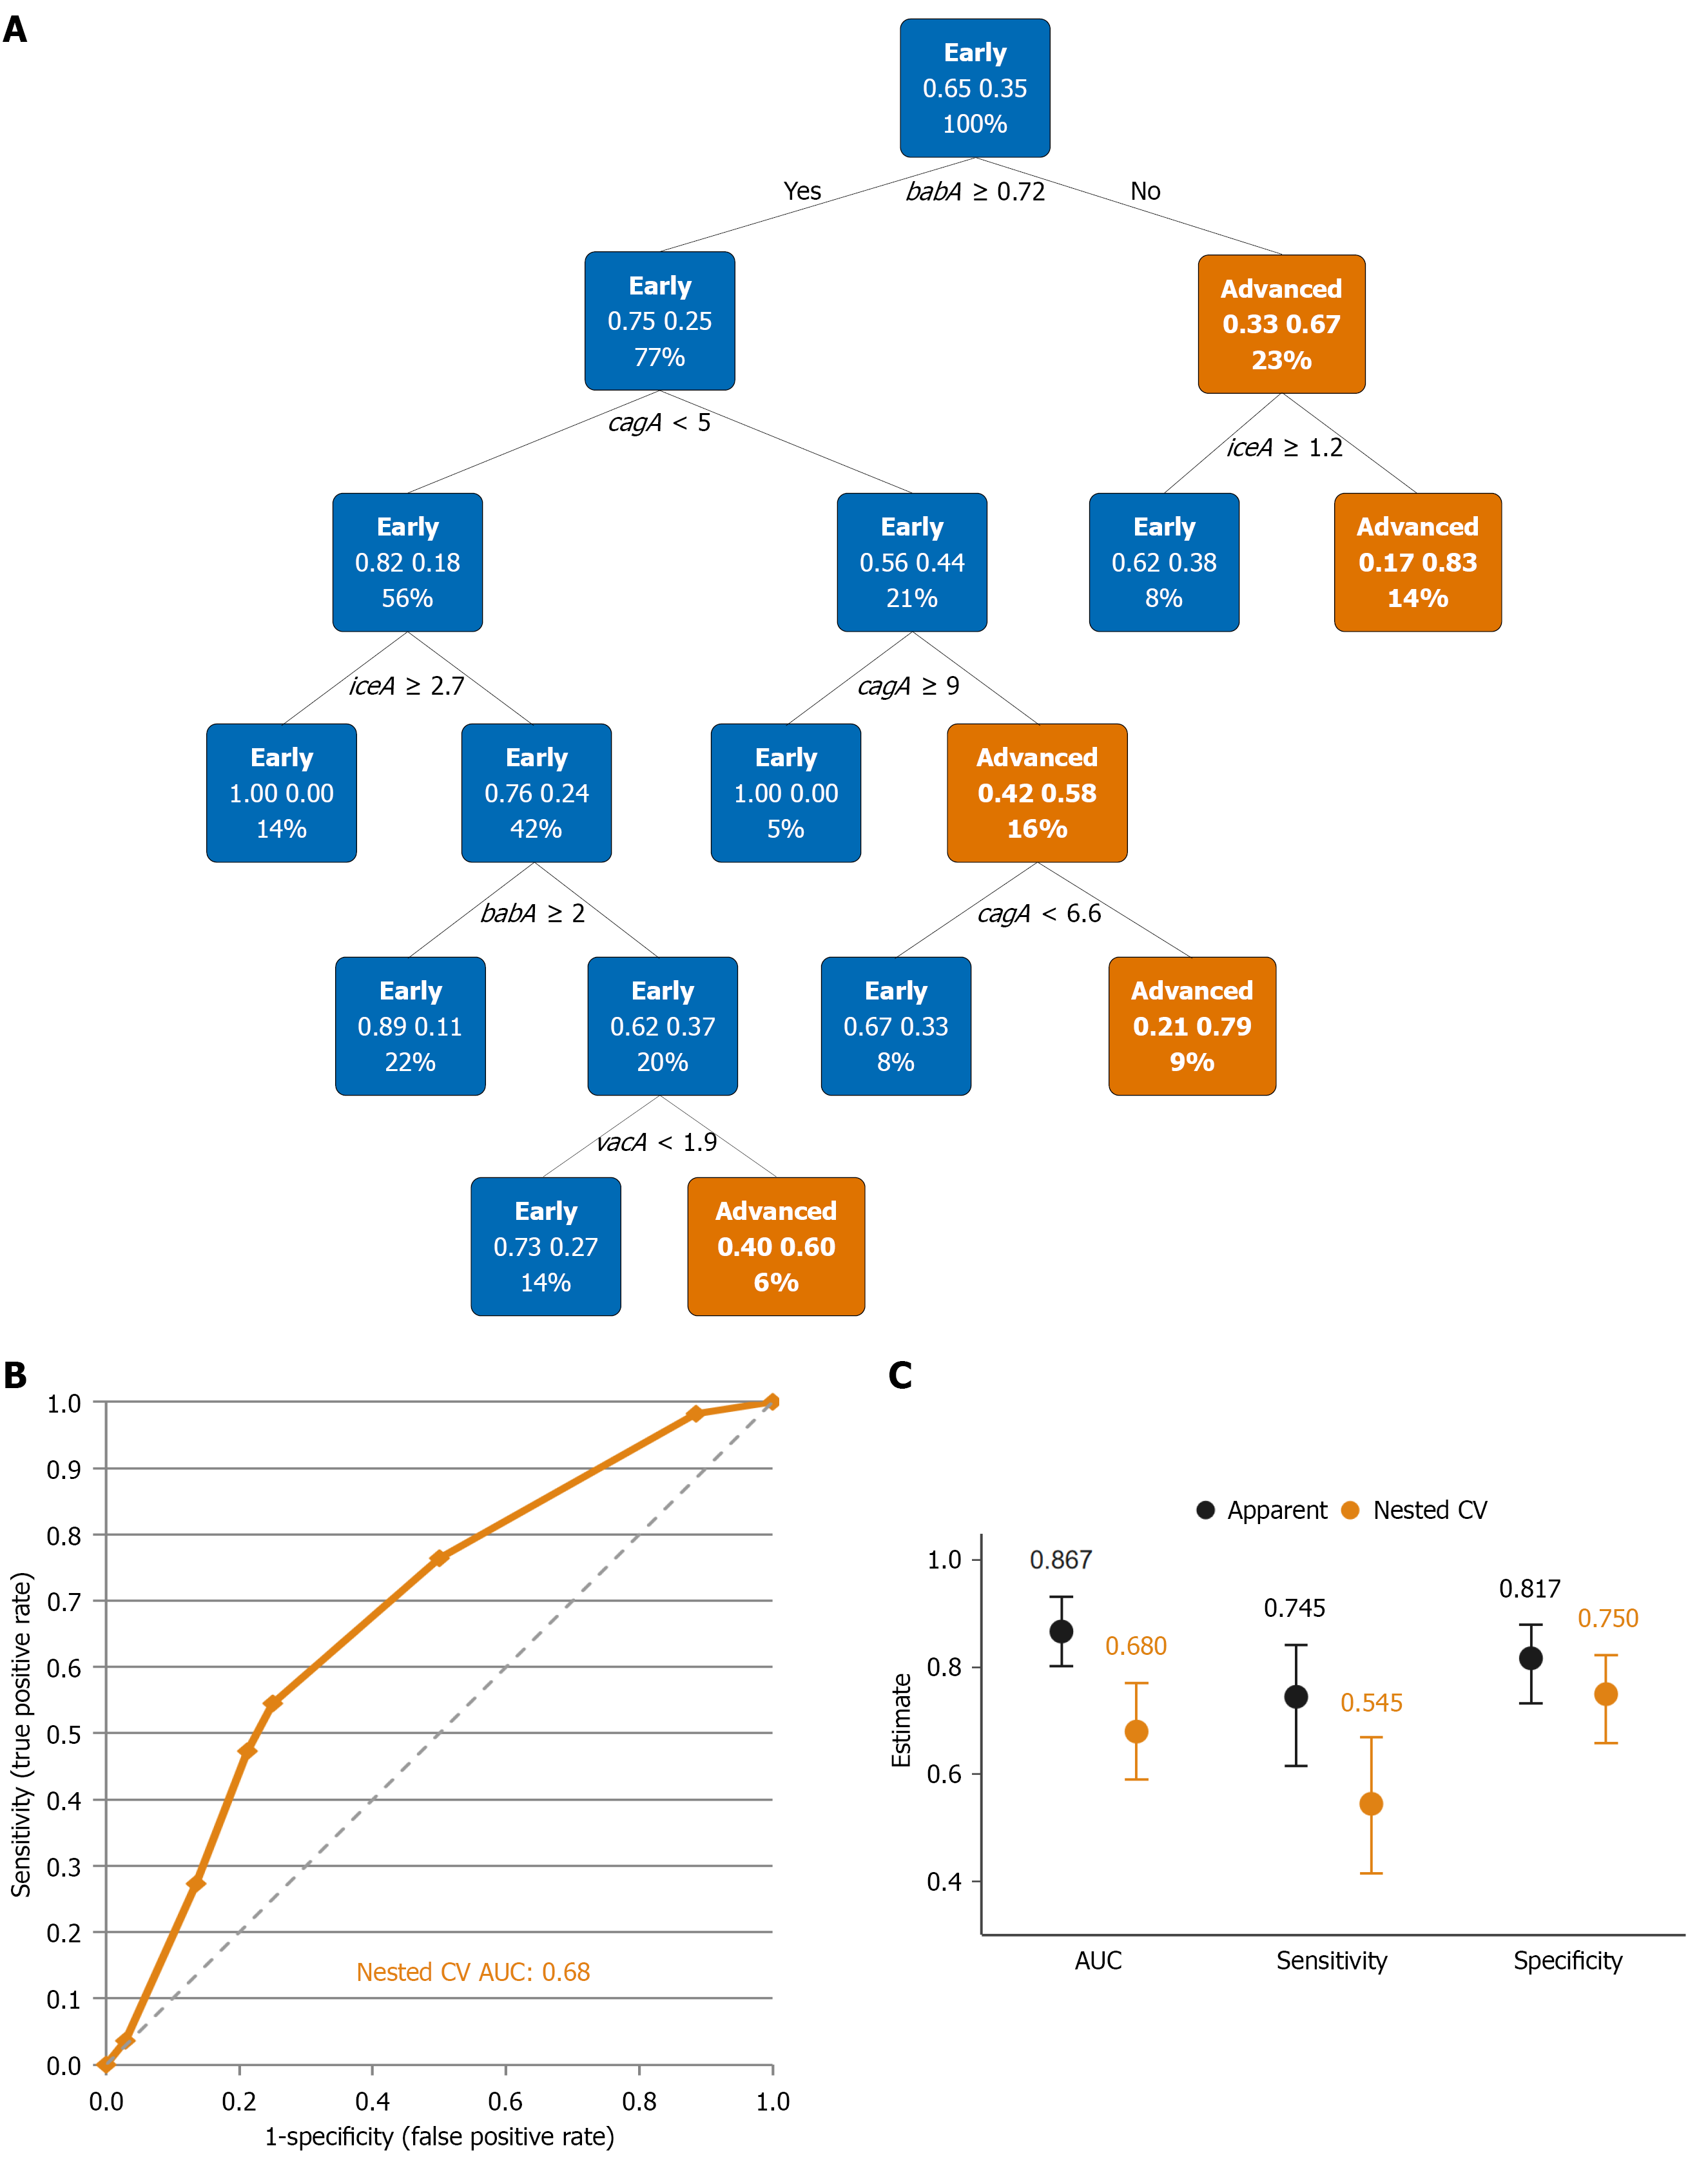
Figure 5 Predictive model, performance validation, and apparent-versus-cross-validated comparison for stage groups.
A: Recursive partitioning (decision tree) classifier separating patients into early (stages I-II) and advanced (stages III-IV) groups. Blood group antigen-binding adhesin A expression at a threshold ≥ 0.72 defines the first branch, after which cytotoxin-associated gene A, induced by contact with epithelium gene A, and vacuolating cytotoxin A provide additional downstream splits. Each terminal node reports the predicted class (early in blue, advanced in orange), the probability of class membership, and the proportion of the cohort; B: Receiver operating characteristic analysis evaluating stage discrimination by the integrated four-gene signature. The tree fit on the full cohort showed an apparent area under the curve (AUC) of 0.867; nested 5-fold cross-validation gave a more conservative AUC of 0.68. The diagonal line represents chance-level performance; C: Apparent vs nested cross-validated performance of the classification and regression tree classifier across three metrics. The consistent decrease from apparent to cross-validated estimates across all three metrics (apparent AUC = 0.867 vs nested CV AUC = 0.68) shows that the apparent fit is optimistic, as expected for an in-sample tree evaluation. cagA: Cytotoxin-associated gene A; vacA: Vacuolating cytotoxin A; babA: Blood group antigen-binding adhesin A; iceA: Induced by contact with epithelium gene A; AUC: Area under the curve; CV: Cross-validation.
- Citation: Mbuthia O, Mahjabeen I, Kayani M, Mehmood A, Obiero J, Matsumoto T, Bosire K, Mureithi M. Helicobacter pylori virulence gene expression defines a stage-associated transcriptional signature in gastric cancer. World J Clin Oncol 2026; 17(10): 125453
- URL: https://www.wjgnet.com/2218-4333/full/v17/i10/125453.htm
- DOI: https://dx.doi.org/10.5306/wjco.125453