
















Copyright: ©Author(s) 2026.
World J Clin Oncol. Oct 24, 2026; 17(10): 125453
Published online Oct 24, 2026. doi: 10.5306/wjco.125453
Published online Oct 24, 2026. doi: 10.5306/wjco.125453
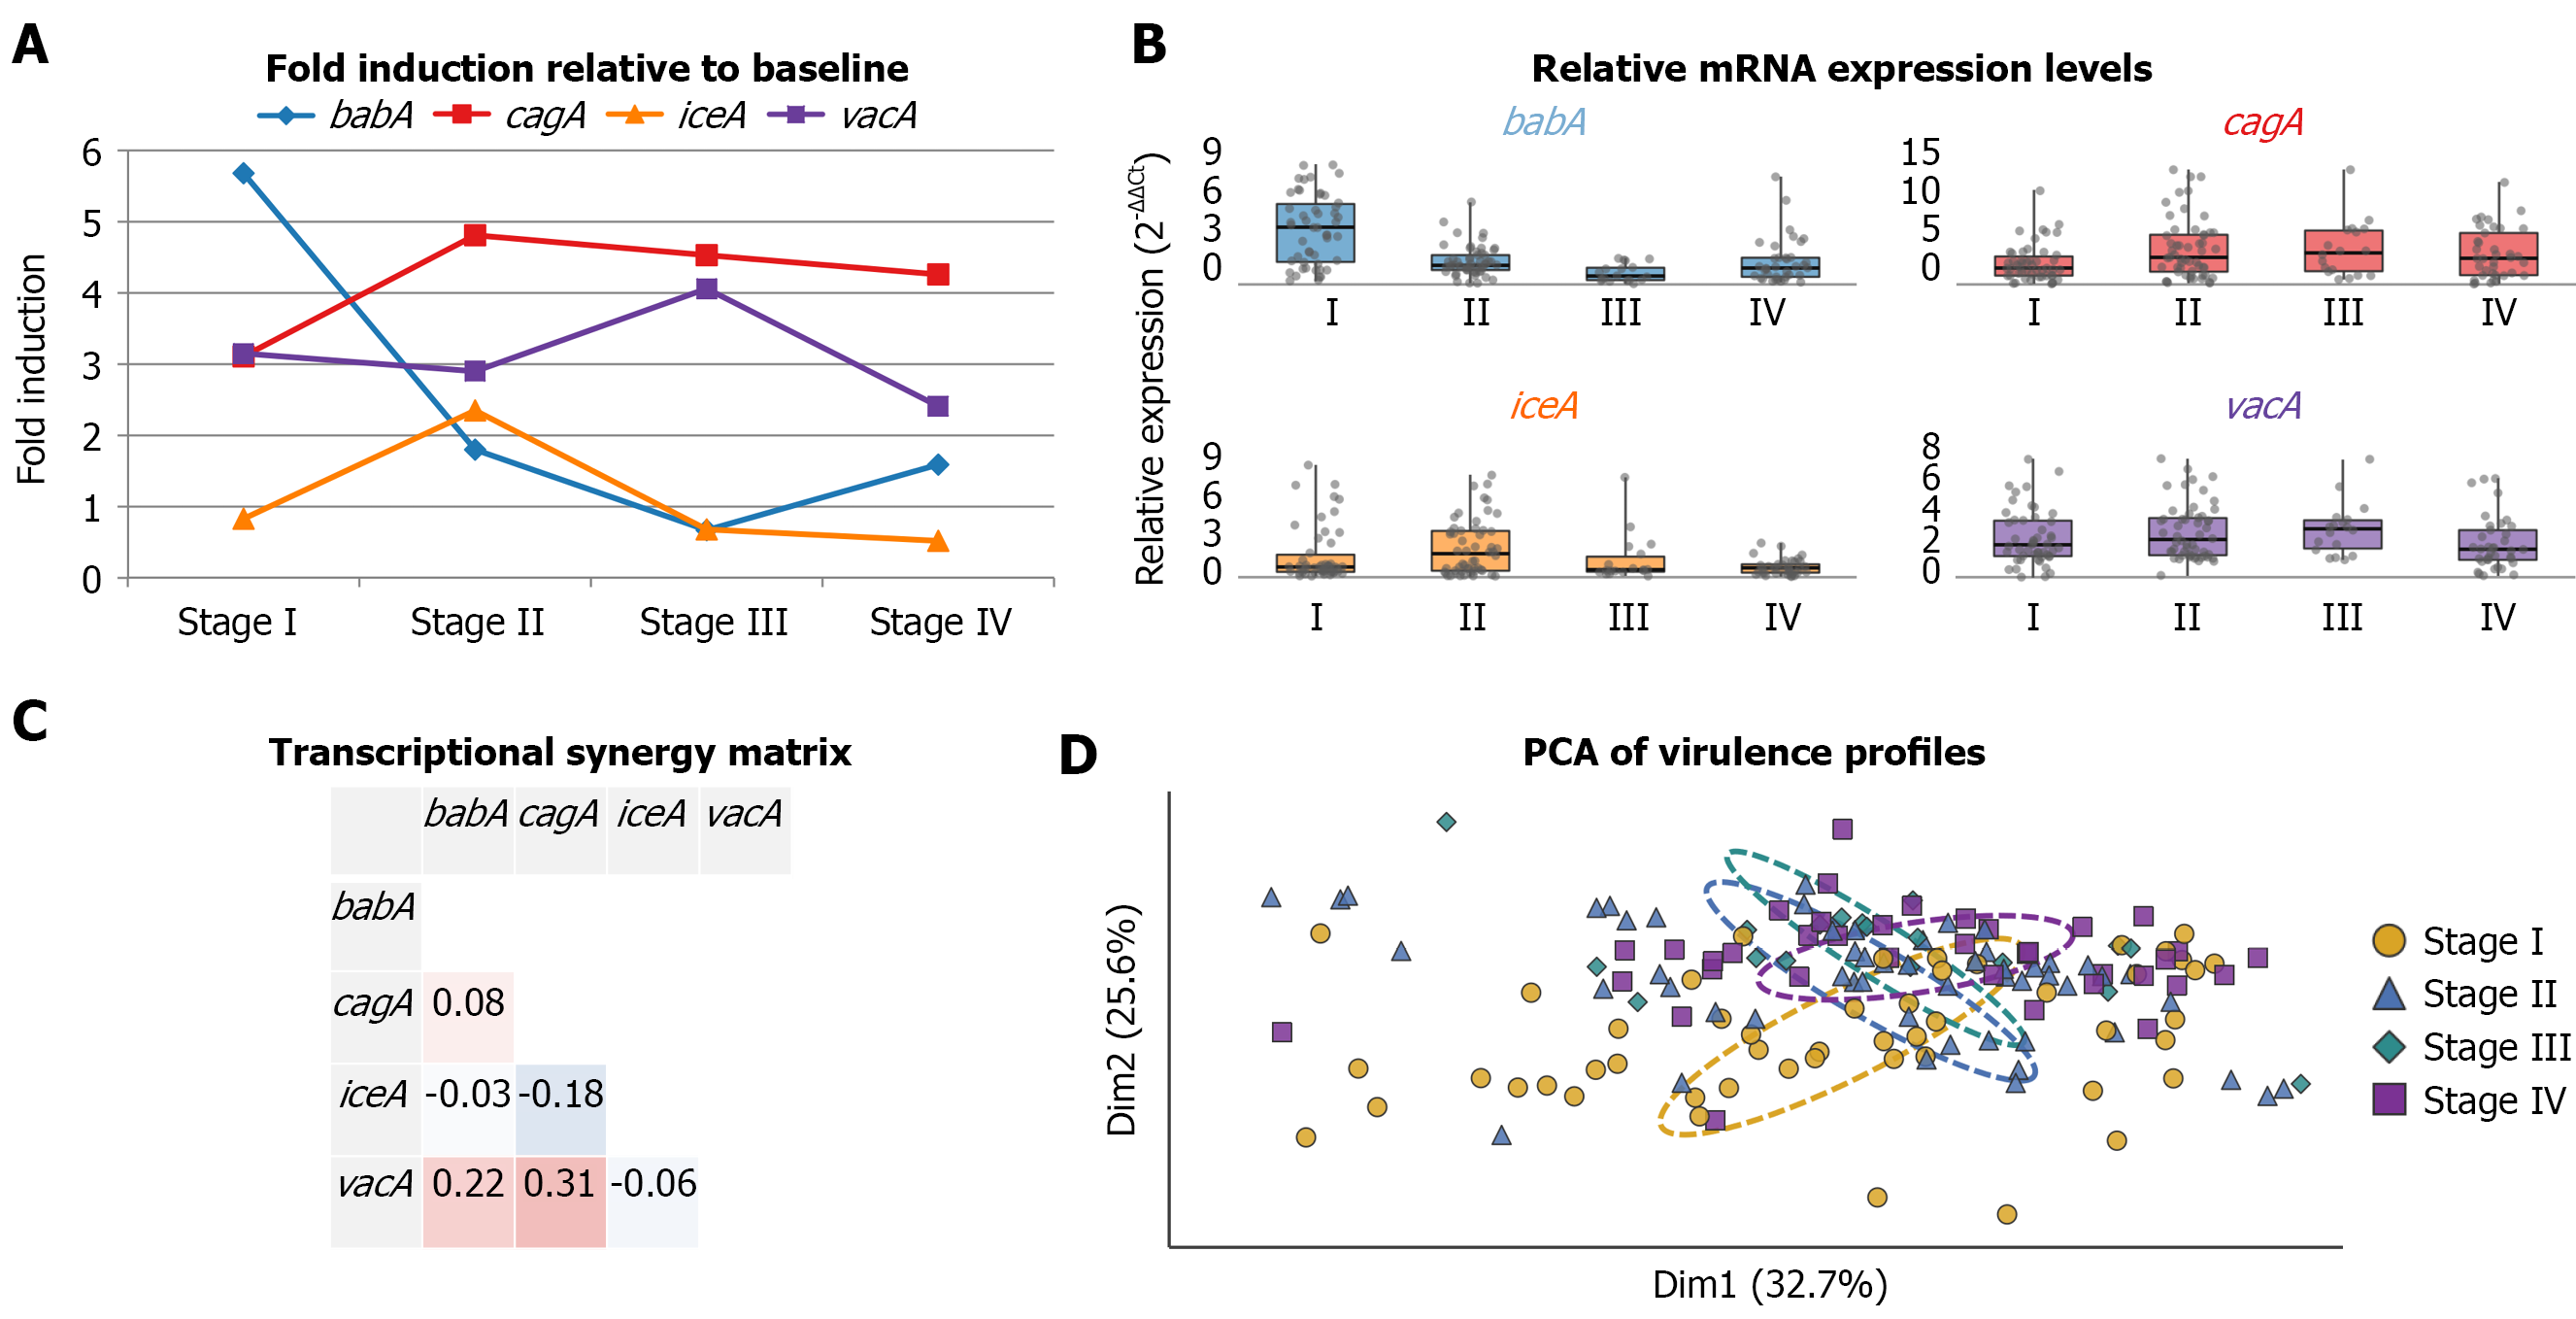
Figure 2 Transcriptional transition from bacterial adherence to host-cell invasion across clinical stages of gastric cancer.
A: Fold induction of major virulence transcripts relative to baseline expression in asymptomatic controls is shown, with the dashed horizontal line indicating y = 1. A distinct “crossover” is evident at stage II: Expression of the adhesin gene blood group antigen-binding adhesin A (babA) decreases, while cytotoxin-associated gene A (cagA) and vacuolating cytotoxin A (vacA), the toxigenic factors, become progressively upregulated; B: Relative mRNA expression of cagA, vacA, babA, and induced by contact with epithelium gene A according to stage. Values are expressed as 2-ΔΔCt; boxes indicate the interquartile range (IQR), horizontal lines indicate medians, and whiskers extend to 1.5 × IQR; C: The Spearman’s rank correlation matrix summarizes transcriptional relationships among virulence factors. Correlation coefficients (r) are represented by the color scale, including the significant positive relationship between cagA and vacA (r = 0.31); D: Principal component analysis of molecular profiles demonstrates progressive directional separation with 90% confidence ellipses, consistent with a global microbial-transcriptome shift from early-stage (stage I) to advanced (stage IV) gastric cancer. PCA: Principal component analysis; cagA: Cytotoxin-associated gene A; vacA: Vacuolating cytotoxin A; babA: Blood group antigen-binding adhesin A; iceA: Induced by contact with epithelium gene A.
- Citation: Mbuthia O, Mahjabeen I, Kayani M, Mehmood A, Obiero J, Matsumoto T, Bosire K, Mureithi M. Helicobacter pylori virulence gene expression defines a stage-associated transcriptional signature in gastric cancer. World J Clin Oncol 2026; 17(10): 125453
- URL: https://www.wjgnet.com/2218-4333/full/v17/i10/125453.htm
- DOI: https://dx.doi.org/10.5306/wjco.125453