
















Copyright: ©Author(s) 2026.
World J Clin Oncol. Oct 24, 2026; 17(10): 125453
Published online Oct 24, 2026. doi: 10.5306/wjco.125453
Published online Oct 24, 2026. doi: 10.5306/wjco.125453
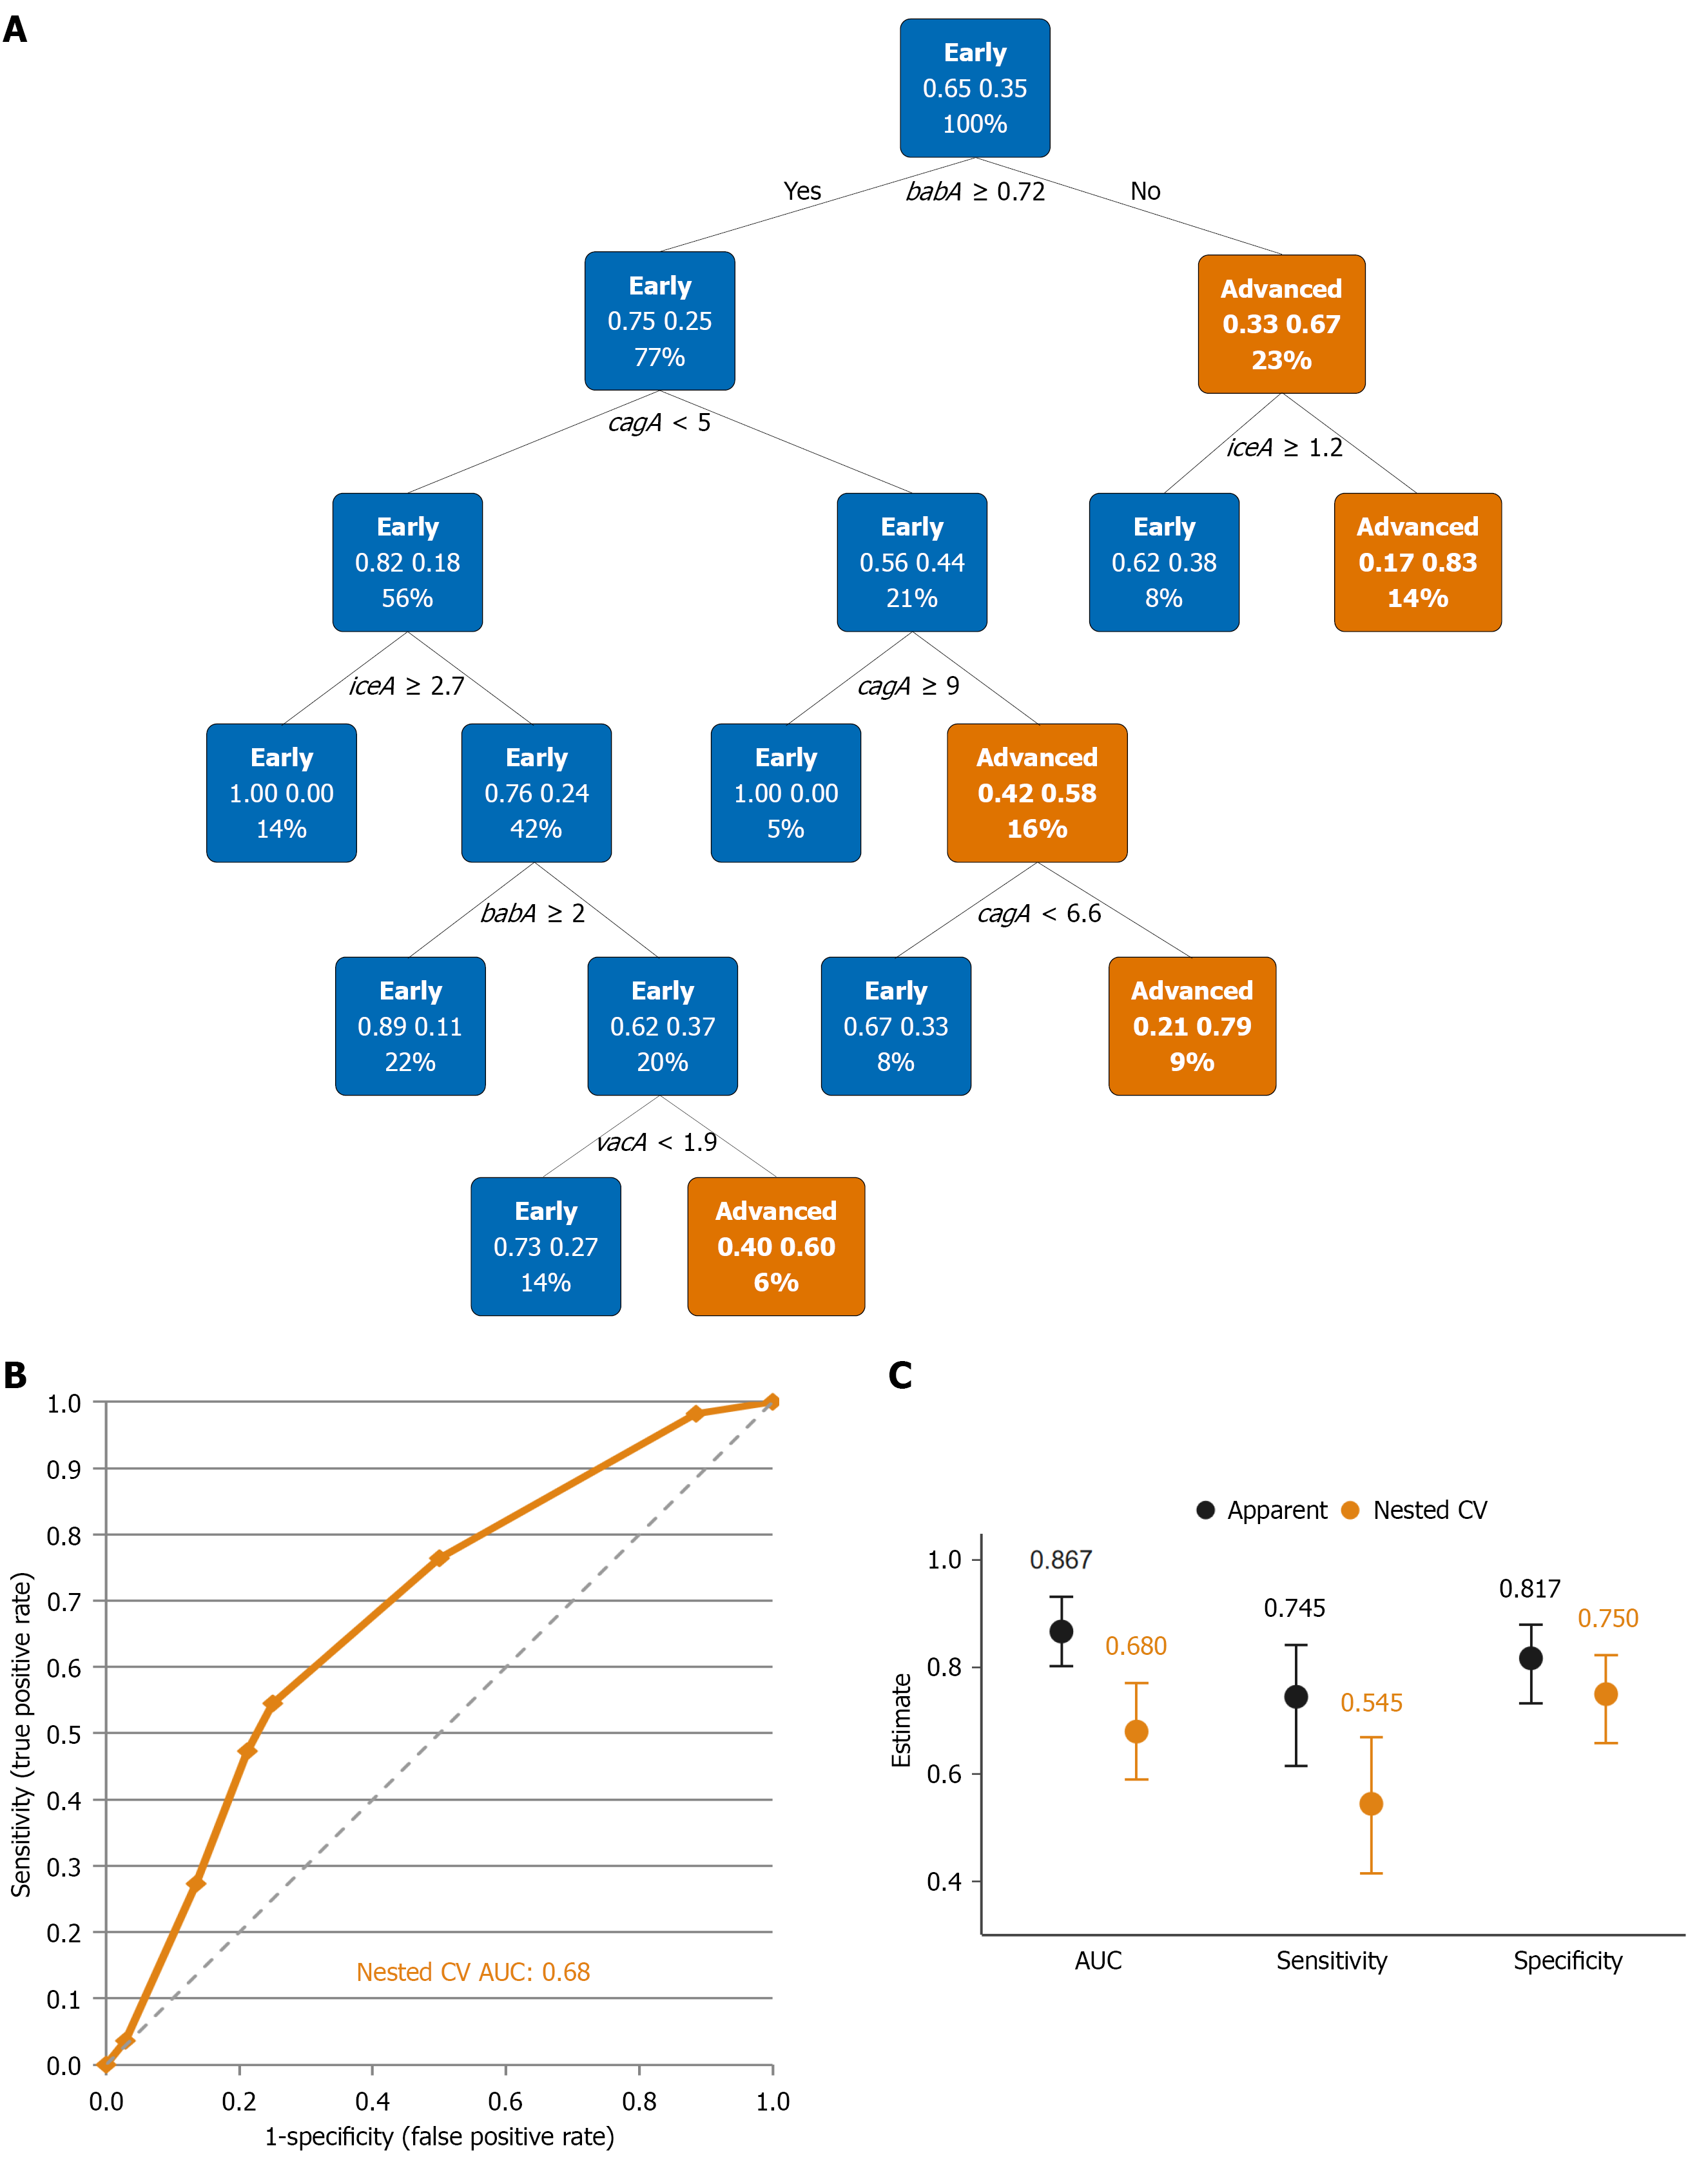
Figure 5 Predictive model, performance validation, and apparent-versus-cross-validated comparison for stage groups.
A: Recursive partitioning (decision tree) classifier separating patients into early (stages I-II) and advanced (stages III-IV) groups. Blood group antigen-binding adhesin A expression at a threshold ≥ 0.72 defines the first branch, after which cytotoxin-associated gene A, induced by contact with epithelium gene A, and vacuolating cytotoxin A provide additional downstream splits. Each terminal node reports the predicted class (early in blue, advanced in orange), the probability of class membership, and the proportion of the cohort; B: Receiver operating characteristic analysis evaluating stage discrimination by the integrated four-gene signature. The tree fit on the full cohort showed an apparent area under the curve (AUC) of 0.867; nested 5-fold cross-validation gave a more conservative AUC of 0.68. The diagonal line represents chance-level performance; C: Apparent vs nested cross-validated performance of the classification and regression tree classifier across three metrics. The consistent decrease from apparent to cross-validated estimates across all three metrics (apparent AUC = 0.867 vs nested CV AUC = 0.68) shows that the apparent fit is optimistic, as expected for an in-sample tree evaluation. cagA: Cytotoxin-associated gene A; vacA: Vacuolating cytotoxin A; babA: Blood group antigen-binding adhesin A; iceA: Induced by contact with epithelium gene A; AUC: Area under the curve; CV: Cross-validation.
- Citation: Mbuthia O, Mahjabeen I, Kayani M, Mehmood A, Obiero J, Matsumoto T, Bosire K, Mureithi M. Helicobacter pylori virulence gene expression defines a stage-associated transcriptional signature in gastric cancer. World J Clin Oncol 2026; 17(10): 125453
- URL: https://www.wjgnet.com/2218-4333/full/v17/i10/125453.htm
- DOI: https://dx.doi.org/10.5306/wjco.125453