Published online Dec 28, 2013. doi: 10.4329/wjr.v5.i12.455
Revised: September 22, 2013
Accepted: October 15, 2013
Published online: December 28, 2013
Processing time: 145 Days and 17.6 Hours
Diagnosis of extremity soft-tissue tumors can be challenging. Characteristics of tumor margins can help precisely identify locally aggressive or non-aggressive behavior for surgical planning, but cannot differentiate benign from malignant lesions. Most malignant tumors can have inhomogeneous signals on T2-weighted images. Although a uniform signal on T2-weighted images can be a reliable indication of a benign lesion, a well-defined mass with homogeneous internal signal intensity does not definitively identify a benign lesion. Some common and distinctive soft-tissue lesions can have specific clinical and imaging features allowing a diagnosis without biopsy. These are known as determinate lesions. This illustrative report presents a diagnostic guide for extremity soft-tissue tumors based on tissue signal and morphological characteristics on magnetic resonance images. It is important for clinicians to be familiar with the imaging characteristics of common determinate lesions.
Core tip: The aim of this illustrative report is to provide a diagnostic guide for soft-tissue tumors of the extremities based on tissue signal and morphological characteristics on magnetic resonance images.
- Citation: Chan WP. Magnetic resonance imaging of soft-tissue tumors of the extremities: A practical approach. World J Radiol 2013; 5(12): 455-459
- URL: https://www.wjgnet.com/1949-8470/full/v5/i12/455.htm
- DOI: https://dx.doi.org/10.4329/wjr.v5.i12.455
The functions of magnetic resonance (MR) imaging in evaluation of soft-tissue tumors of the extremities include detection, characterization, local staging, and detection of recurrence and complications after therapy.
MR imaging and computed tomography (CT) scanning can be equally accurate for detecting the size and extent of a tumor. MR imaging is more accurate than CT for evaluating individual muscle involvement and therefore can be the staging procedure of choice in patients with soft-tissue sarcoma of the extremities.
MR imaging is superior to CT in detecting recurrent soft-tissue sarcomas. A nodule or mass with a mass effect on surrounding tissue is highly indicative of recurrent tumors. However, both the tumor and organizing scar (or granulation tissue) can show marked gadolinium enhancement.
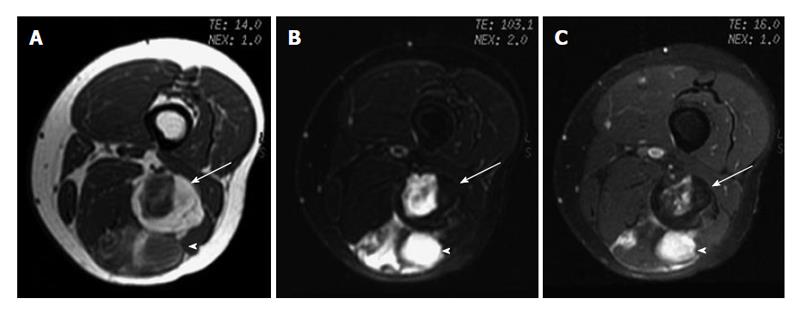
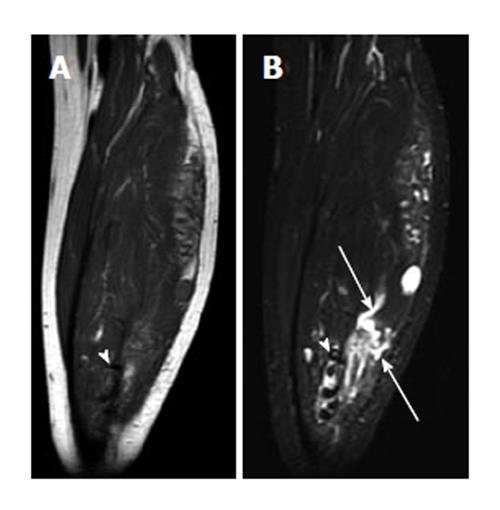
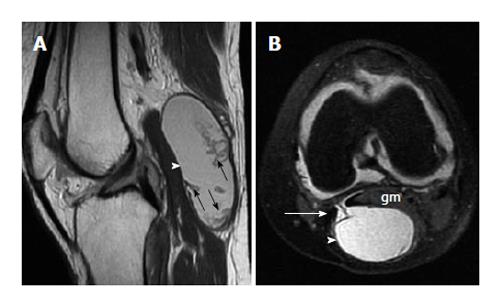
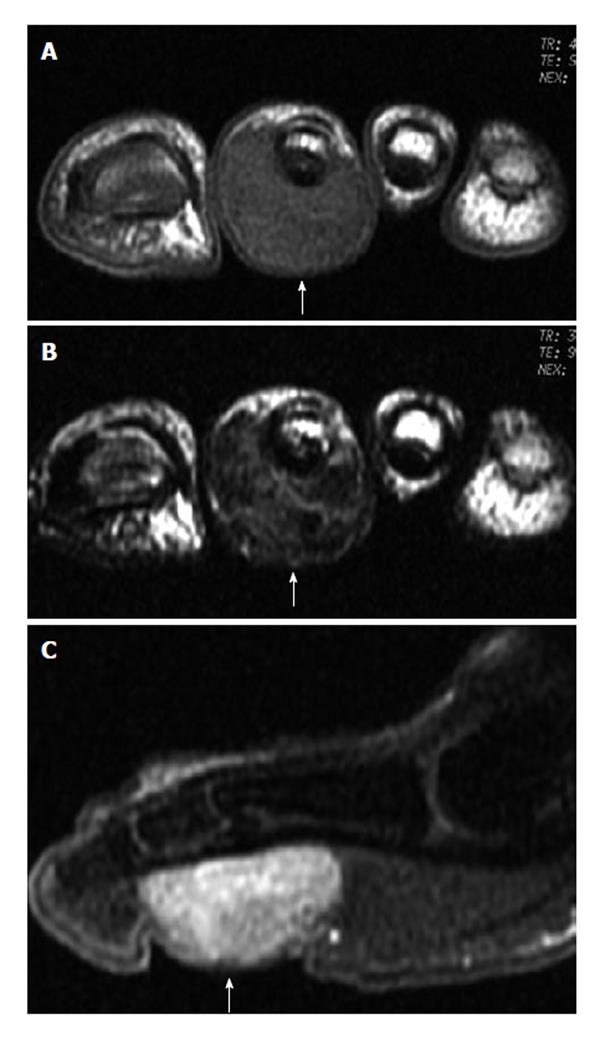
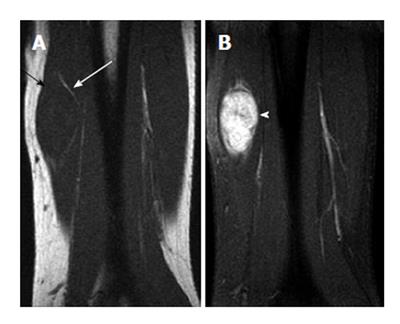
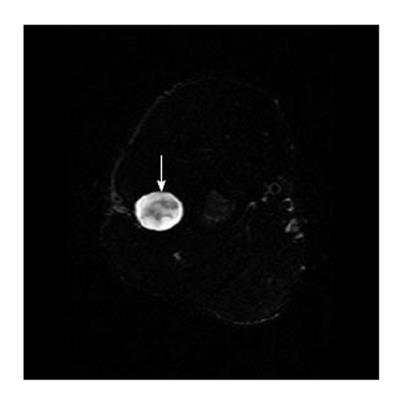
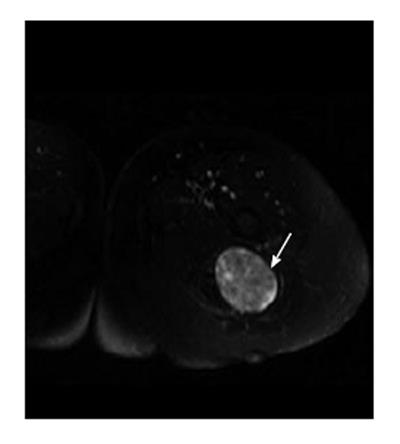
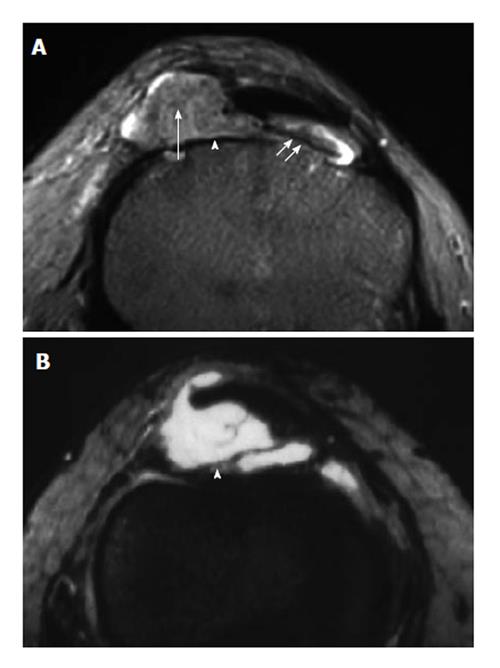
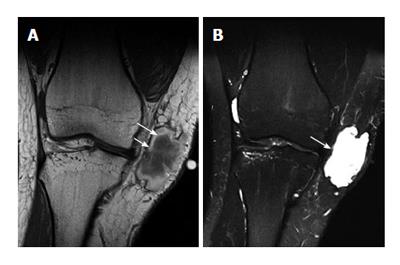
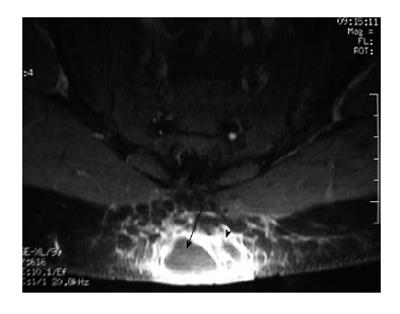
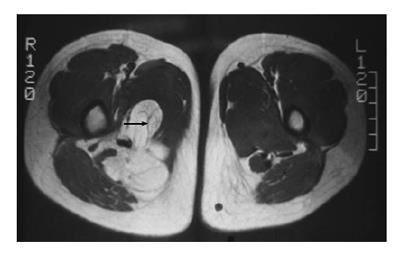
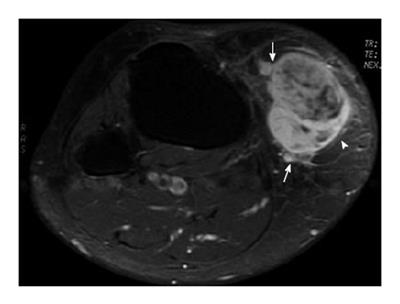
Some common and distinctive soft-tissue lesions have specific clinical and imaging features allowing a diagnosis without biopsy[1,2]. These are known as determinate lesions[2]. Examples of lesions with specific signal characteristics on MR imaging are lipoma (Figure 1), liposarcoma (Figure 2), hemangioma (Figure 3), ganglion and Baker cysts (Figure 4), giant cell tumor (GCT) arising from the tendon sheath (Figure 5), peripheral nerve sheath tumor (PNST) and neurofibroma (Figure 6, Figure 7 and Figure 8), subungual glomus tumor (Figure 9), localized solitary synovitis (Figure 10), muscle tear and hematoma (Figure 11), abscess (Figure 12), myonecrosis, bursitis, and aneurysm. s
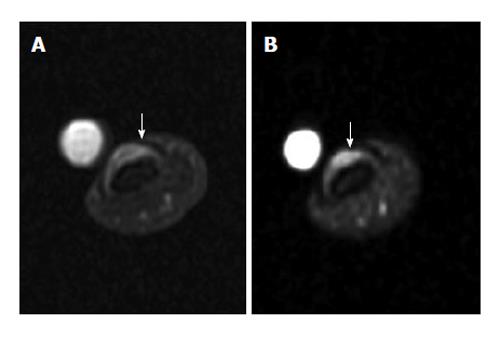
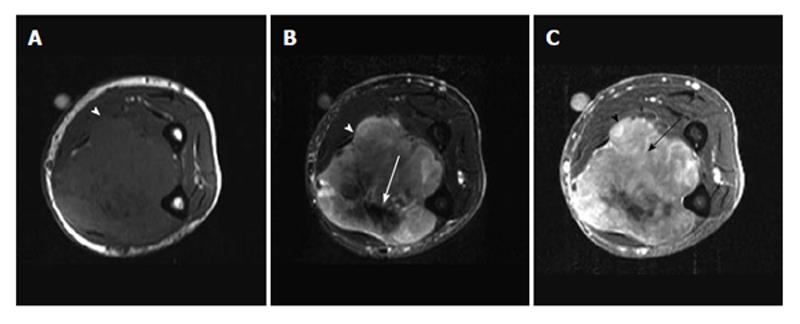
An indeterminate lesion is one that must be biopsied to ensure an accurate diagnosis[2]. Examples of lesions are malignant fibrous histiocytoma (Figure 13), fibroma, fibrosarcoma, leiomyoma, leiomyosarcoma, angiosarcoma (hemangiosarcoma), rhabdomyoma, rhabdomyosarcoma, synovial sarcoma, synovioma, lymphangiosarcoma, malignant hemangiopericytoma, alveolar soft parts sarcoma, epithelioid sarcoma, and angiosarcoma. Diagnosis of a lesion suspicious for a malignant tumor should never be relied on imaging alone. All suspicious tumors should be biopsied (Figures 14 and 15).
A well-demarcated lesion or a tumor mass with a capsule can favor a benign diagnosis, whereas a less well-demarcated lesion or tumor mass with an infiltrative margin is most likely malignant. Margin characteristics can help precisely identify locally aggressive or non-aggressive behavior for surgical planning, but cannot differentiate benign from malignant lesions[3]. Clinical data always play an important role in evaluating the aggressiveness of tumors.
Fat, fibrous tissue, fluid or cyst, and protein can be characterized by specific signals on MR imaging. Most benign lesions have a uniform signal on T1-weighted and T2-weighted images, with the exception, for example, of neurofibromas and hemangiomas, which exhibit inhomogeneous signals on T2-weighted images. Most malignant tumors can have a uniform signal on T1-weighted images but inhomogeneous signals on T2-weighted images. Although a uniform signal on T2-weighted images can be a reliable indication of a benign lesion, a well-defined mass with homogeneous internal signal intensity does not definitively identify a benign lesion. Lack of uniformity does not reliably indicate malignancy[3]. Low-grade liposarcomas (Figure 14) and leiomyosarcoma, for example, are malignant lesions with misleading benign appearances. Soft-tissue lesions arising from trauma (e.g., hematoma) can mimic malignancy.
On dynamic gadolinium-enhanced MR imaging, measurement of relaxation times cannot guide evaluation, as the T1- and T2-relaxation times of benign and malignant lesions overlap significantly[4]. Whether the time-intensity-curve (TIC) shape analysis alone can differentiate malignant from benign soft-tissue tumors, or differentiate between tumor grades, remains controversial[5].
The aim of this illustrative report is to provide a diagnostic guide for soft-tissue tumors of the extremities based on tissue signal and morphological characteristics on MR images. Examples of common determinate lesions are illustrated, except that one indeterminate lesion (malignant fibrous histiocytoma) is shown as an example for comparison.
In summary, MR imaging can be helpful in evaluating soft-tissue tumors of the extremities, but it can also be misleading. The combination of signal and morphological characteristics on MR images allows radiologists to categorize many lesions as benign or malignant, although a significant proportion of the images are not specific. It is important for clinicians to be familiar with the imaging characteristics of common determinate lesions. Biopsy is needed to define the histological nature of an indeterminate soft-tissue neoplasm.
P- Reviewers: Nouh MR, Plataniotis G S- Editor: Qi Y L- Editor: Wang TQ E- Editor: Liu XM
| 1. | Wu JS, Hochman MG. Soft-tissue tumors and tumorlike lesions: a systematic imaging approach. Radiology. 2009;253:297-316. [RCA] [PubMed] [DOI] [Full Text] [Cited by in Crossref: 188] [Cited by in RCA: 188] [Article Influence: 11.8] [Reference Citation Analysis (0)] |
| 2. | Papp DF, Khanna AJ, McCarthy EF, Carrino JA, Farber AJ, Frassica FJ. Magnetic resonance imaging of soft-tissue tumors: determinate and indeterminate lesions. J Bone Joint Surg Am. 2007;89 Suppl 3:103-115. [RCA] [PubMed] [DOI] [Full Text] [Cited by in Crossref: 24] [Cited by in RCA: 32] [Article Influence: 1.8] [Reference Citation Analysis (0)] |
| 3. | Lang P, Genant HK, Johnston JO, Honda G. Musculoskeletal neoplasm. MRI of the Musculoskeletal System. Philadelphia: W.B. Saunders 1994; 401-443. |
| 4. | Mirowitz SA, Totty WG, Lee JK. Characterization of musculoskeletal masses using dynamic Gd-DTPA enhanced spin-echo MRI. J Comput Assist Tomogr. 1992;16:120-125. [PubMed] |
| 5. | Lavini C, Buiter MS, Maas M. Use of dynamic contrast enhanced time intensity curve shape analysis in MRI: theory and practice. Reports Med Imaging. 2013;6:71-82. [RCA] [DOI] [Full Text] [Cited by in Crossref: 18] [Cited by in RCA: 19] [Article Influence: 1.6] [Reference Citation Analysis (0)] |
| 6. | Li CS, Huang GS, Wu HD, Chen WT, Shih LS, Lii JM, Duh SJ, Chen RC, Tu HY, Chan WP. Differentiation of soft tissue benign and malignant peripheral nerve sheath tumors with magnetic resonance imaging. Clin Imaging. 2008;32:121-127. [RCA] [PubMed] [DOI] [Full Text] [Cited by in Crossref: 89] [Cited by in RCA: 91] [Article Influence: 5.4] [Reference Citation Analysis (0)] |


