Copyright
©2013 Baishideng Publishing Group Co.
World J Radiol. Dec 28, 2013; 5(12): 455-459
Published online Dec 28, 2013. doi: 10.4329/wjr.v5.i12.455
Published online Dec 28, 2013. doi: 10.4329/wjr.v5.i12.455
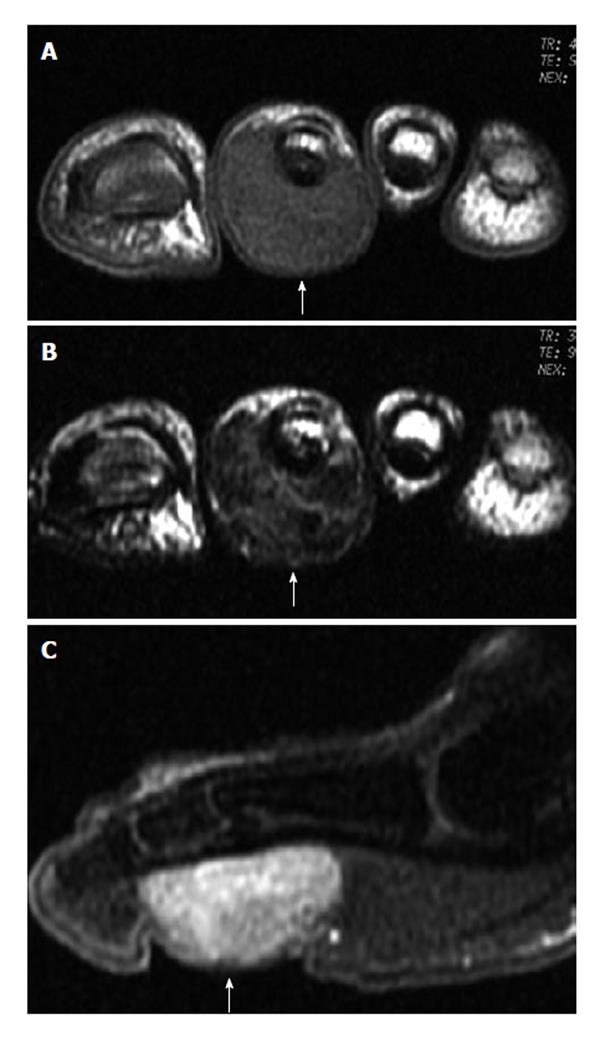
Figure 5 Giant cell tumor of the tendon sheath.
A: T1-weighted image shows the tumor (arrow) on the plantar side; B: T2-weighted image shows heterogeneous low signal intensity of the tumor (arrow) due to hemosiderin deposition; C: Sagittal gadolinium-enhanced T1-weighted image with fat saturation shows obvious enhancement of the tumor mass (arrow).
- Citation: Chan WP. Magnetic resonance imaging of soft-tissue tumors of the extremities: A practical approach. World J Radiol 2013; 5(12): 455-459
- URL: https://www.wjgnet.com/1949-8470/full/v5/i12/455.htm
- DOI: https://dx.doi.org/10.4329/wjr.v5.i12.455


