Copyright
©The Author(s) 2016.
World J Radiol. Aug 28, 2016; 8(8): 757-763
Published online Aug 28, 2016. doi: 10.4329/wjr.v8.i8.757
Published online Aug 28, 2016. doi: 10.4329/wjr.v8.i8.757
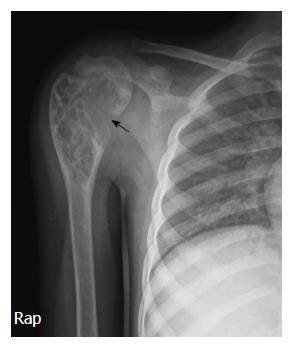
Figure 1 Anteroposterior radiograph of right shoulder showing multiseptated expansile lytic lesion with narrow zone of transition involving metaphysis of upper end of right humerus with cortical discontinuity on medial aspect (arrow).
No specific matrix mineralization or periosteal reaction noted.
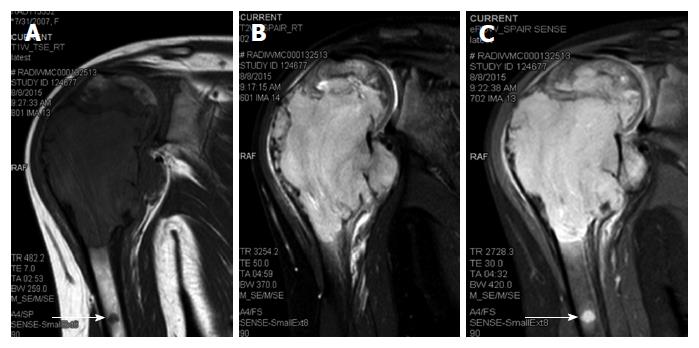
Figure 2 Oblique coronal turbo spin-echo T1-weighted (A), turbo spin-echo T2-weighted fat-suppressed (B) and proton-density-weighted fat-suppressed (C) magnetic resonance imaging images of the right shoulder showing a solid expansile intramedullary mass replacing the normal marrow fat; hypointense on T1-weighted images, hyperintense on T2-weighted images.
A cortical break in medial upper humeral diaphysis with extension into soft tissue noted. Note another skip lesion in the humeral shaft with similar signal characteristics (white arrow).
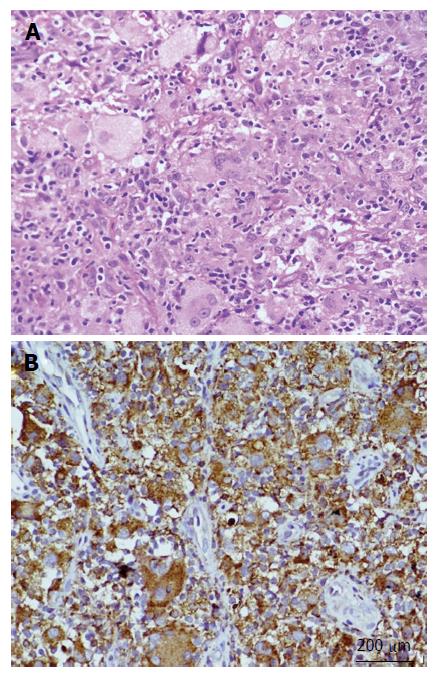
Figure 3 A biopsy from the lesion.
A: Hematoxylin and eosin stained section showing an infiltrate comprised of foamy and lipid laden histiocytes, multinucleated giant cells, lymphocytes and fibroblastic cells (200 ×); B: Immunohistochemistry with CD68 showing positivity in histiocytic cells and giant cells (200 ×).
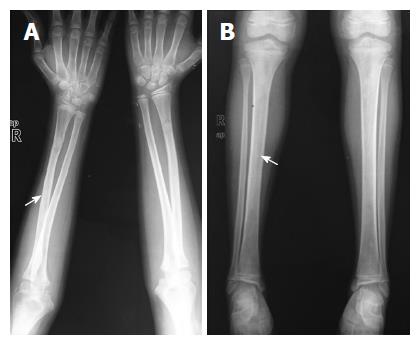
Figure 4 Anteroposterior radiographs of both forearms (A) and both legs (B) showing symmetric bilateral osteosclerosis of the metaphysis and diaphysis of the long bones (arrows).
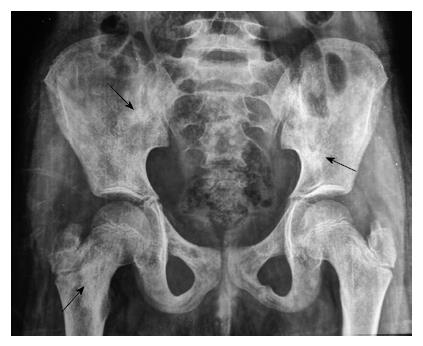
Figure 5 Anteroposterior radiograph of pelvis showing patchy osteosclerosis involving pelvic bones and proximal shafts of the femur (arrows).
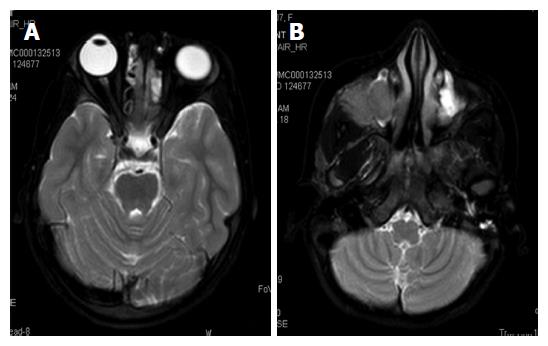
Figure 6 The whole body magnetic resonance imaging showing presence of bilateral ethmoid and maxillary sinusitis along with replacement of normal marrow by focal lesions involving maxilla.
A: Axial TSE T2-weighted fat suppressed image of normal orbits; B: T2WFS axial image of the face showing isointense soft tissue filling the right maxillary sinus with extension into the infratemporal fossa. TSE: Turbo spin-echo; T2WFS: T2-weighted fat-suppressed.
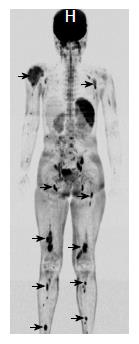
Figure 7 Whole body diffusion weighted imaging with background suppression imaging showing multiple skeletal lesions in right humerus, left scapula, bilateral femur and tibia (arrows).
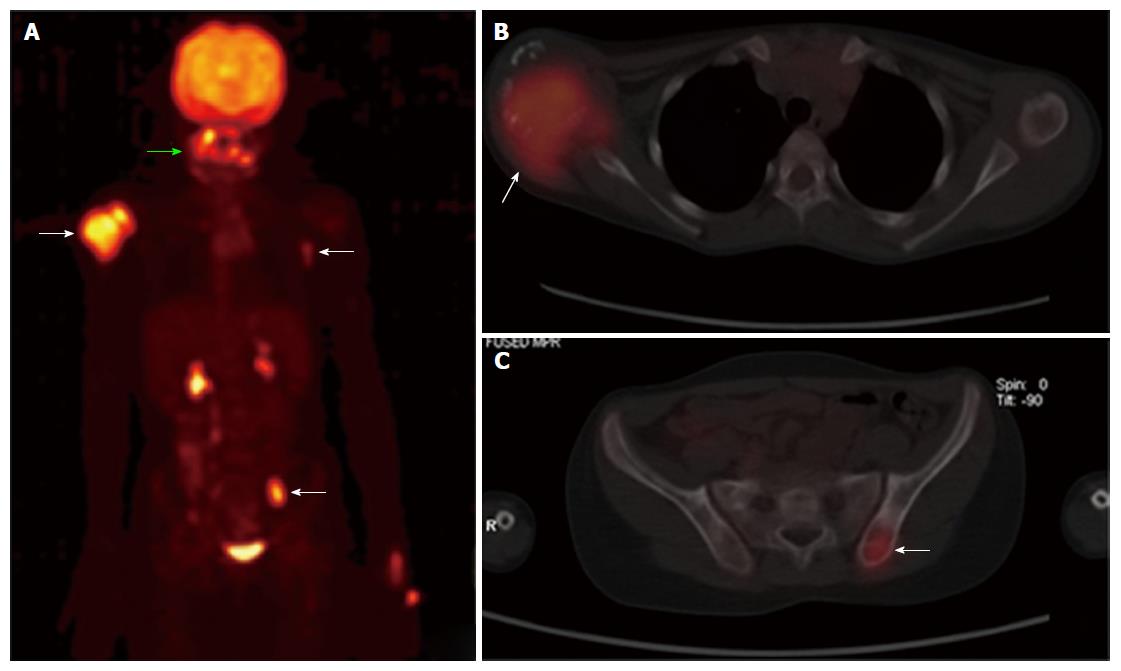
Figure 8 Positron emission tomography-computed tomography whole body maximum intensity projection image (A), axial fused images of chest (B) and pelvis (C) reveal areas of increased fluorodeoxyglucose uptake in right humeral head (arrow), the paranasal sinuses (green arrow), left thoracic wall (arrow) and left iliac bone (arrow).
Note the physiological uptake and excretion in the kidneys and urinary bladder.
- Citation: Vallonthaiel AG, Mridha AR, Gamanagatti S, Jana M, Sharma MC, Khan SA, Bakhshi S. Unusual presentation of Erdheim-Chester disease in a child with acute lymphoblastic leukemia. World J Radiol 2016; 8(8): 757-763
- URL: https://www.wjgnet.com/1949-8470/full/v8/i8/757.htm
- DOI: https://dx.doi.org/10.4329/wjr.v8.i8.757


