Copyright
©The Author(s) 2025.
World J Gastrointest Surg. Jun 27, 2025; 17(6): 106777
Published online Jun 27, 2025. doi: 10.4240/wjgs.v17.i6.106777
Published online Jun 27, 2025. doi: 10.4240/wjgs.v17.i6.106777
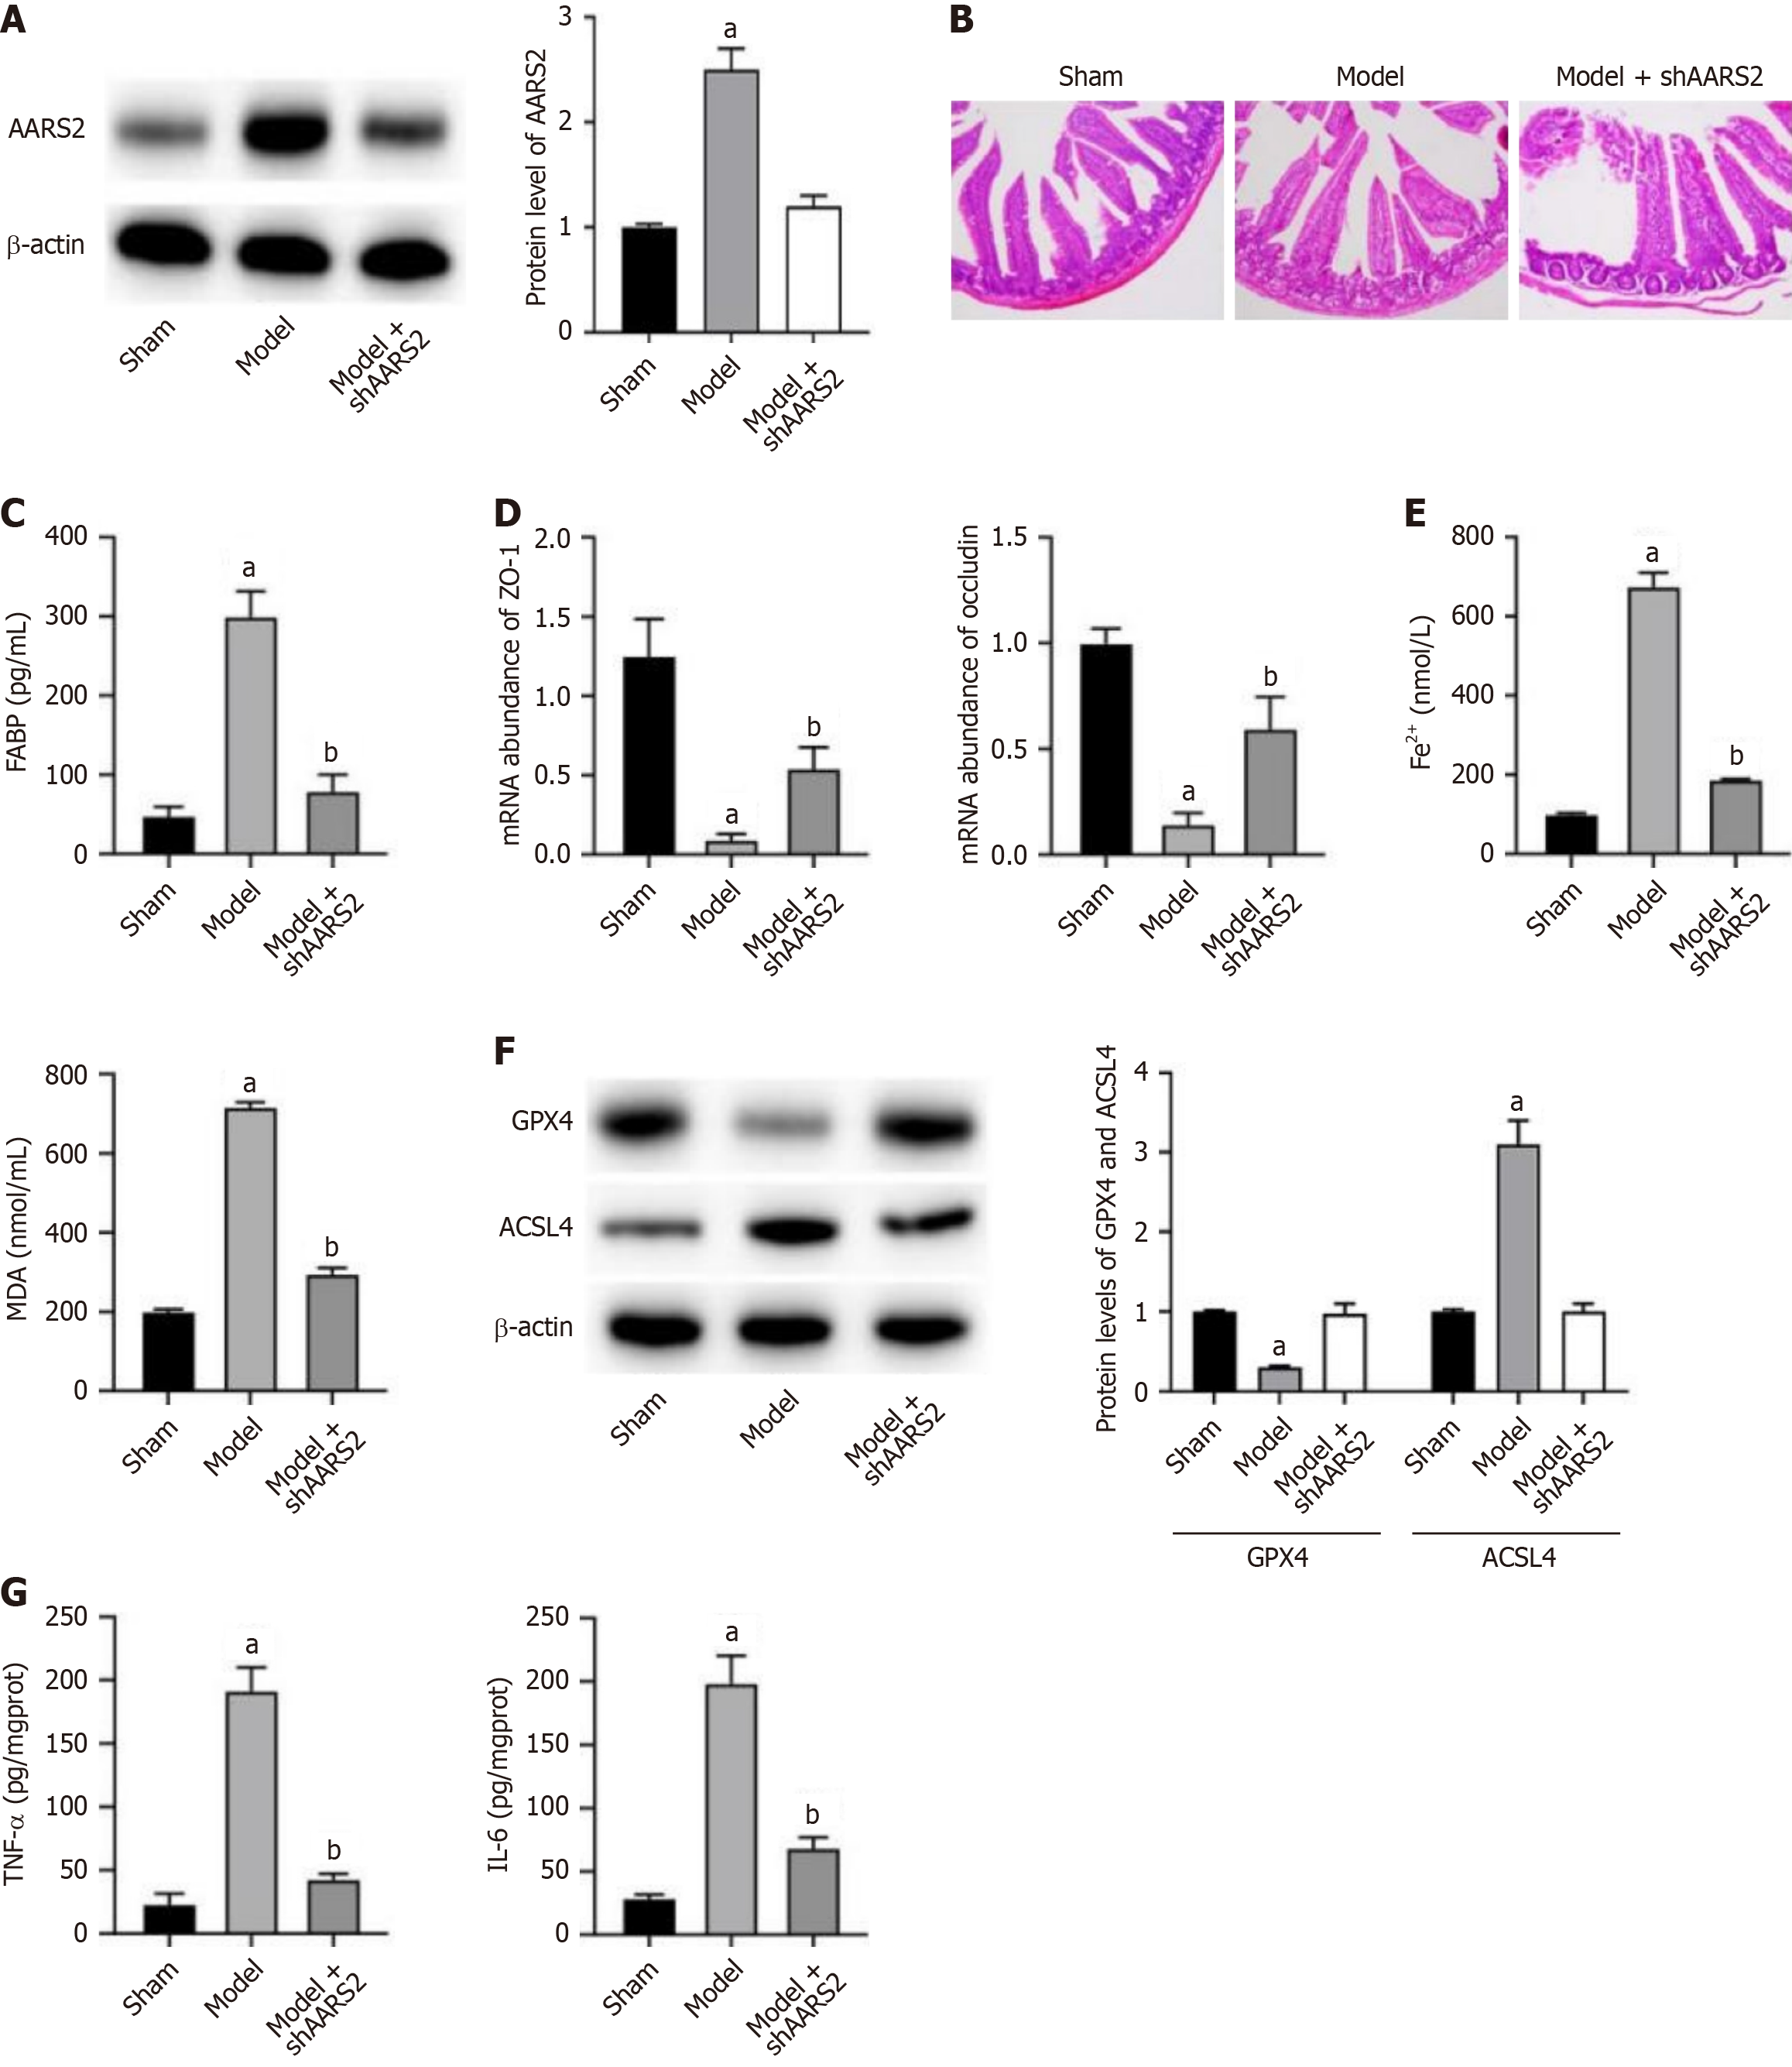
Figure 1 Mitochondrial alanyl-tRNA synthetase 2 promotes intestinal ischemia-reperfusion injury and ferroptosis in mouse model.
A: Protein level of mitochondrial alanyl-tRNA synthetase 2 (AARS2) in intestinal tissue. Protein levels of AARS2 in intestinal tissues normalized to β-actin. Bar graphs show densitometric quantification (mean ± SD); B: Hematoxylin and eosin staining of intestinal tissues; C: Serum level of Fatty acid-binding protein measured by ELISA; D: mRNA abundance of ZO-1 and occluding; E: Levels of Fe2+ and malondialdehyde; F: Protein levels of GPX4 and acyl-CoA synthetase long-chain family member 4 in intestinal tissues; G: Production of tumor necrosis factor-alpha and interleukin-6 measured by ELISA. aP < 0.01 vs sham, bP < 0.01 vs model. AARS2: Mitochondrial alanyl-tRNA synthetase 2.
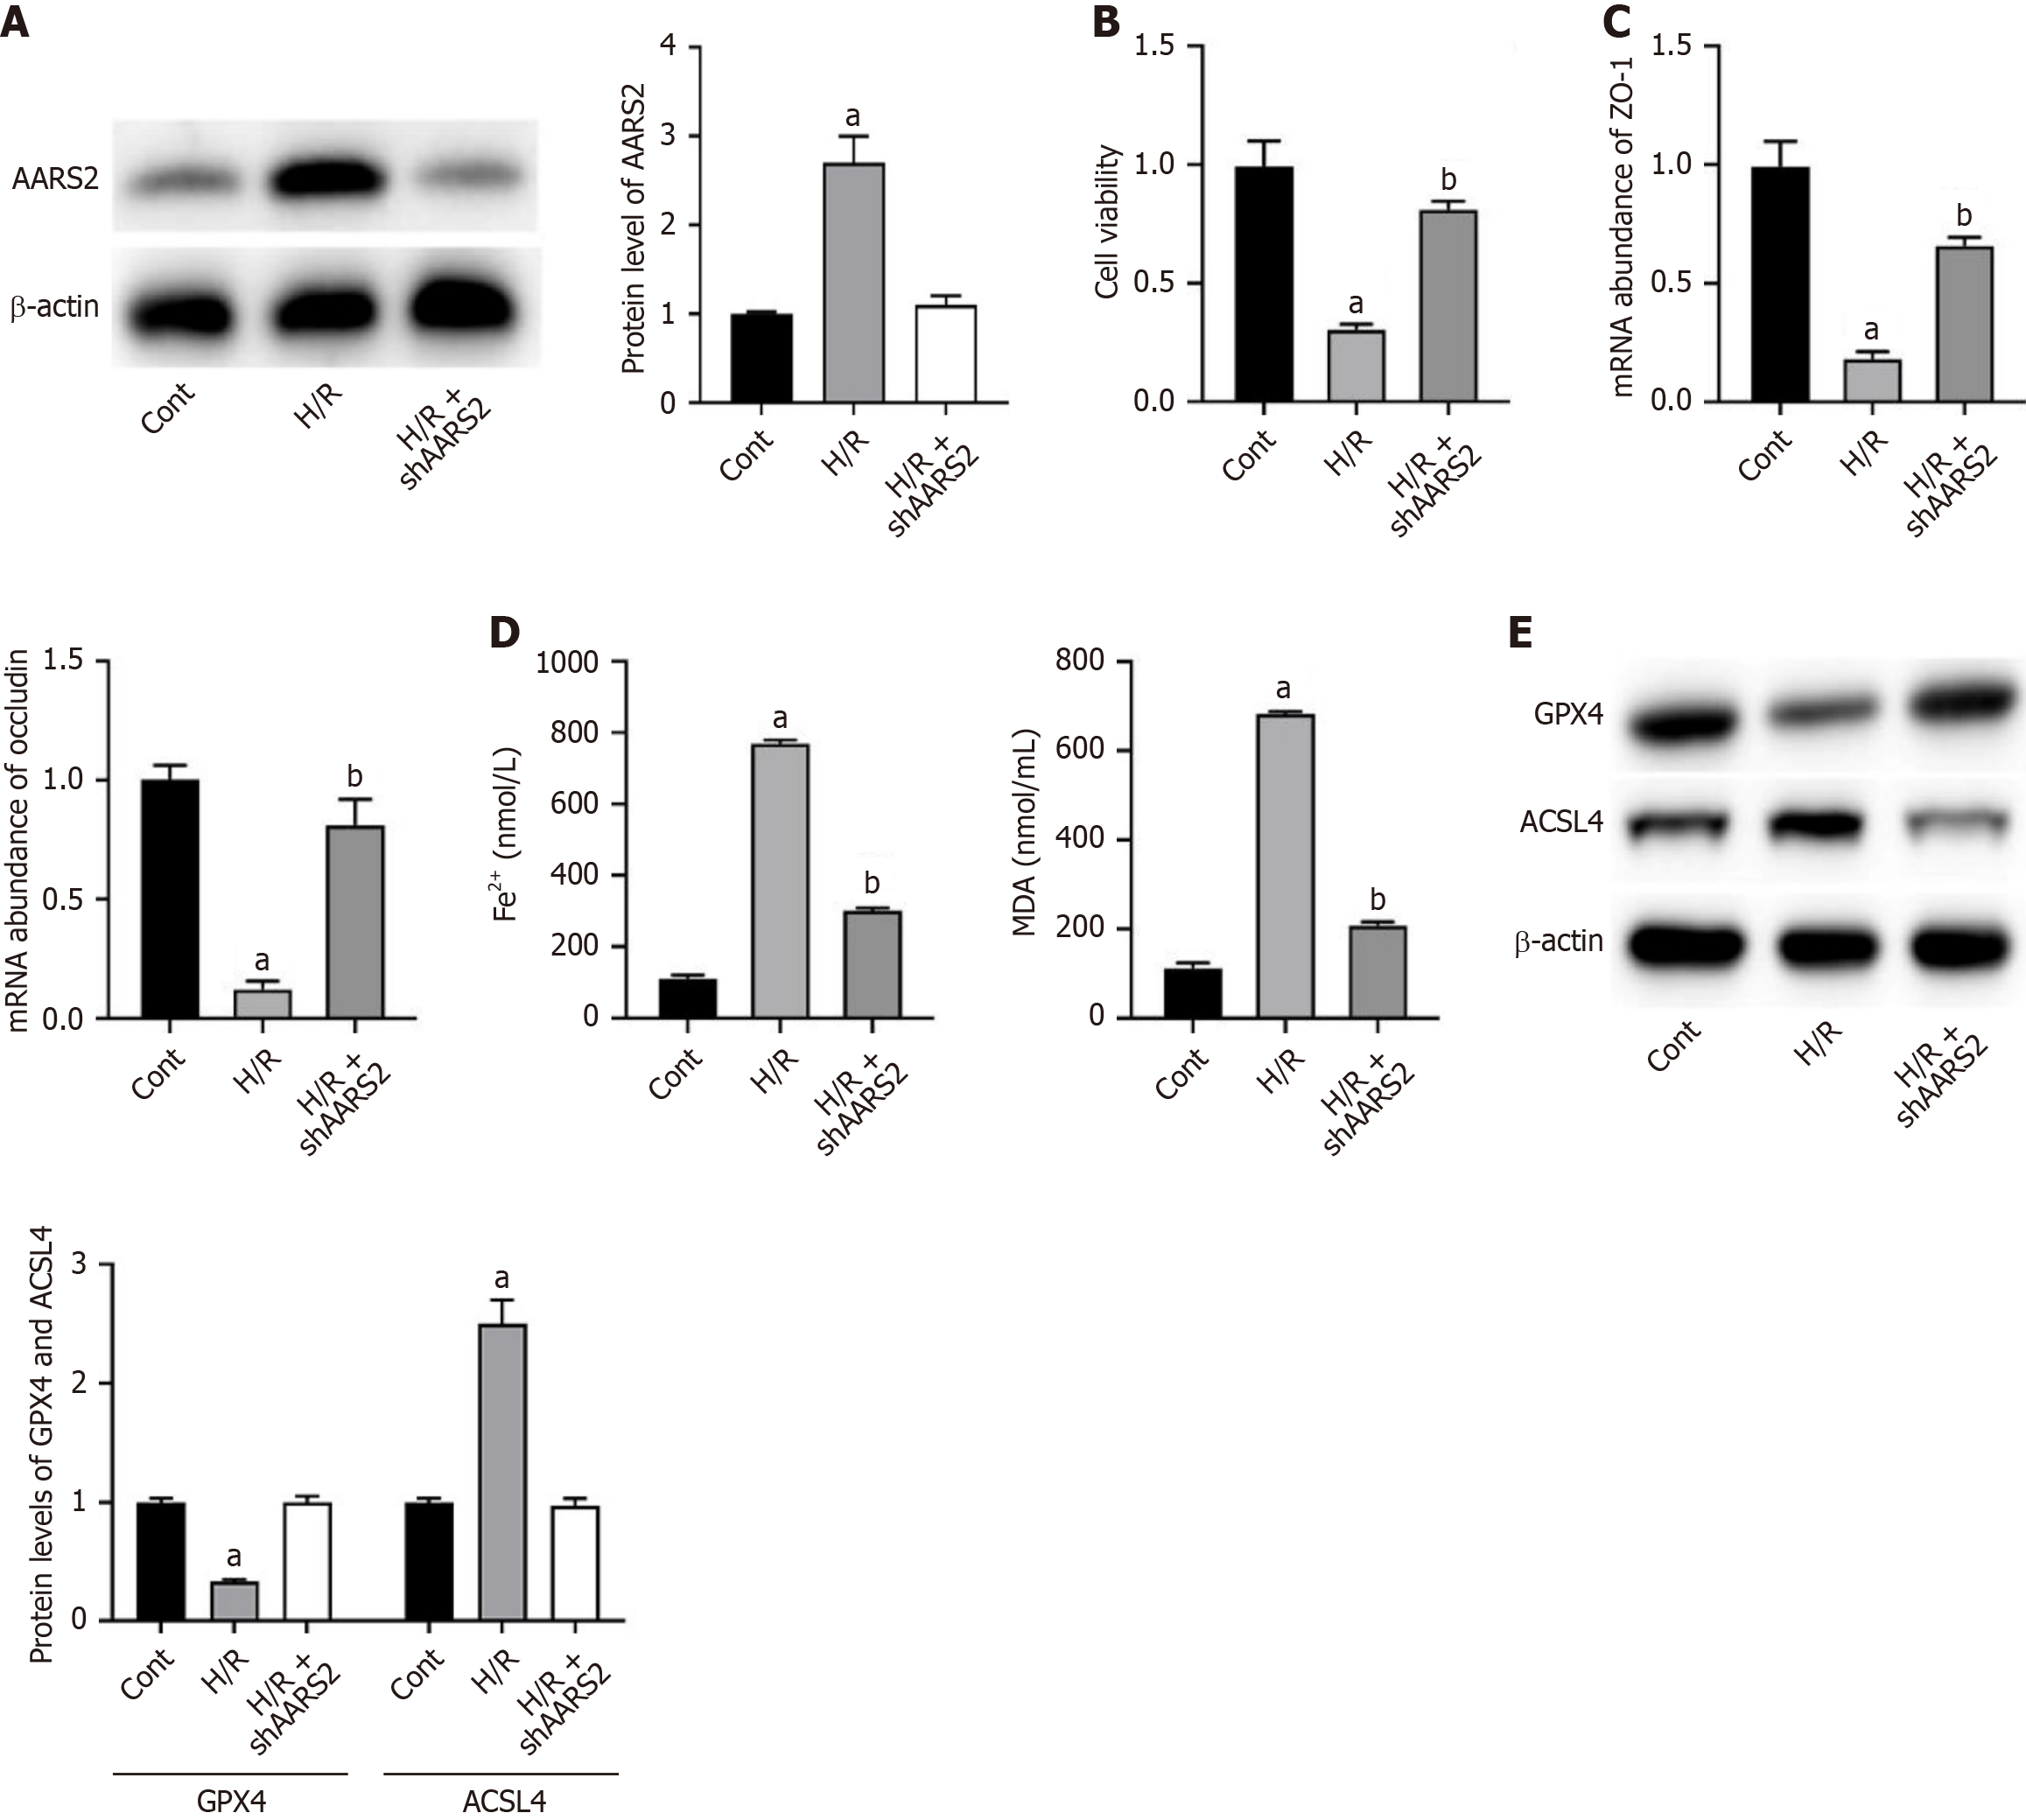
Figure 2 Mitochondrial alanyl-tRNA synthetase 2 increases in vitro cell injury.
A: Protein level of mitochondrial alanyl-tRNA synthetase 2 (AARS2) in cells. Protein levels of AARS2 in cells normalized to β-actin. Bar graphs show densitometric quantification (mean ± SD); B: Cell viability was detected by CCK-8; C: mRNA abundance of ZO-1 and occluding; D: Levels of Fe2+ and malondialdehyde; E: Protein levels of GPX4 and acyl-CoA synthetase long-chain family member 4 (ACSL4) in cells. Protein levels of GPX4 and ACSL4 in cells normalized to β-actin. Bar graphs show densitometric quantification (mean ± SD). aP < 0.01 vs cont, bP < 0.01 vs hypoxia-reperfusion. H/R: Hypoxia-reperfusion; AARS2: Mitochondrial alanyl-tRNA synthetase 2.
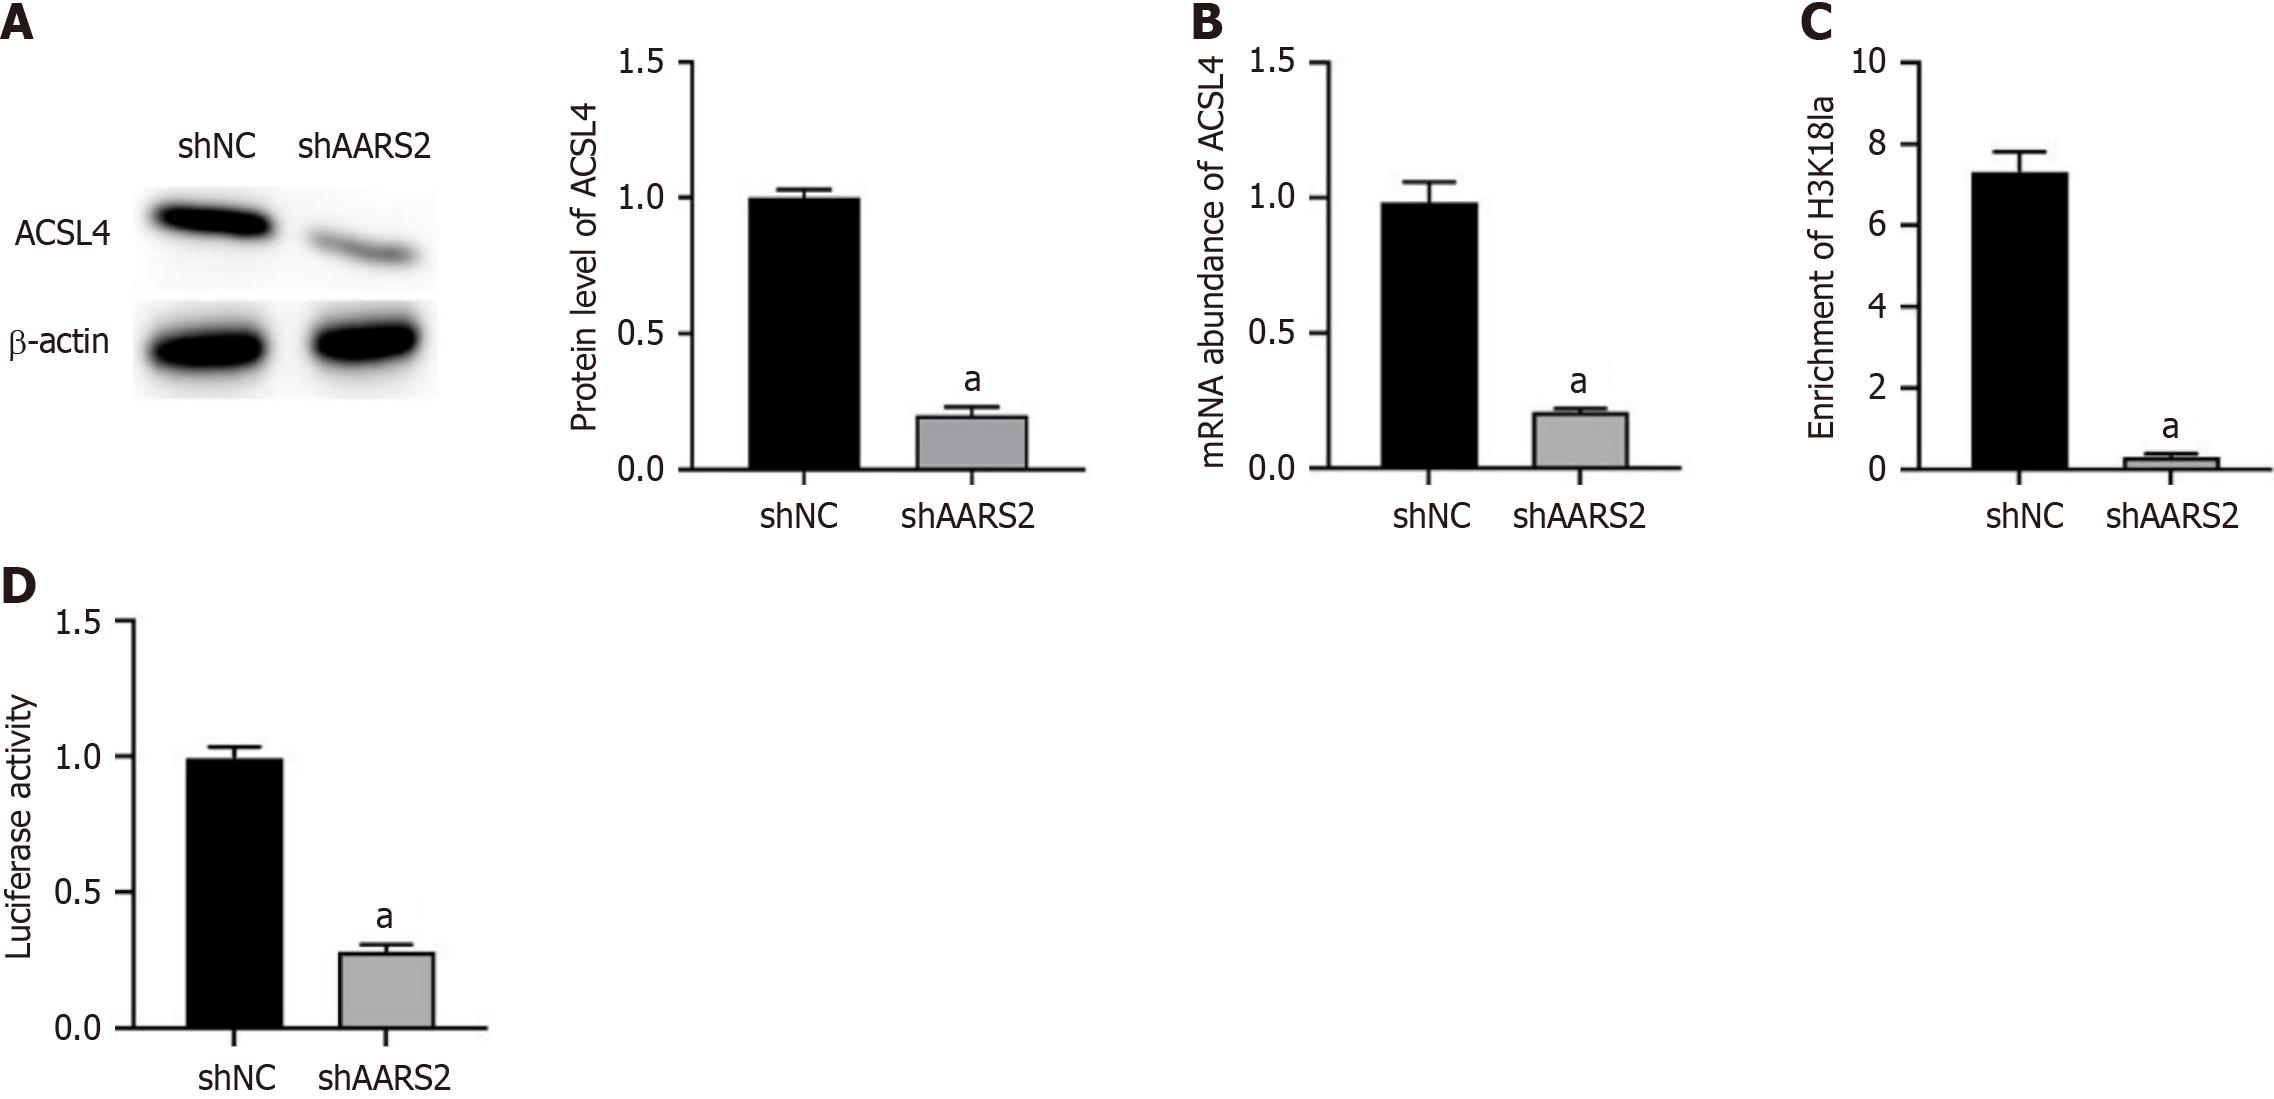
Figure 3 Mitochondrial alanyl-tRNA synthetase 2 epigenetically upregulates acyl-CoA synthetase long-chain family member 4 expression via histone lactylation.
A and B: The (A) protein expression [Protein levels of acyl-CoA synthetase long-chain family member 4 (ACSL4) in Caco-2 cells normalized to β-actin. Bar graphs show densitometric quantification (mean ± SD)] and (B) RNA level of ACSL4 in Caco-2 cells that depleted of AARS2; C: The enrichment of H3K18 La in histone of ACSL4 gene; D: The luciferase activity of ACSL4 gene promoter. aP < 0.01 vs shNC.
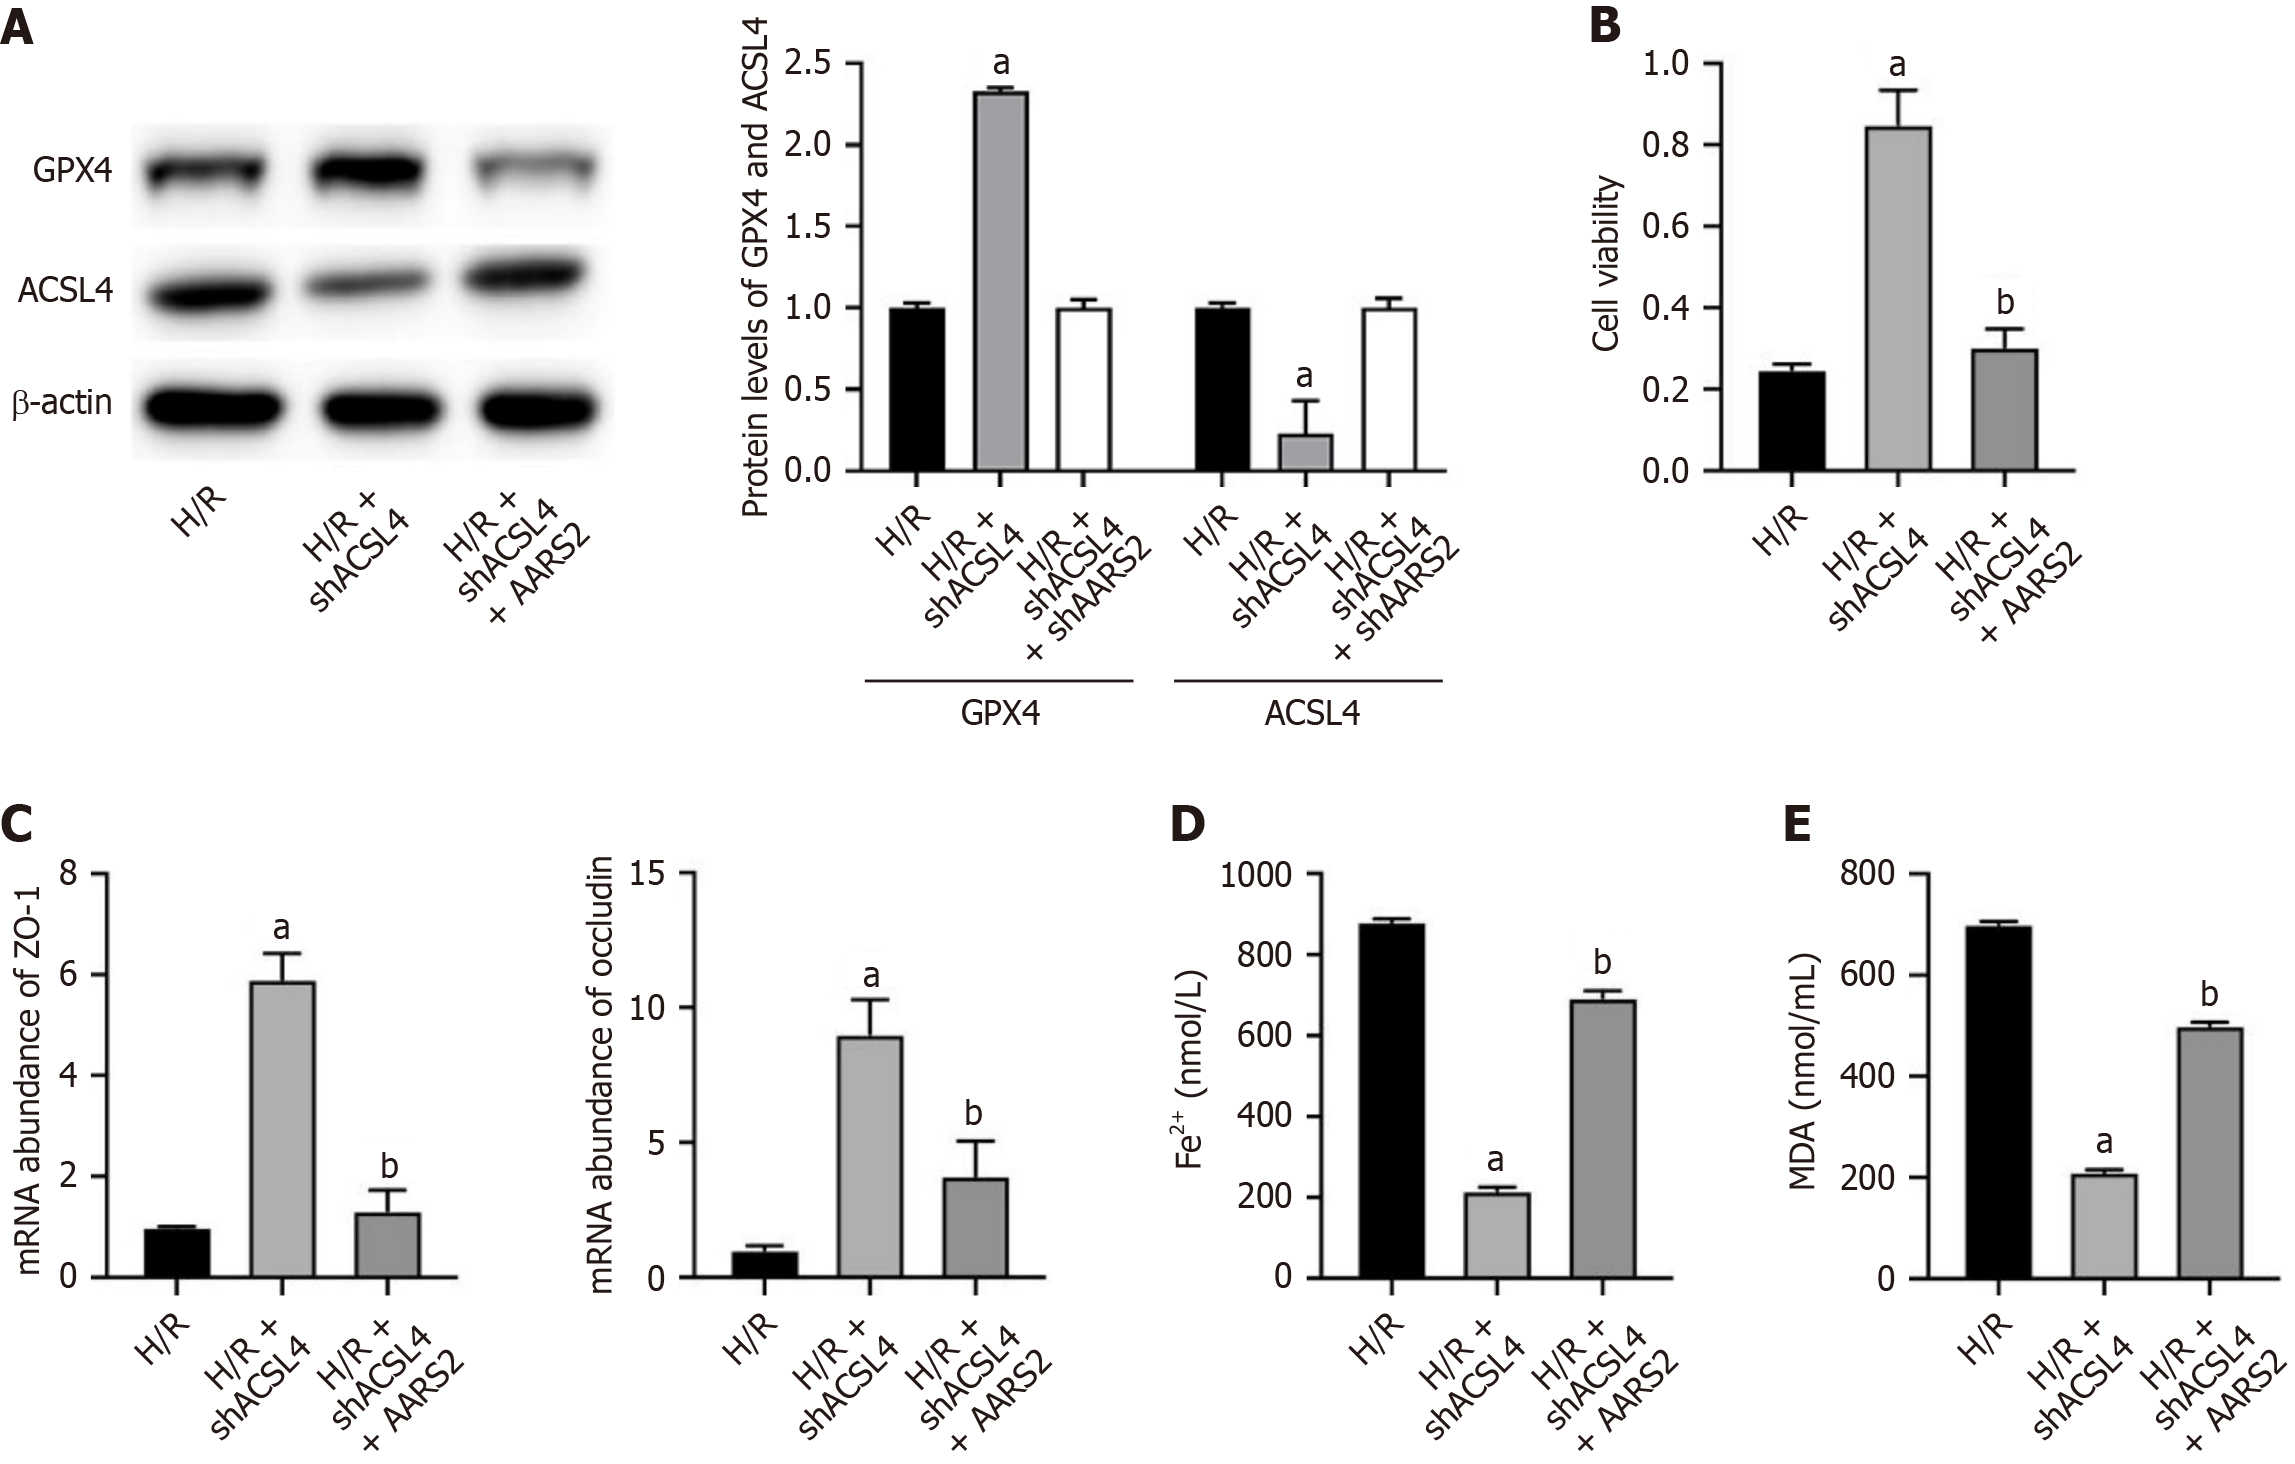
Figure 4 Mitochondrial alanyl-tRNA synthetase 2 induces cell ferroptosis via regulating acyl-CoA synthetase long-chain family member 4.
A: Protein level of acyl-CoA synthetase long-chain family member 4 (ACSL4) and GPX4 in cells. Protein levels of GPX4 and ACSL4 in cells normalized to β-actin. Bar graphs show densitometric quantification (mean ± SD); B: Cell viability was detected by CCK-8; C: mRNA abundance of ZO-1 and occluding; D: Levels of Fe2+; E: Malondialdehyde. aP < 0.01 vs hypoxia-reperfusion, bP < 0.01 vs hypoxia-reperfusion + shACSL4. H/R: Hypoxia-reperfusion; AARS2: Mitochondrial alanyl-tRNA synthetase 2.
- Citation: Dong W, Huang SX, Qin ML, Pan Z. Mitochondrial alanyl-tRNA synthetase 2 mediates histone lactylation to promote ferroptosis in intestinal ischemia-reperfusion injury. World J Gastrointest Surg 2025; 17(6): 106777
- URL: https://www.wjgnet.com/1948-9366/full/v17/i6/106777.htm
- DOI: https://dx.doi.org/10.4240/wjgs.v17.i6.106777


