Copyright
©The Author(s) 2025.
World J Gastrointest Surg. Jun 27, 2025; 17(6): 104545
Published online Jun 27, 2025. doi: 10.4240/wjgs.v17.i6.104545
Published online Jun 27, 2025. doi: 10.4240/wjgs.v17.i6.104545
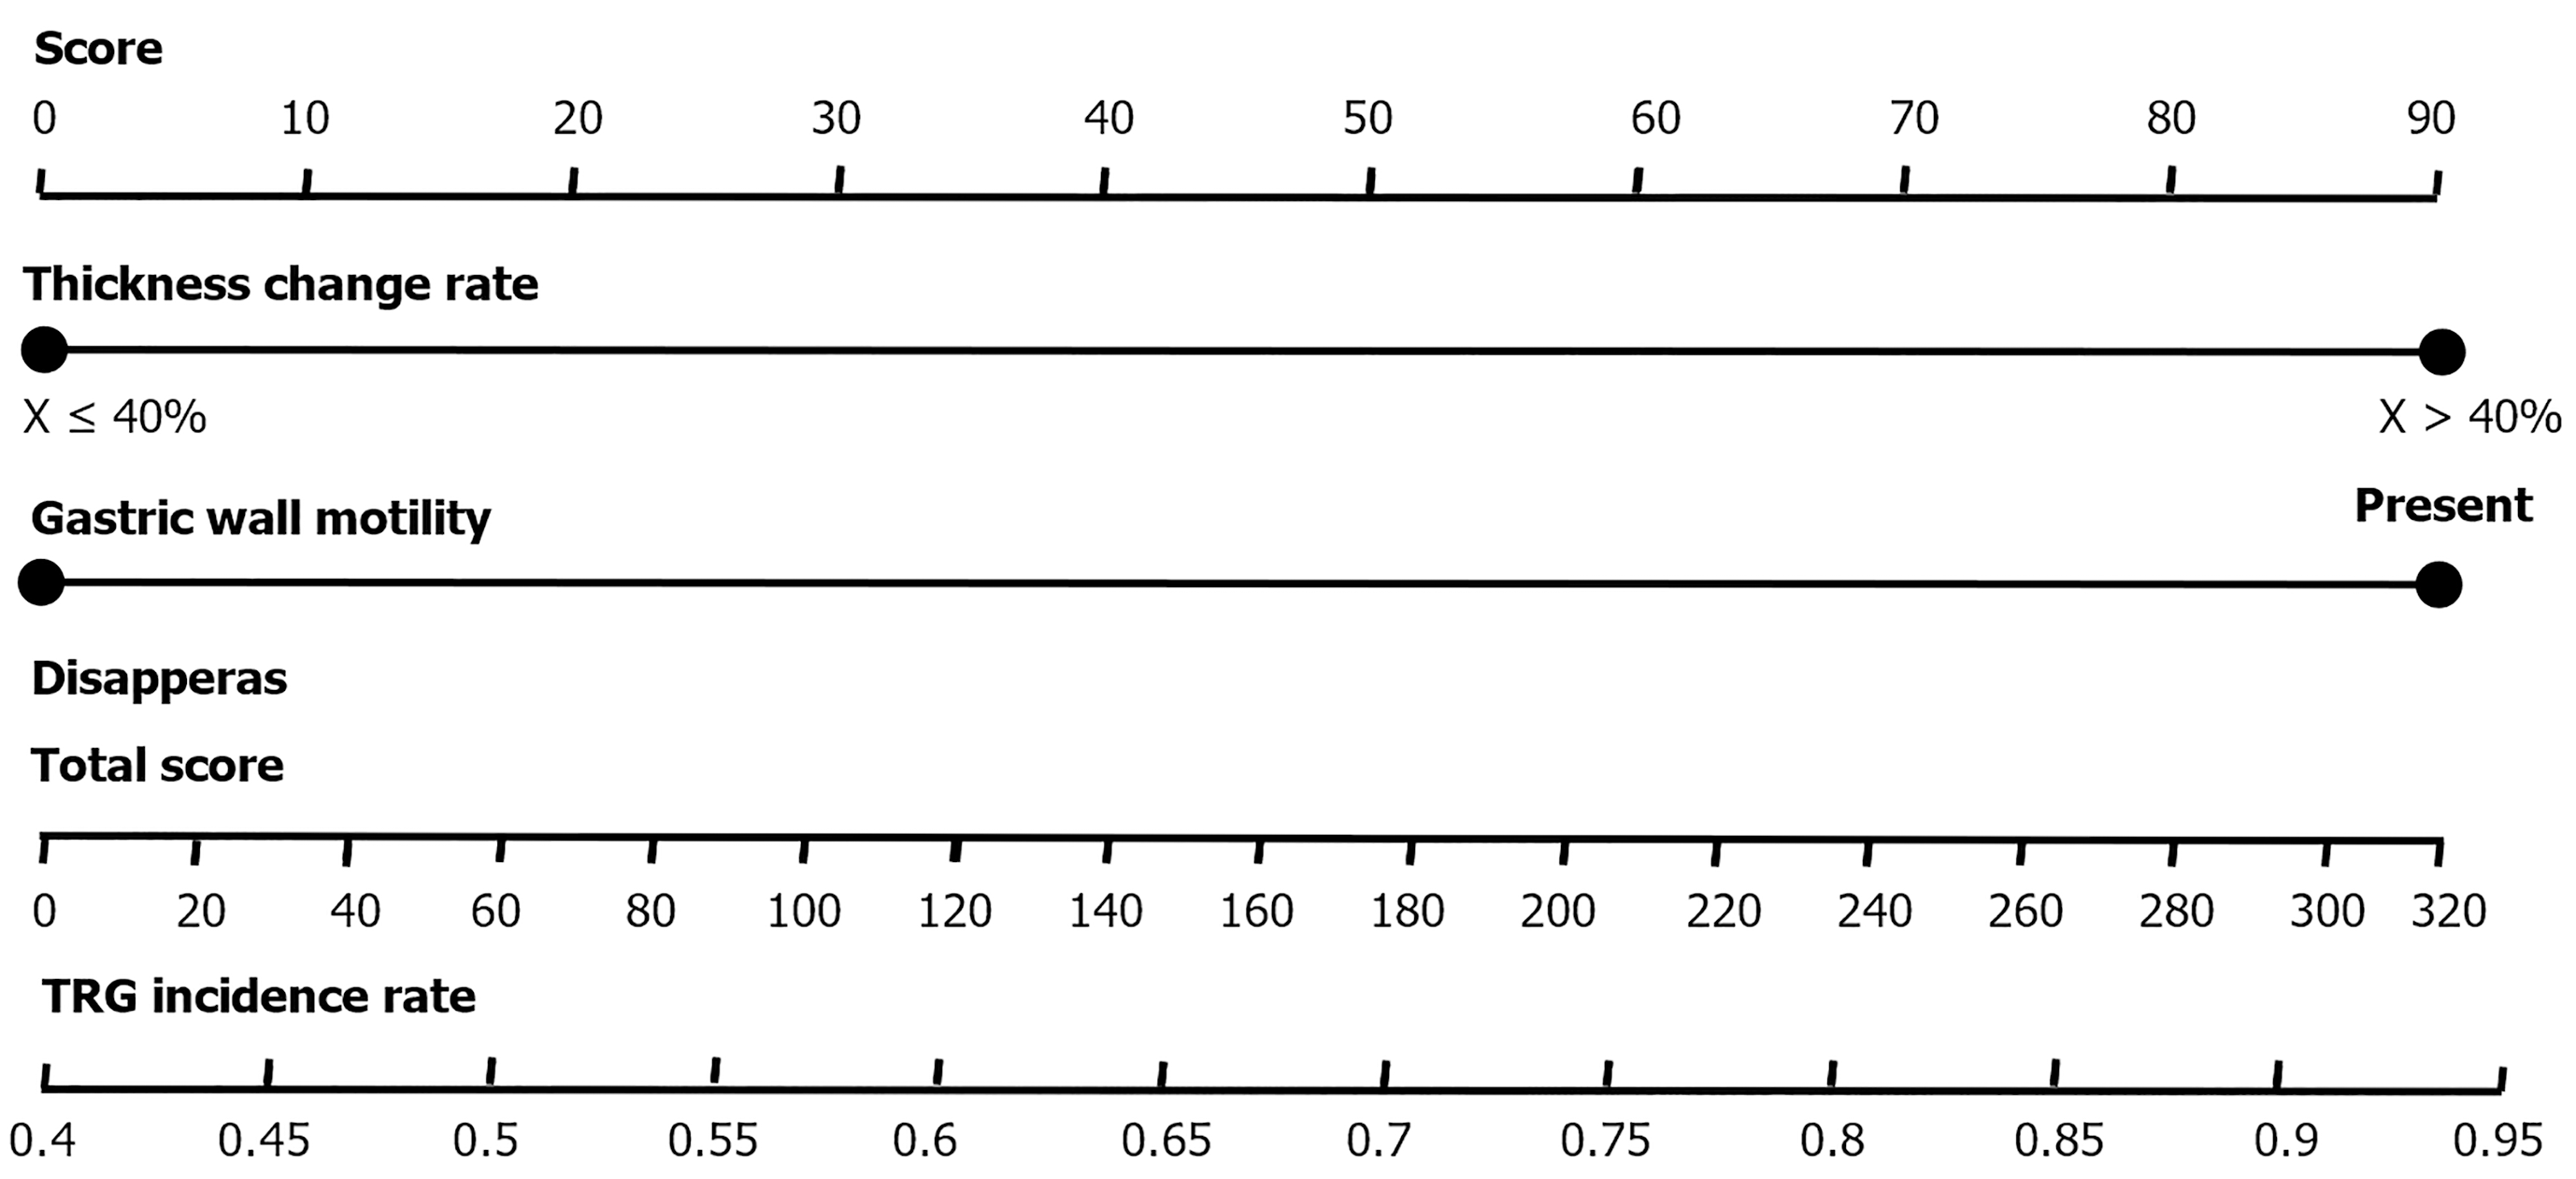
Figure 1 Column line chart prediction model.
This is a scoring system consisting of three main evaluation indicators: Thickness change rate, gastric wall motility, and disappearance. Each indicator has a score range of 0-90 points, with a total score ranging from 0 to 320 points. The system displays a tumor regression grade incidence rate indicator at the bottom, ranging from 0.4 to 0.95. This scoring system can be used to evaluate medical conditions or treatment effectiveness. TRG: Tumor regression grade.
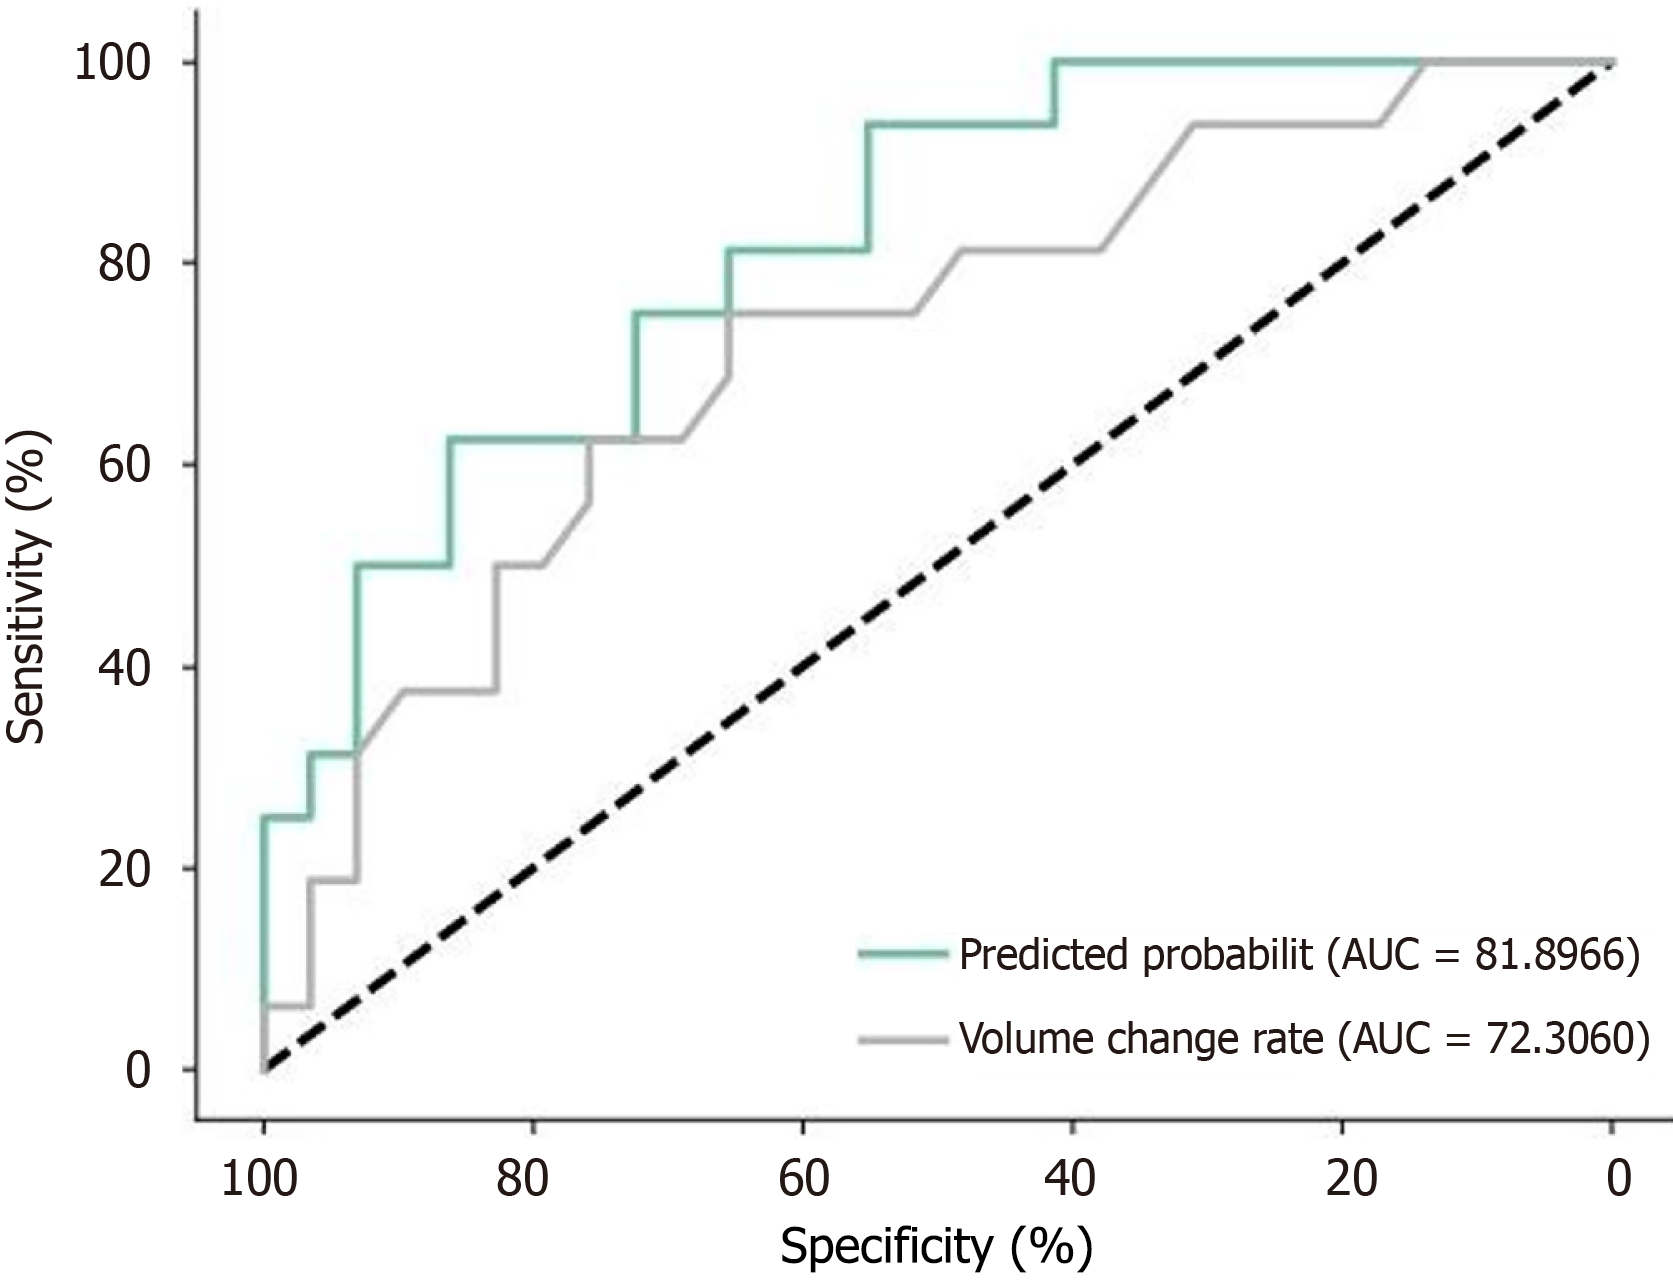
Figure 2 Receiver operating characteristic curve of volume change rate and computed tomography subjective efficacy model.
This receiver operating characteristic curve shows a comparison of two indicators: Predicted probability: Area under the curve (AUC) = 0.81966, volume change rate: AUC = 0.72306. AUC: Area under the curve.
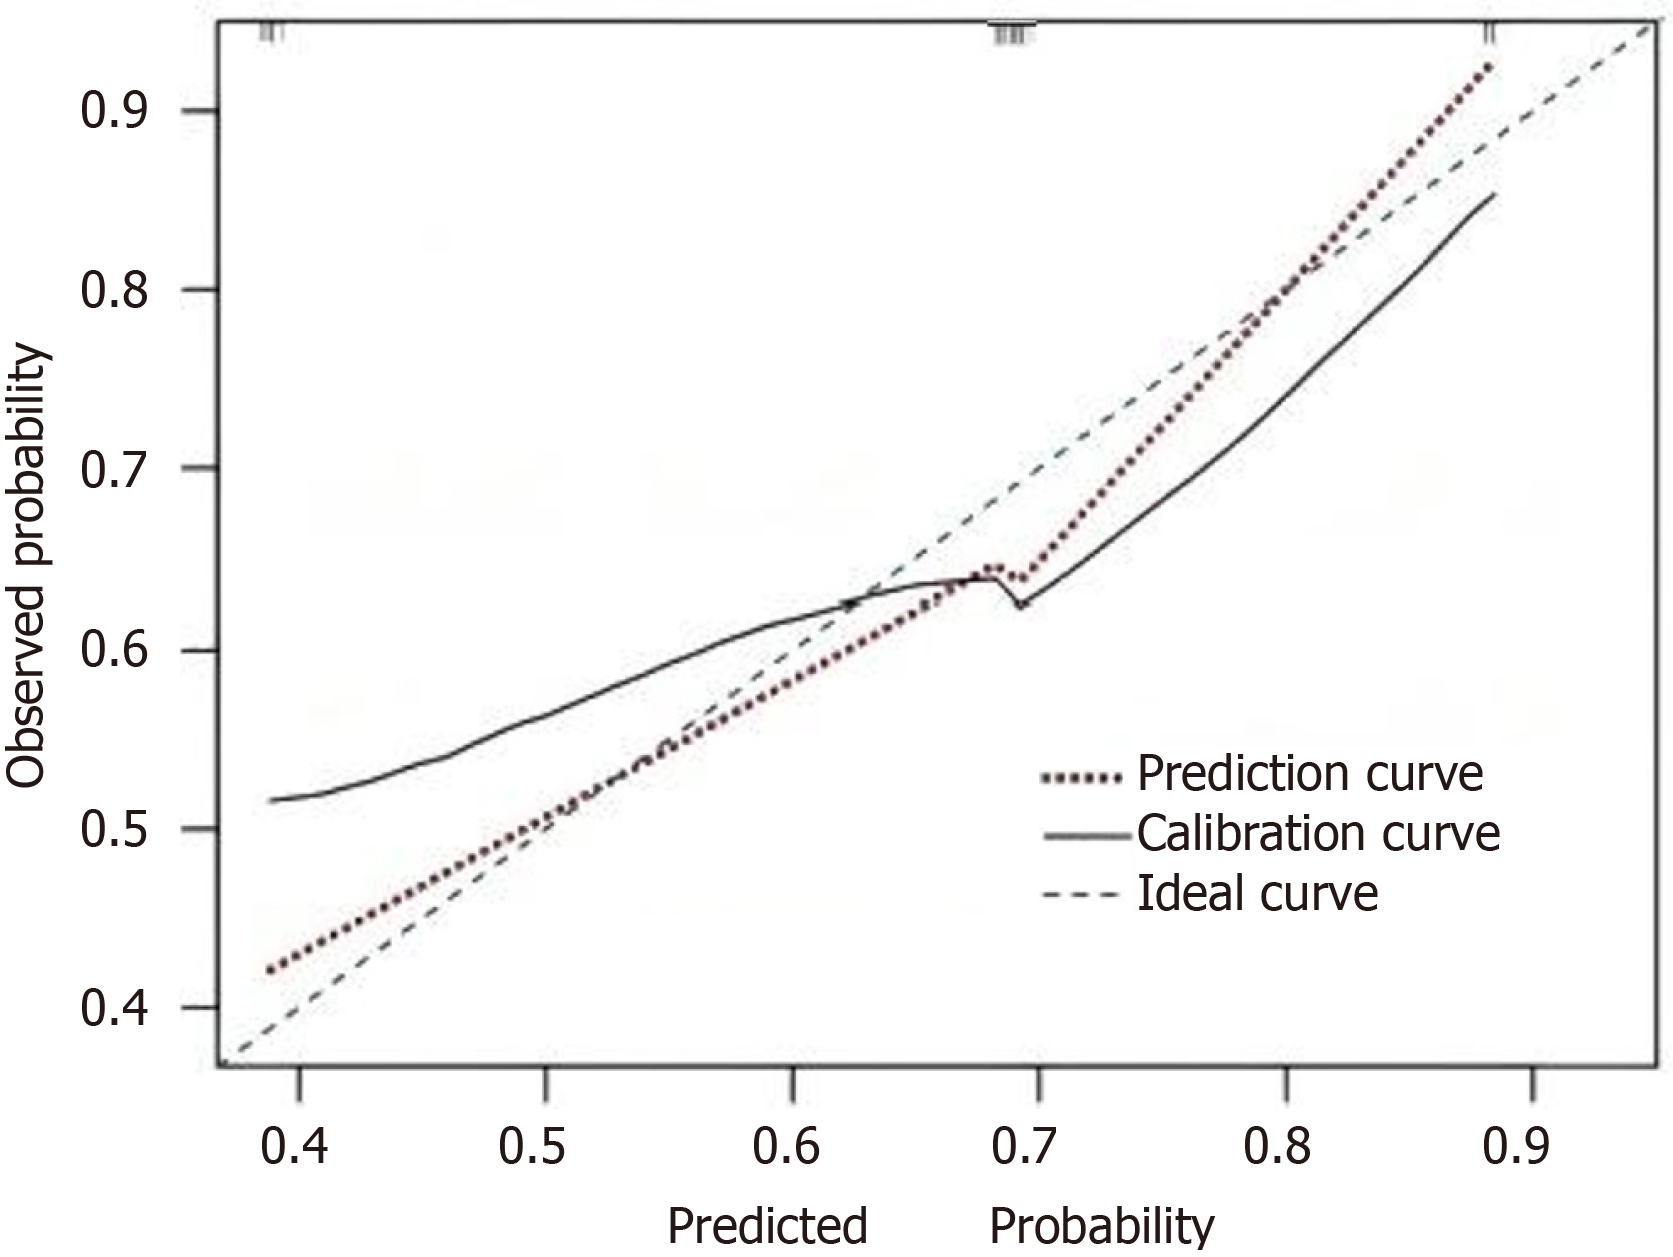
Figure 3 Calibration curve of prediction model.
This is a calibration curve used to evaluate model prediction accuracy. The graph contains three curves: A prediction curve (dashed line), a calibrated line curve (red dotted line), and an ideal curve (solid line). Both the x-axis (predicted probability) and y-axis (observed probability) range from 0.4 to 0.9. Ideally, the prediction curve should align closely with the ideal curve, indicating good predictive accuracy of the model.
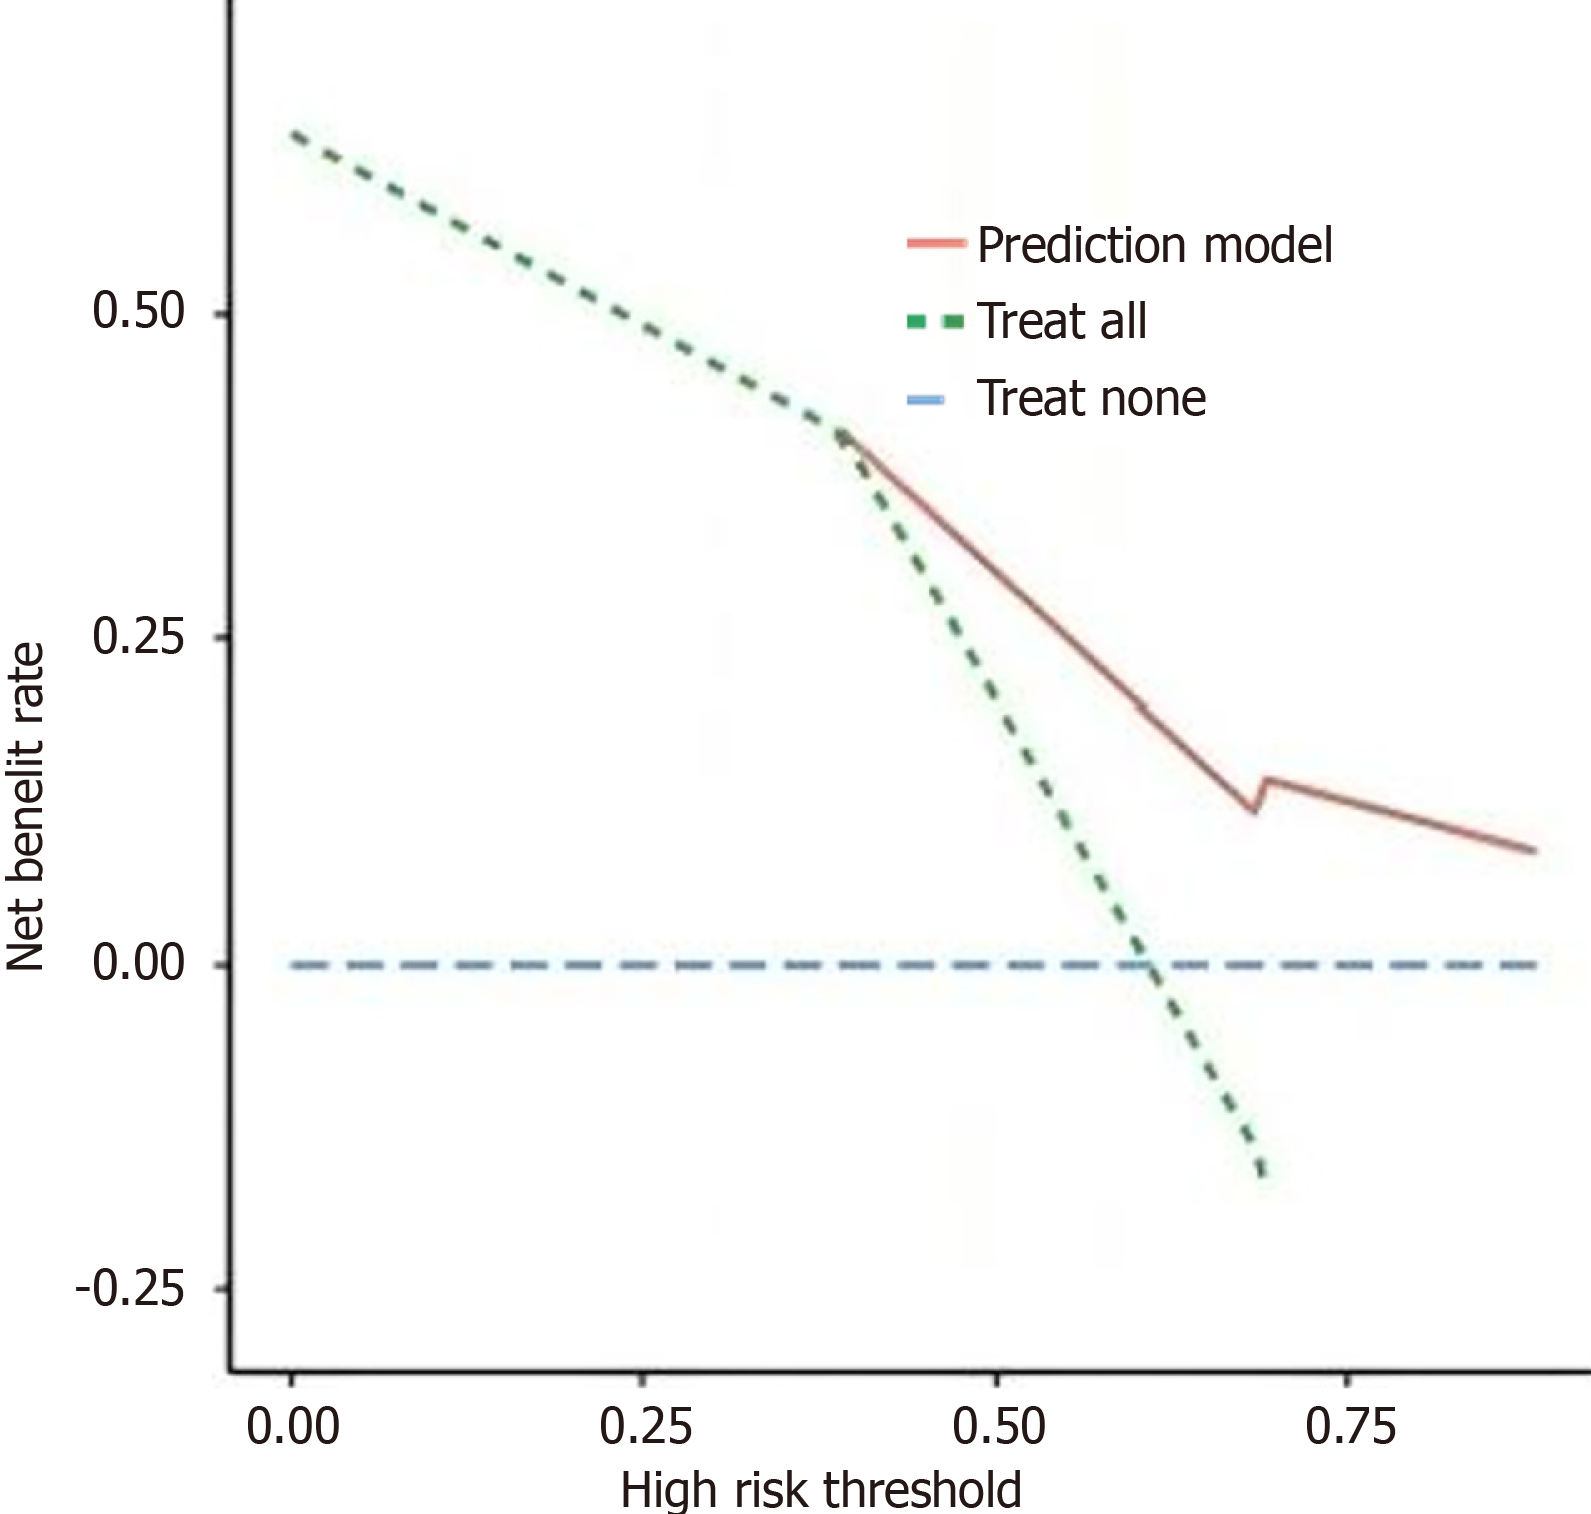
Figure 4 Analysis of decision curve analysis curve of prediction model.
The graph compares the net benefit of three treatment strategies: Prediction model, treat all, and treat none. Before a risk threshold of 0.5, treating all patients shows the best results; after that, the prediction model performs better. The treat-none strategy maintains near-zero benefit throughout. This helps select the optimal treatment approach based on patient risk levels.
- Citation: Wang CY, Zhang L, Ma JW. Computed tomography 3D reconstruction and texture analysis for evaluating the efficacy of neoadjuvant chemotherapy in advanced gastric cancer. World J Gastrointest Surg 2025; 17(6): 104545
- URL: https://www.wjgnet.com/1948-9366/full/v17/i6/104545.htm
- DOI: https://dx.doi.org/10.4240/wjgs.v17.i6.104545


