Copyright
©The Author(s) 2025.
World J Gastrointest Surg. Jun 27, 2025; 17(6): 104545
Published online Jun 27, 2025. doi: 10.4240/wjgs.v17.i6.104545
Published online Jun 27, 2025. doi: 10.4240/wjgs.v17.i6.104545
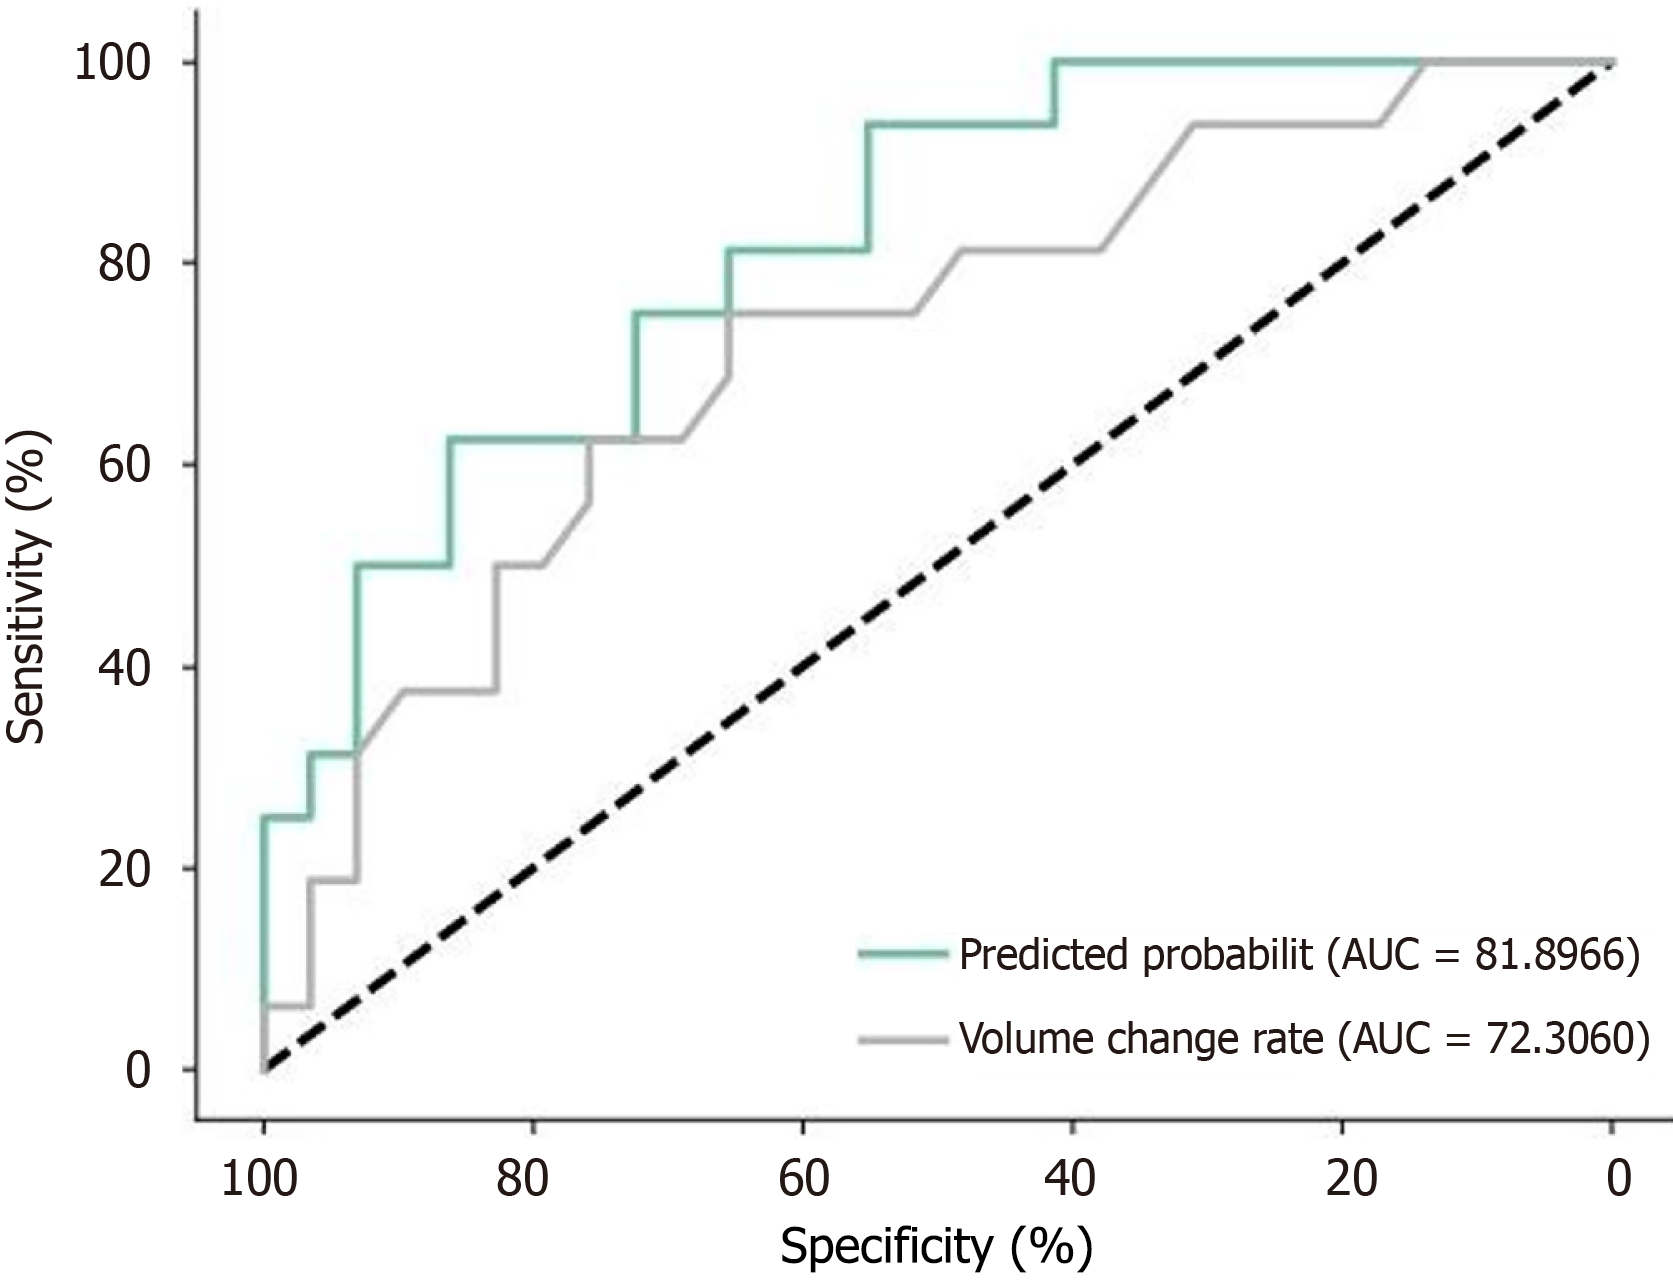
Figure 2 Receiver operating characteristic curve of volume change rate and computed tomography subjective efficacy model.
This receiver operating characteristic curve shows a comparison of two indicators: Predicted probability: Area under the curve (AUC) = 0.81966, volume change rate: AUC = 0.72306. AUC: Area under the curve.
- Citation: Wang CY, Zhang L, Ma JW. Computed tomography 3D reconstruction and texture analysis for evaluating the efficacy of neoadjuvant chemotherapy in advanced gastric cancer. World J Gastrointest Surg 2025; 17(6): 104545
- URL: https://www.wjgnet.com/1948-9366/full/v17/i6/104545.htm
- DOI: https://dx.doi.org/10.4240/wjgs.v17.i6.104545


