Copyright
©The Author(s) 2025.
World J Gastrointest Surg. Jun 27, 2025; 17(6): 104545
Published online Jun 27, 2025. doi: 10.4240/wjgs.v17.i6.104545
Published online Jun 27, 2025. doi: 10.4240/wjgs.v17.i6.104545
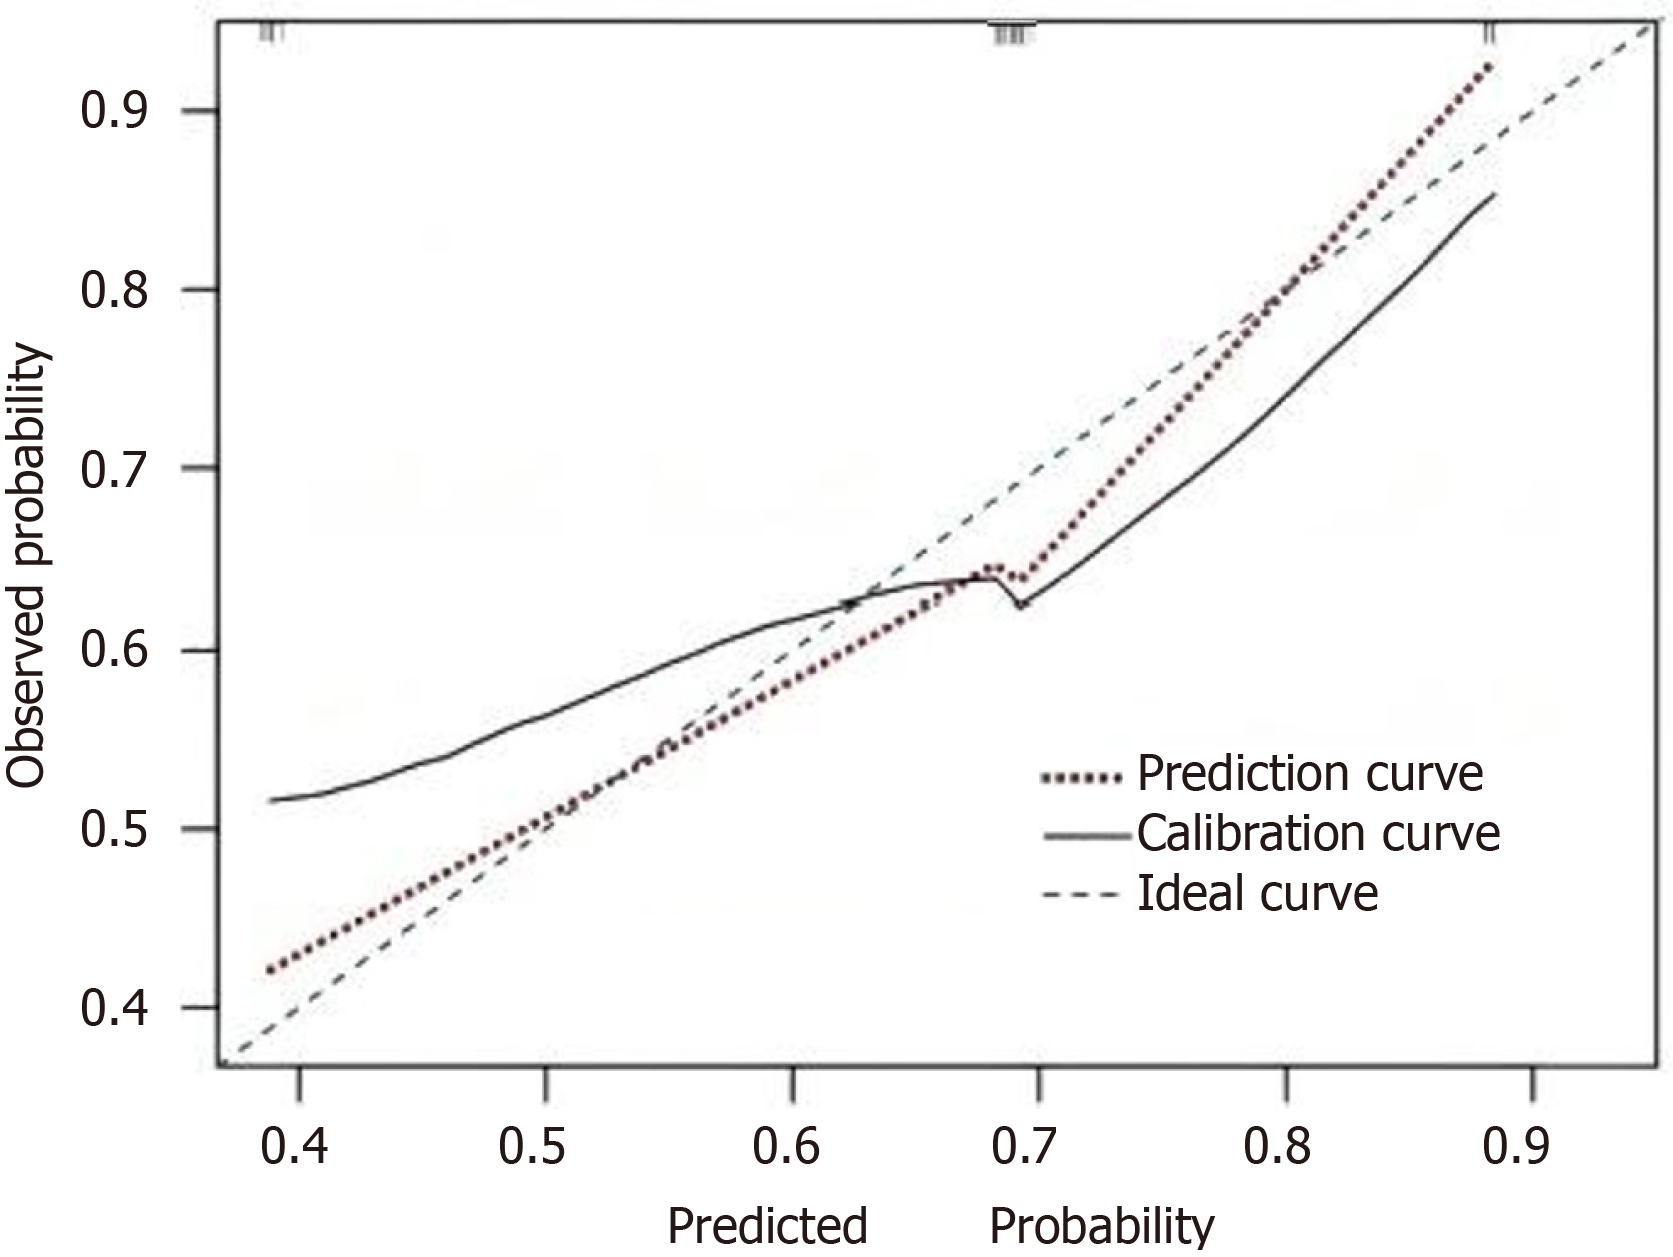
Figure 3 Calibration curve of prediction model.
This is a calibration curve used to evaluate model prediction accuracy. The graph contains three curves: A prediction curve (dashed line), a calibrated line curve (red dotted line), and an ideal curve (solid line). Both the x-axis (predicted probability) and y-axis (observed probability) range from 0.4 to 0.9. Ideally, the prediction curve should align closely with the ideal curve, indicating good predictive accuracy of the model.
- Citation: Wang CY, Zhang L, Ma JW. Computed tomography 3D reconstruction and texture analysis for evaluating the efficacy of neoadjuvant chemotherapy in advanced gastric cancer. World J Gastrointest Surg 2025; 17(6): 104545
- URL: https://www.wjgnet.com/1948-9366/full/v17/i6/104545.htm
- DOI: https://dx.doi.org/10.4240/wjgs.v17.i6.104545


