Copyright
©The Author(s) 2025.
World J Gastrointest Surg. Jun 27, 2025; 17(6): 104545
Published online Jun 27, 2025. doi: 10.4240/wjgs.v17.i6.104545
Published online Jun 27, 2025. doi: 10.4240/wjgs.v17.i6.104545
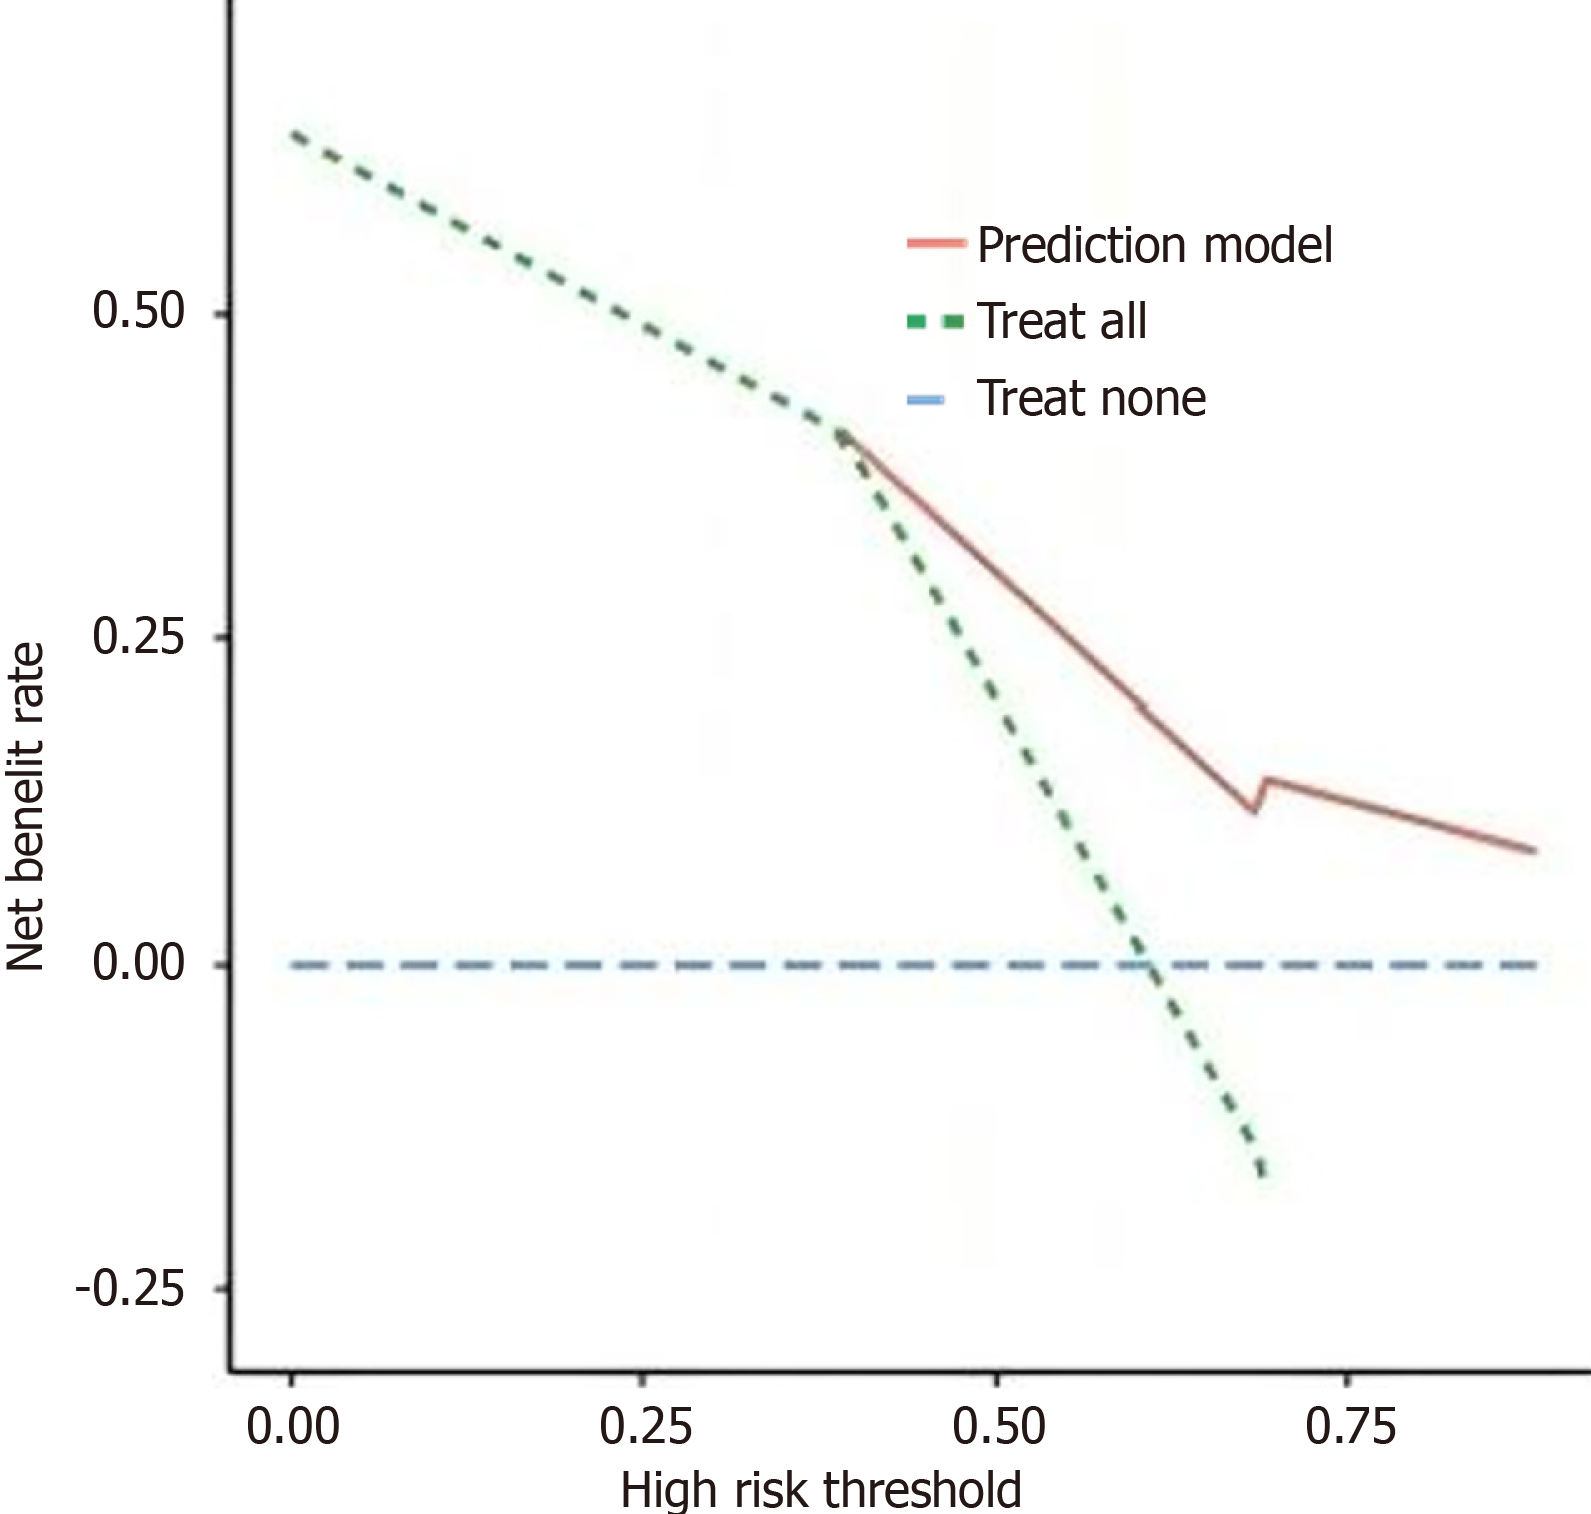
Figure 4 Analysis of decision curve analysis curve of prediction model.
The graph compares the net benefit of three treatment strategies: Prediction model, treat all, and treat none. Before a risk threshold of 0.5, treating all patients shows the best results; after that, the prediction model performs better. The treat-none strategy maintains near-zero benefit throughout. This helps select the optimal treatment approach based on patient risk levels.
- Citation: Wang CY, Zhang L, Ma JW. Computed tomography 3D reconstruction and texture analysis for evaluating the efficacy of neoadjuvant chemotherapy in advanced gastric cancer. World J Gastrointest Surg 2025; 17(6): 104545
- URL: https://www.wjgnet.com/1948-9366/full/v17/i6/104545.htm
- DOI: https://dx.doi.org/10.4240/wjgs.v17.i6.104545


