
















Copyright: ©Author(s) 2026.
World J Diabetes. Nov 15, 2026; 17(11): 124921
Published online Nov 15, 2026. doi: 10.4239/wjd.124921
Published online Nov 15, 2026. doi: 10.4239/wjd.124921
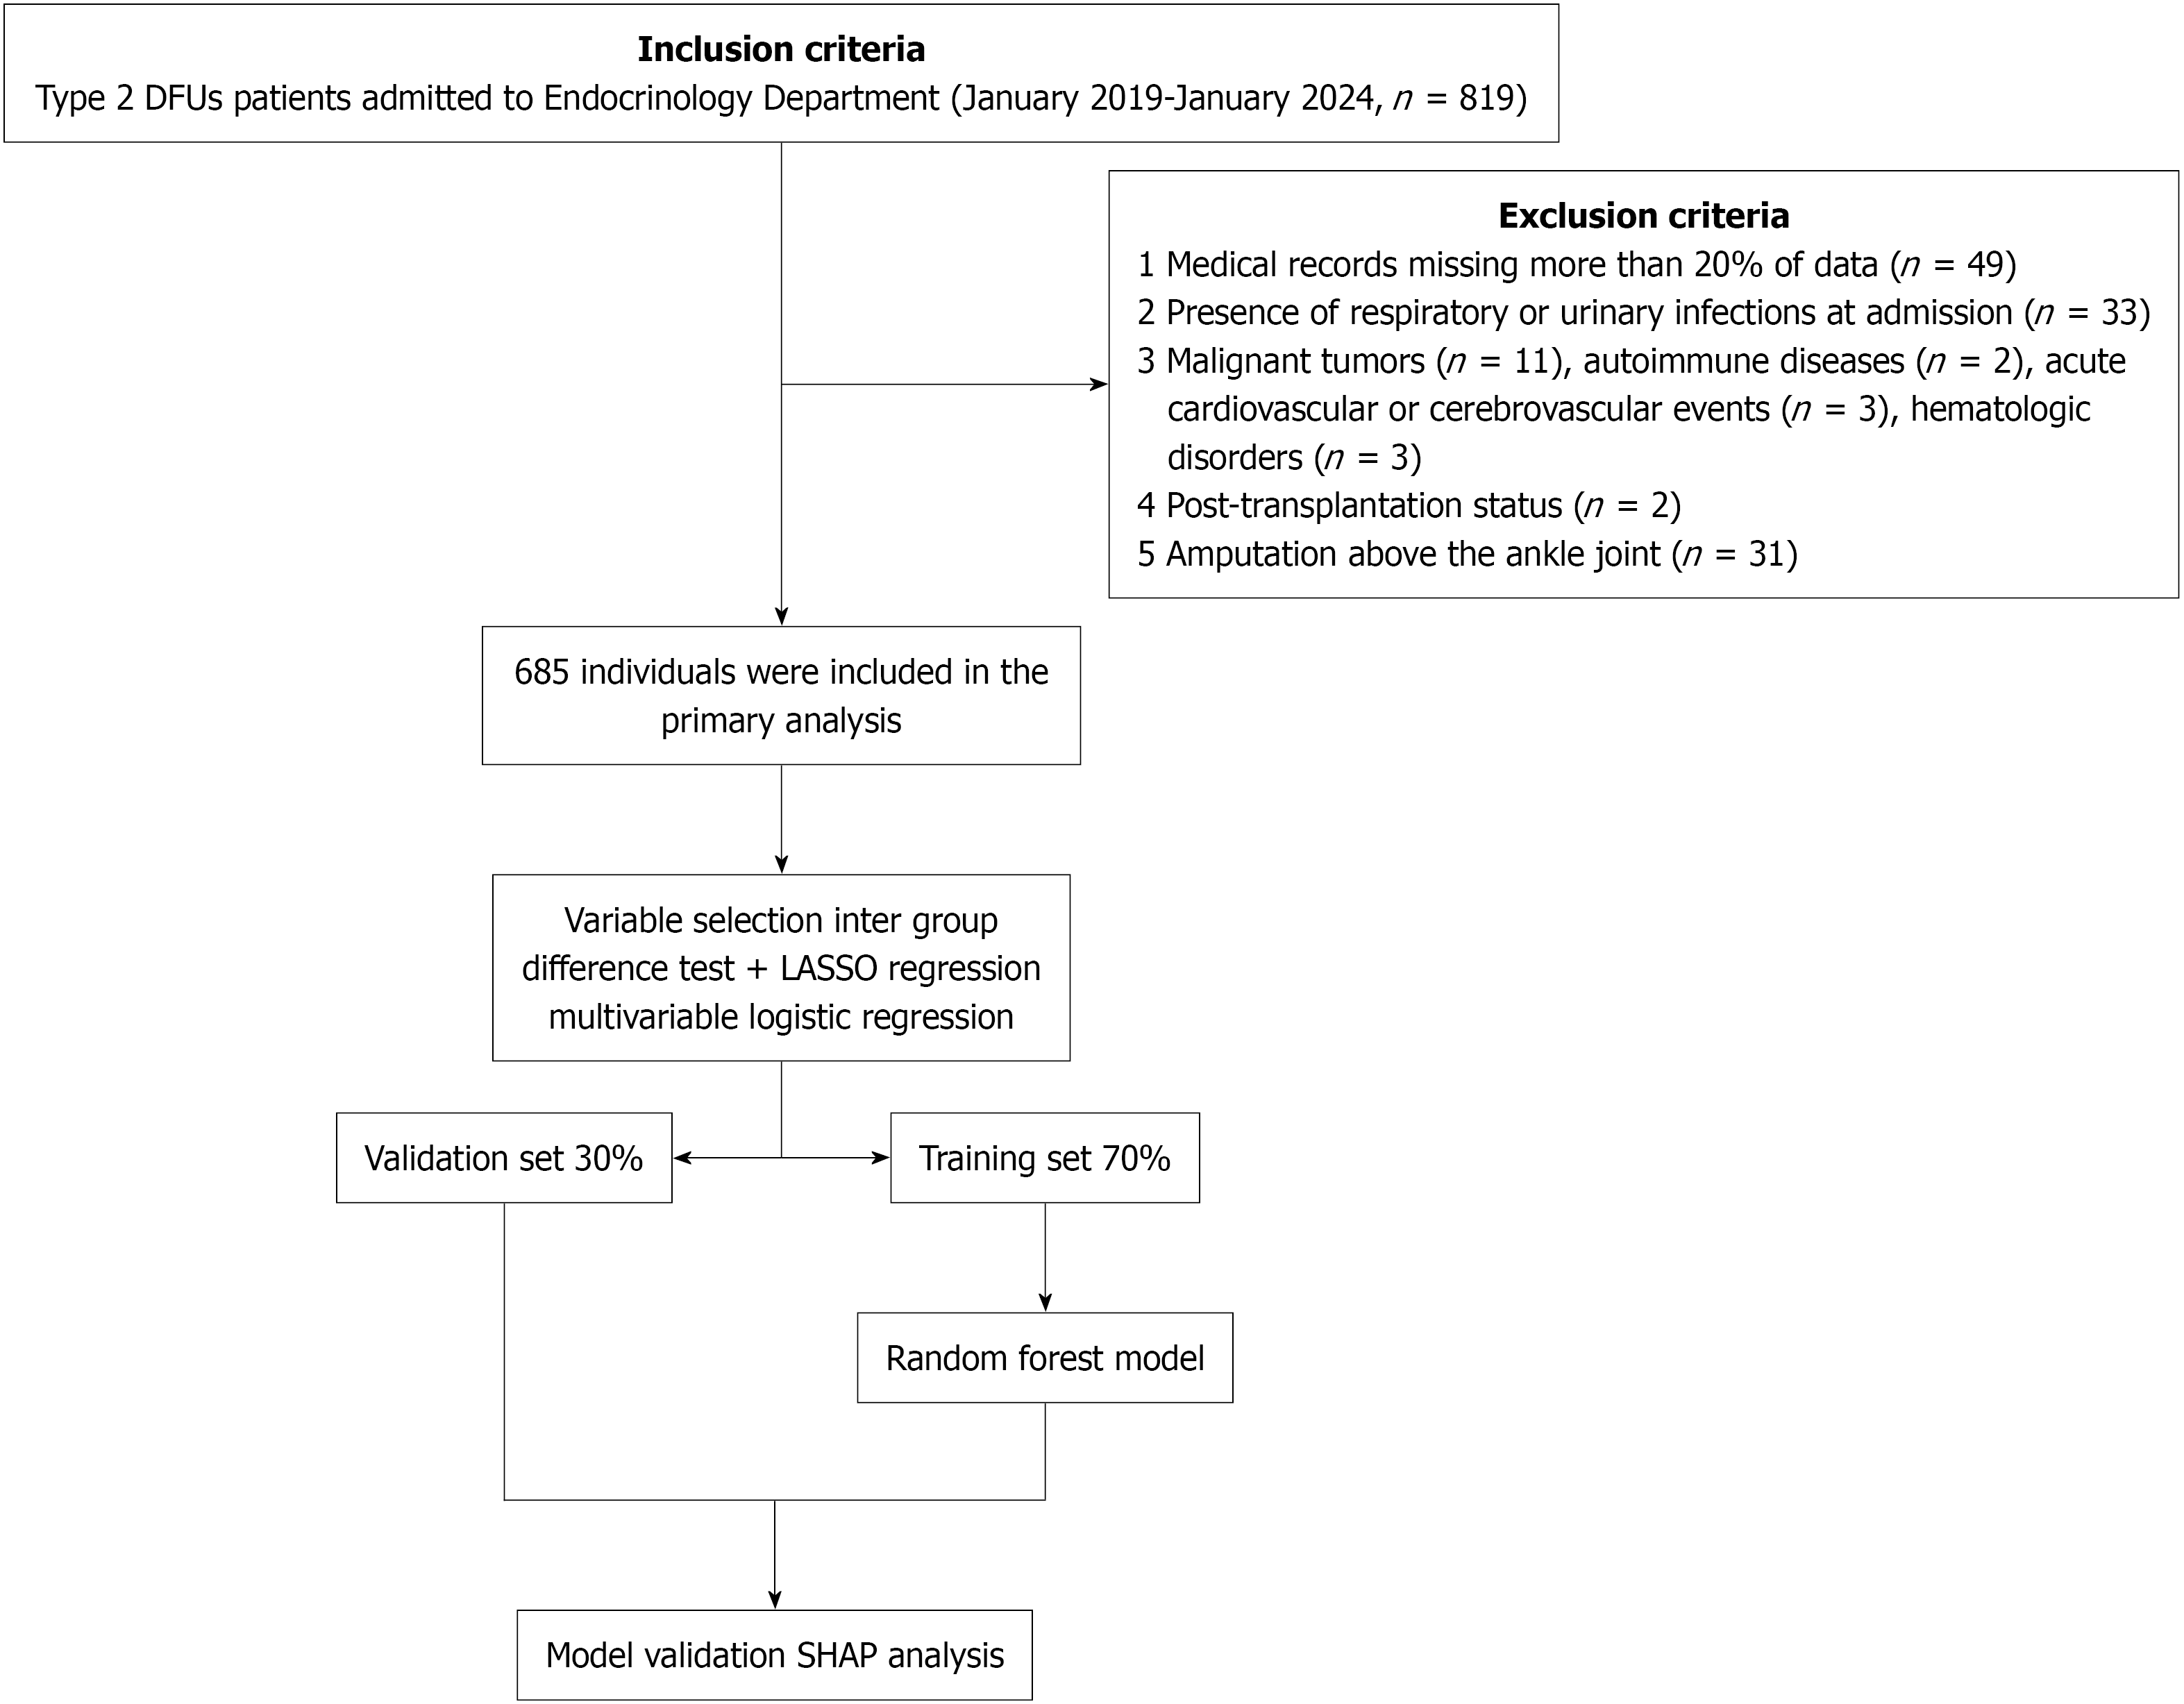
Figure 1 Machine learning model development and validation workflow.
DFUs: Diabetic foot ulcers; LASSO: Least absolute shrinkage and selection operator; SHAP: SHapley Additive exPlanations.
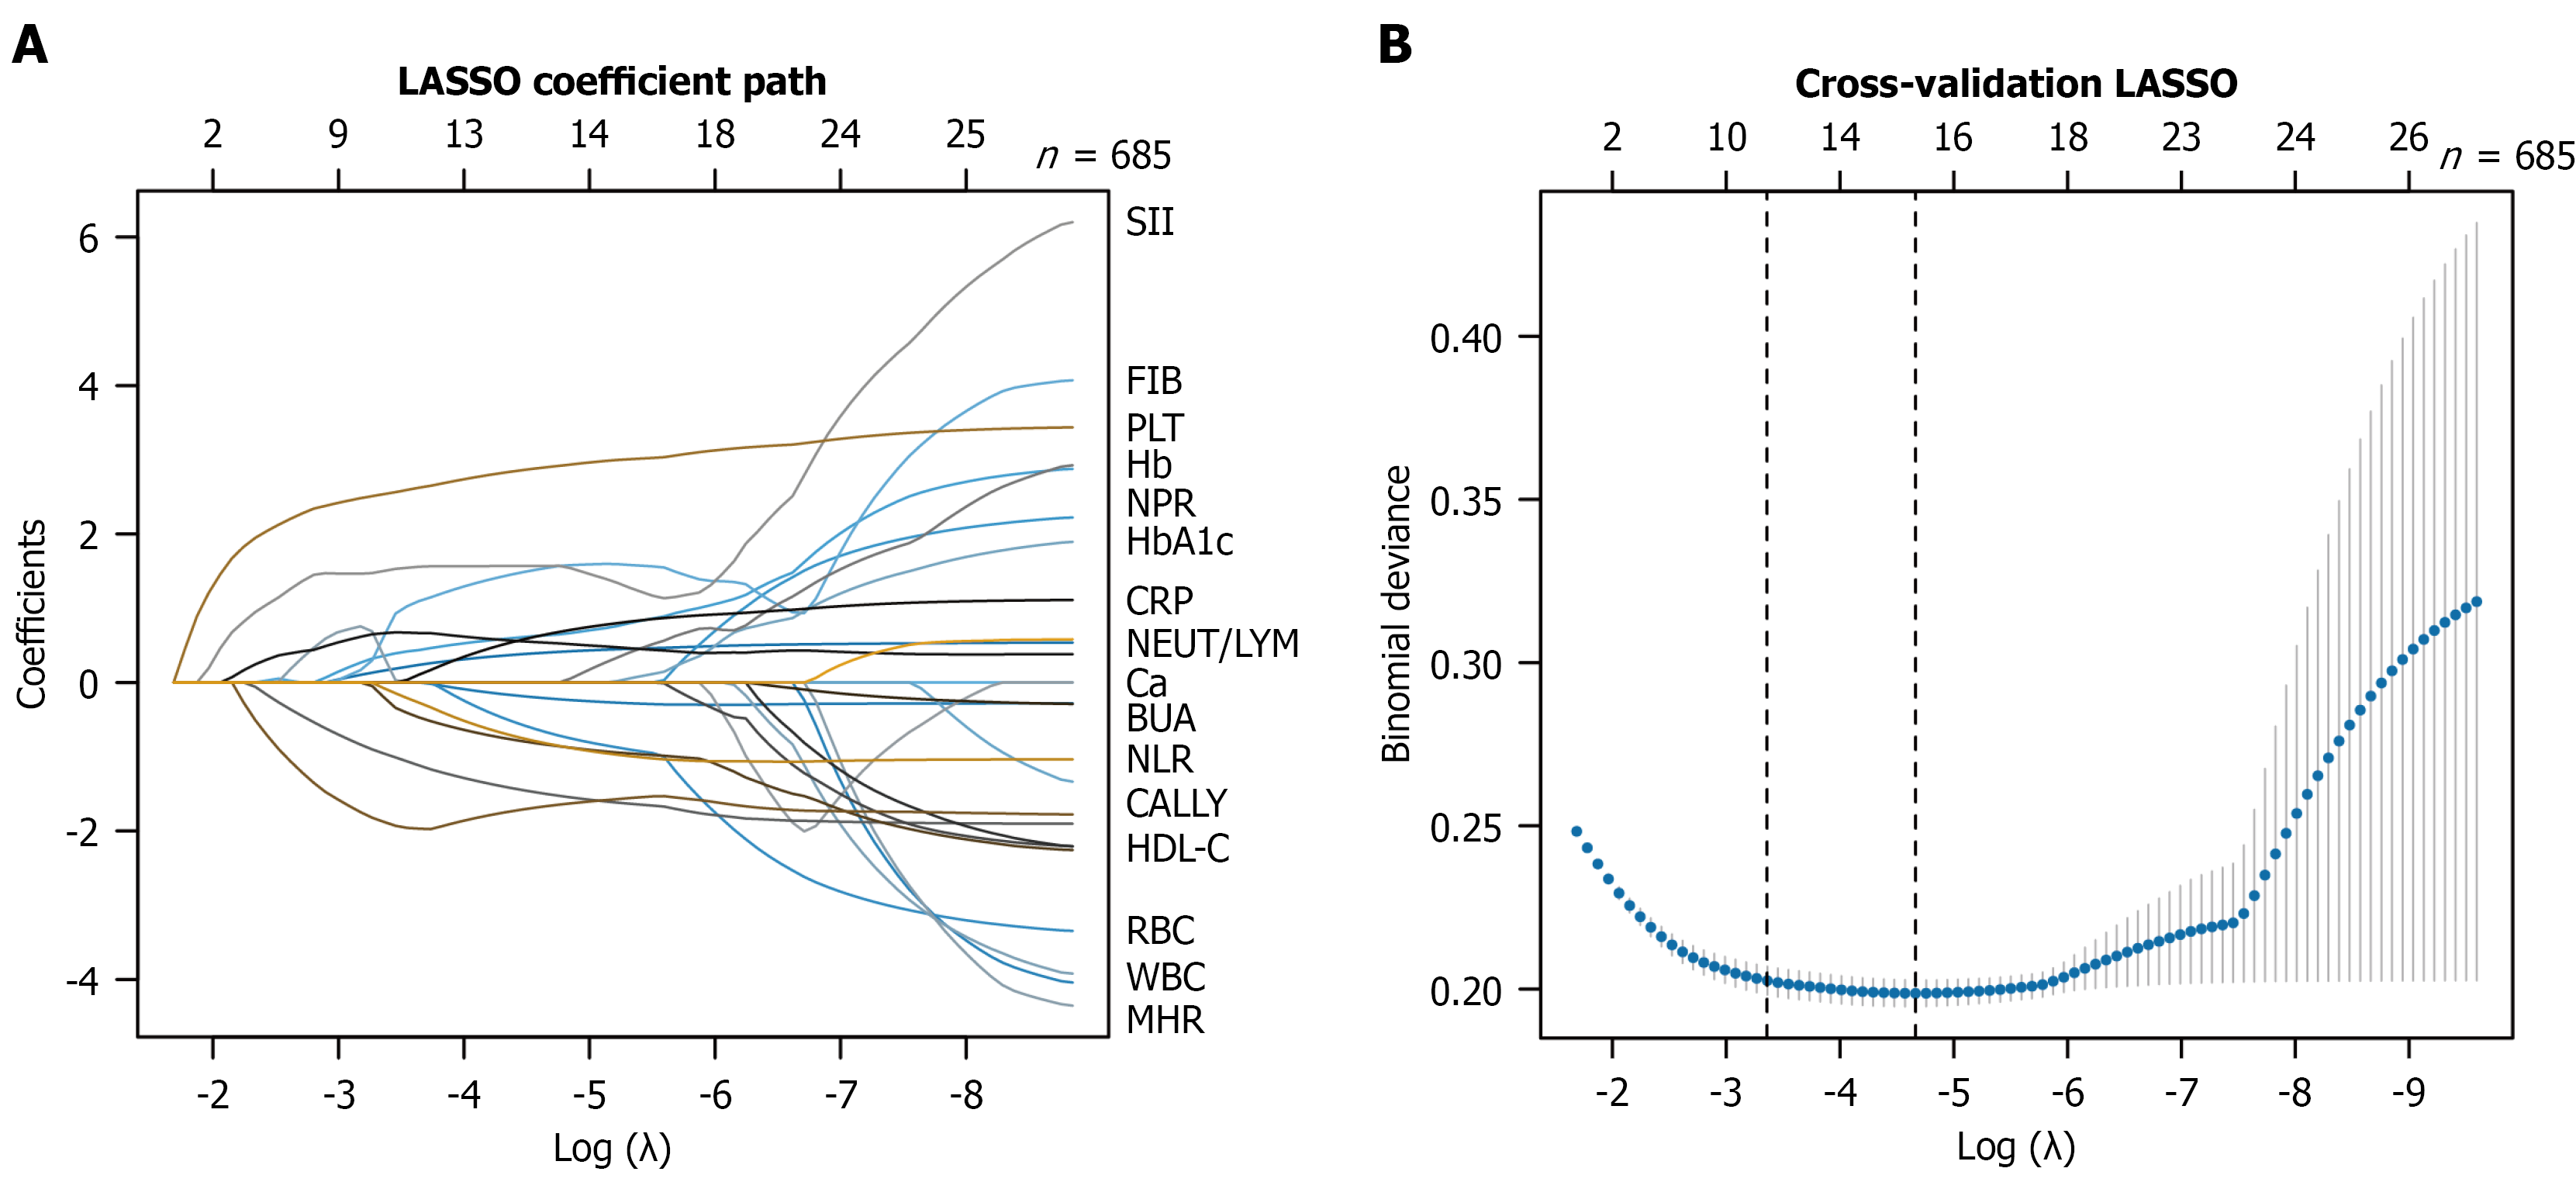
Figure 2 Least absolute shrinkage and selection operator coefficient path plot and cross-validation curve for feature selection.
A: Coefficient path plot showing variable trajectories against the log(λ) sequence; each colored line represents one variable, with variable names labeled at the right margin; B: Cross-validation curve showing binomial deviance vs log(λ); the left vertical dashed line indicates the minimum deviance (λmin), and the right dashed line indicates the 1-standard-error criterion (λ1se). LASSO: Least absolute shrinkage and selection operator; SII: Systemic immune-inflammation index; FIB: Fibrinogen; PLT: Platelet count; Hb: Hemoglobin; NPR: Neutrophil-platelet ratio; HbA1c: Hemoglobin A1c; CRP: C-reactive protein; NEUT: Neutrophil count; LYM: Lymphocyte count; Ca: Serum calcium; BUA: Blood uric acid; NLR: Neutrophil-lymphocyte ratio; CALLY: C-reactive protein-albumin-lymphocyte; HDL-C: High-density lipoprotein cholesterol; RBC: Red blood cell count; WBC: White blood cell count; MHR: Monocyte-high-density lipoprotein cholesterol ratio.
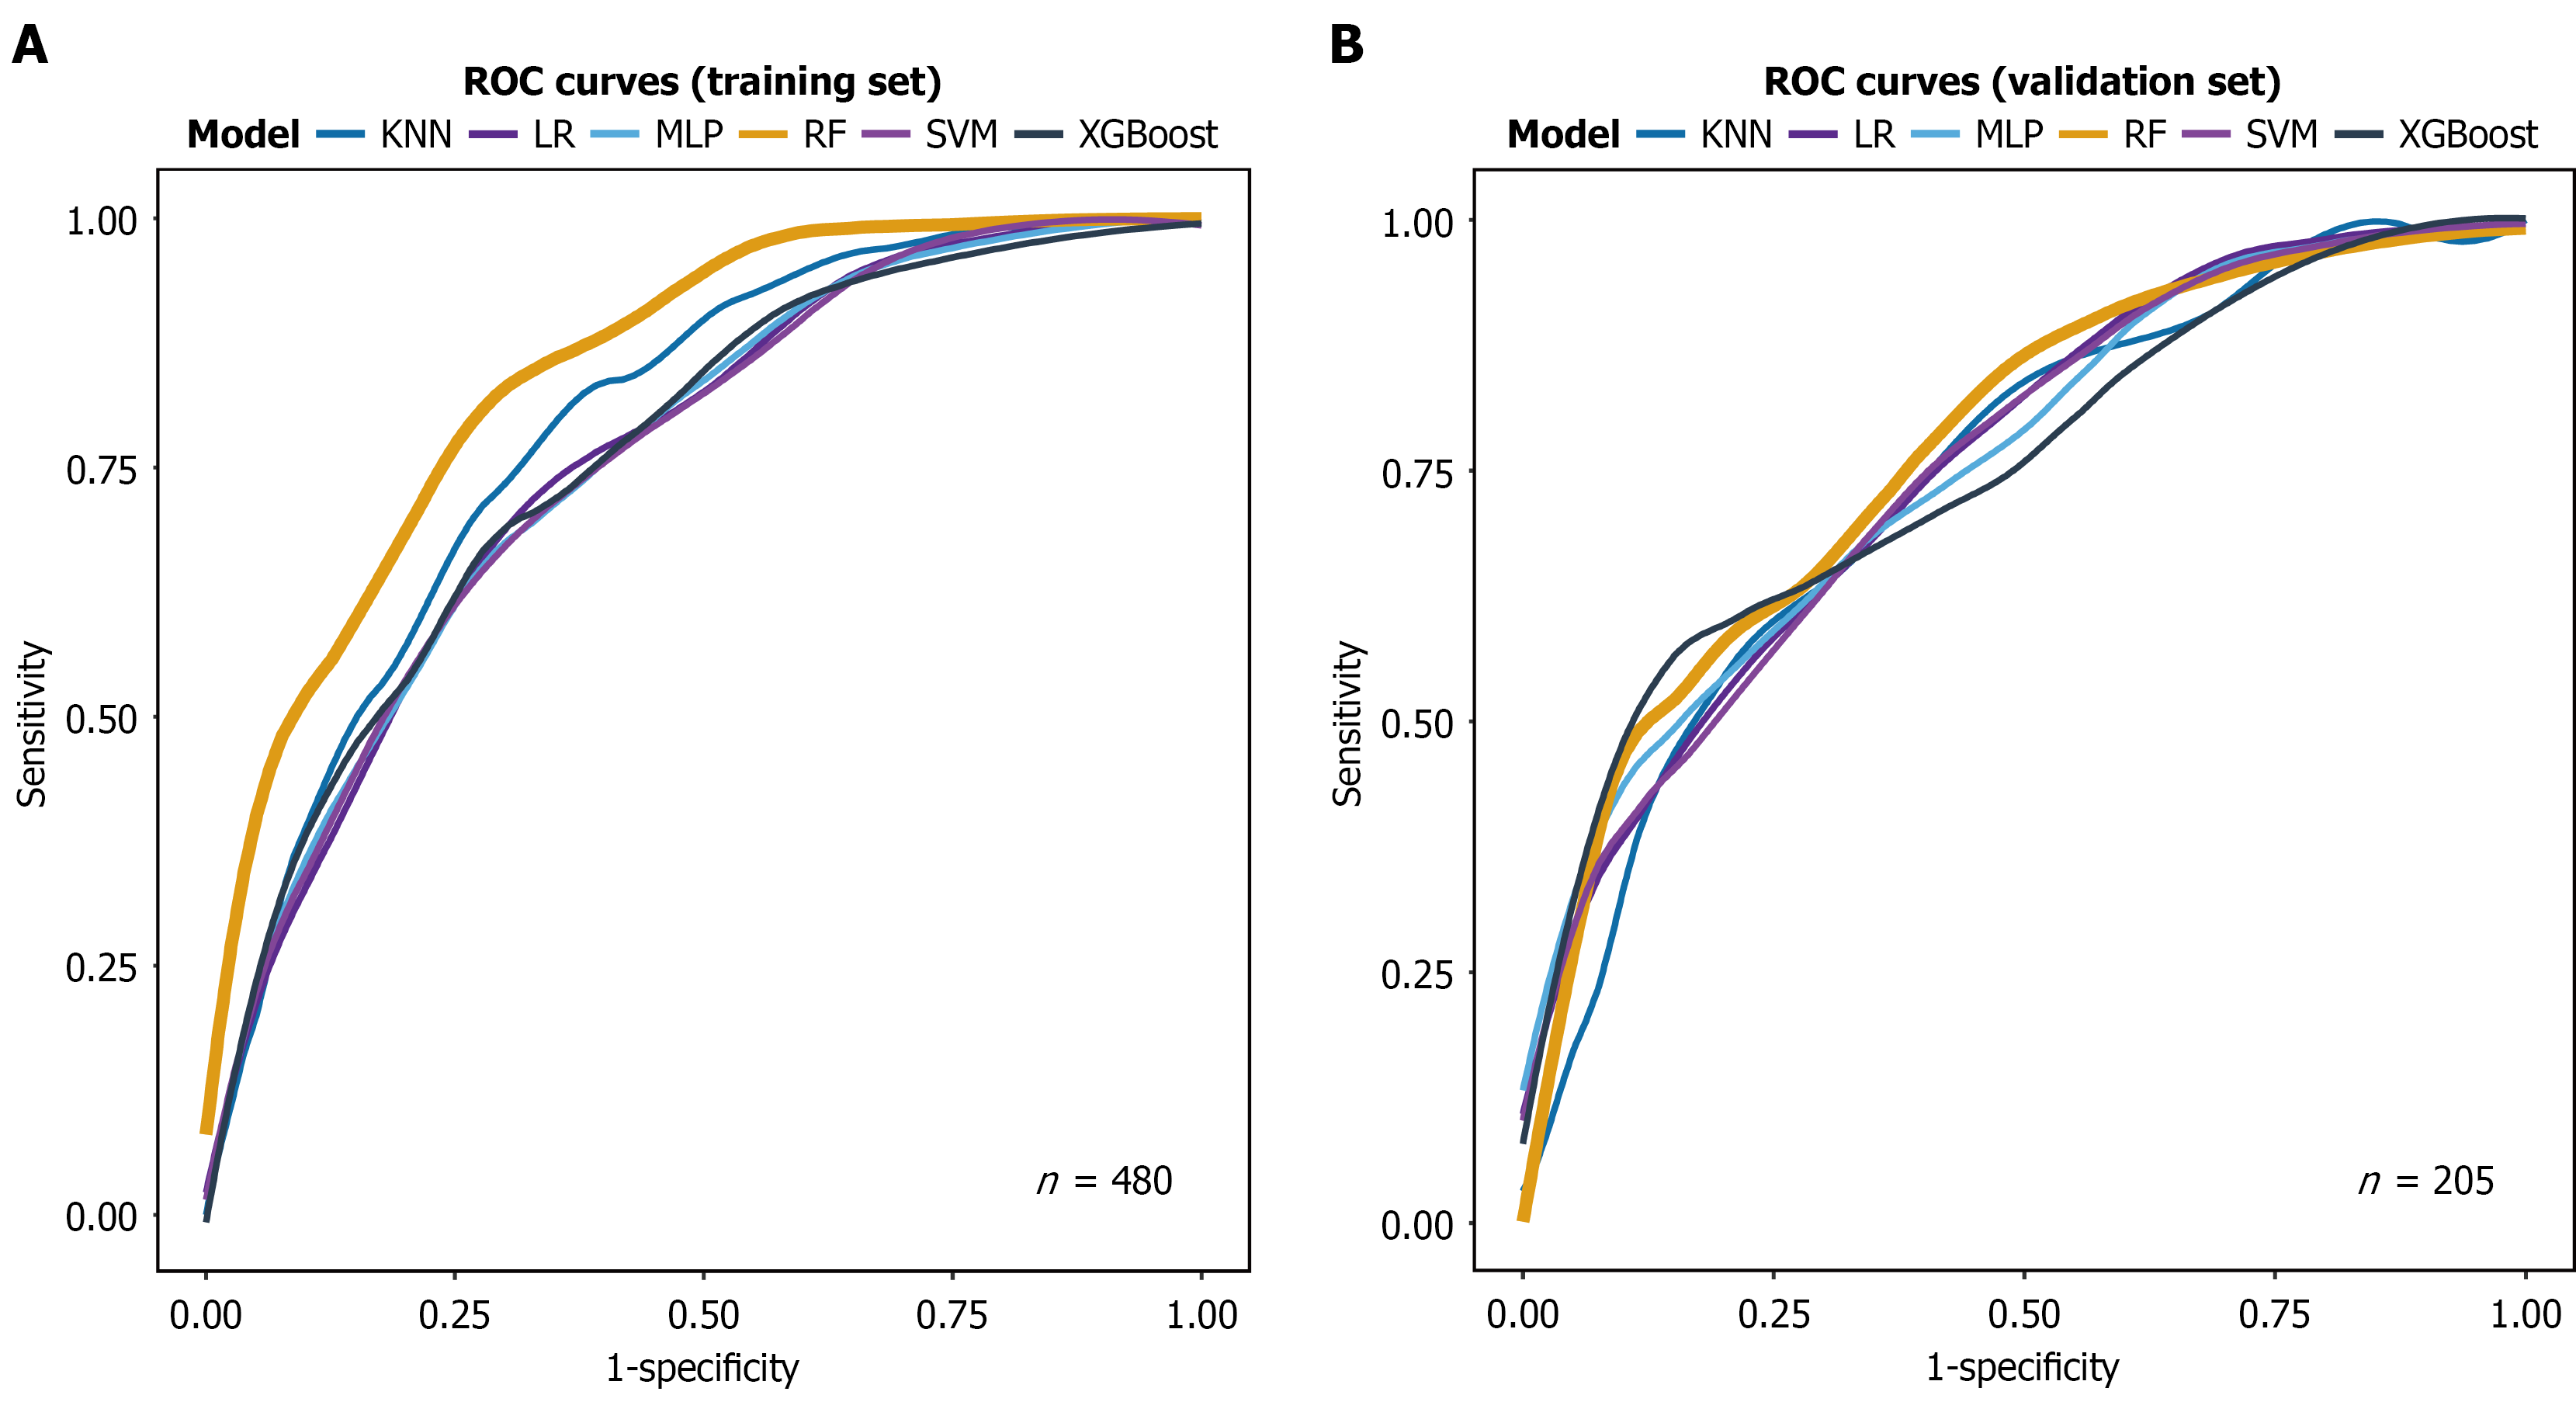
Figure 3 Receiver operating characteristic analysis of six machine learning models in training and validation sets.
A: Training set (n = 480); B: Validation set (n = 205). The X-axis represents 1-specificity, and the Y-axis represents sensitivity. ROC: Receiver operating characteristic; KNN: K-nearest neighbors; LR: Logistic regression; MLP: Multilayer perceptron; RF: Random forest; SVM: Support vector machine; XGBoost: Extreme gradient boosting.
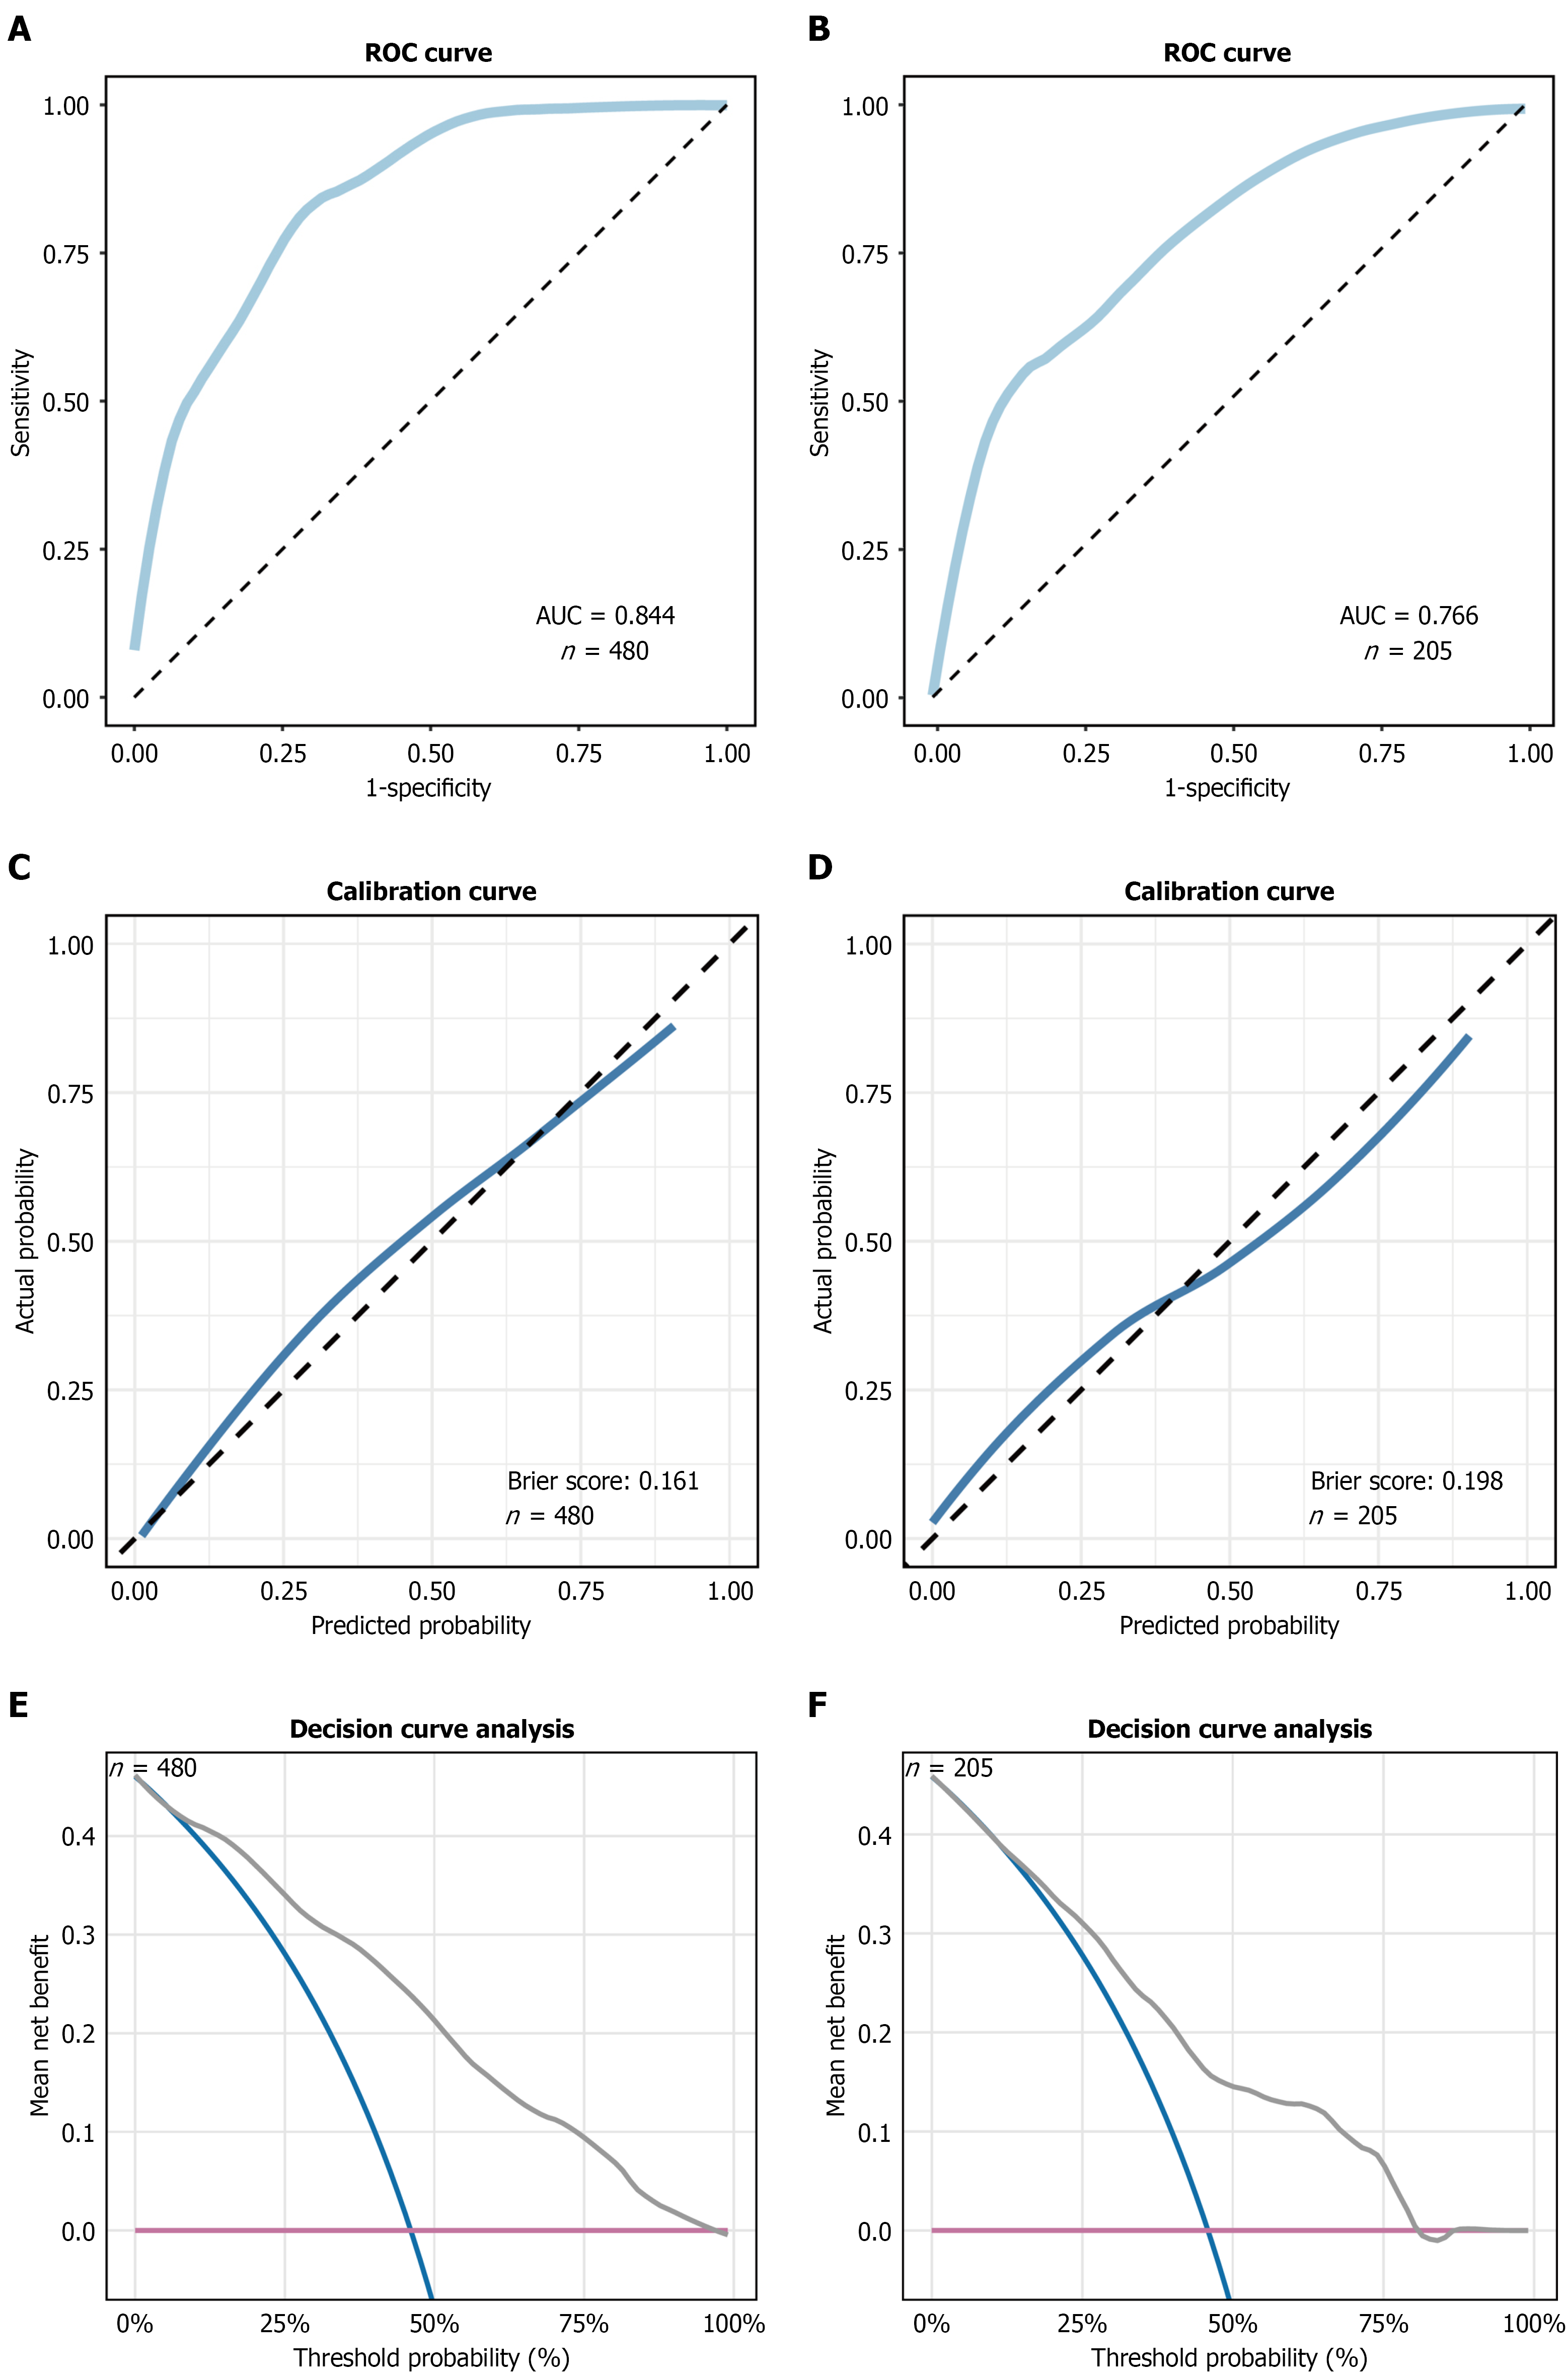
Figure 4 Validation and evaluation of the random forest model.
A and B: Receiver operating characteristic curves for the training set (n = 480; area under the receiver operating characteristic curve =0.844) and validation set (n = 205; area under the receiver operating characteristic curve = 0.766), respectively; C and D: Calibration curves for the training set (Brier score = 0.161) and validation set (Brier score = 0.198), respectively; the dashed diagonal line represents ideal calibration; E and F: Decision curve analysis for the training set and validation set, respectively. The Y-axis denotes mean net benefit, and the X-axis denotes threshold probability (%). AUC: Area under the receiver operating characteristic curve; ROC: Receiver operating characteristic.
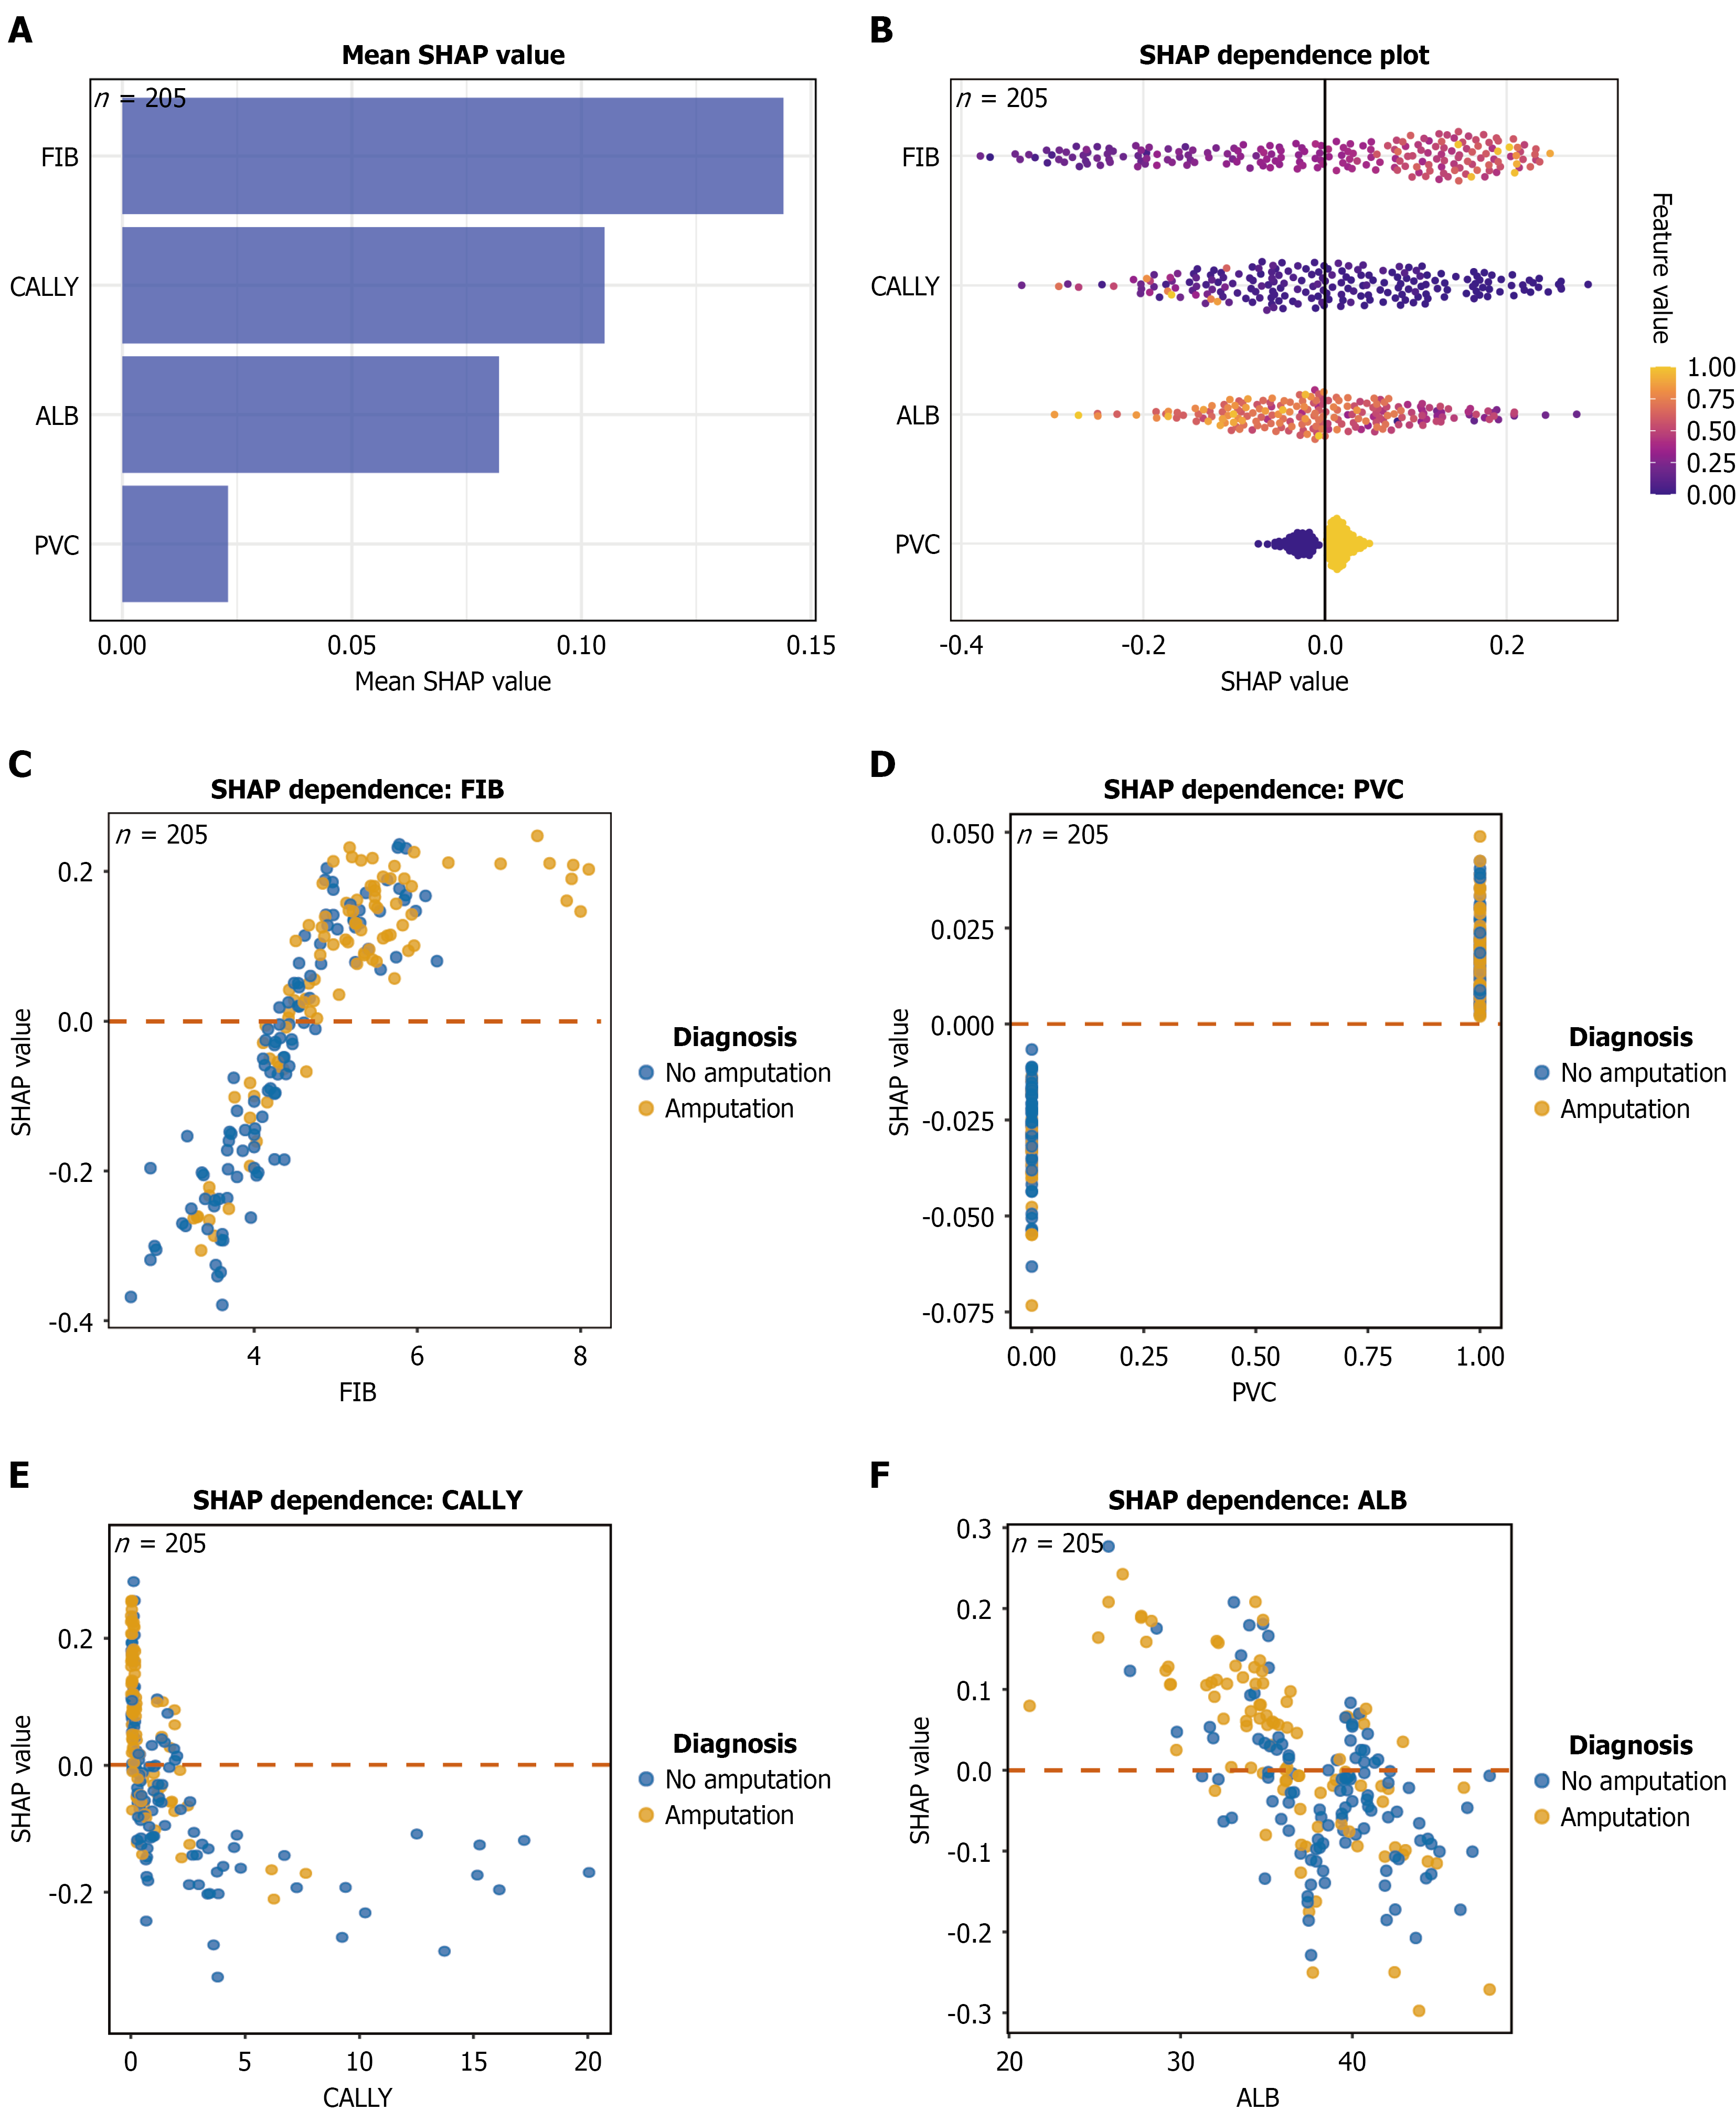
Figure 5 SHapley Additive exPlanations-based interpretation of the random forest model.
A: Mean SHapley Additive exPlanations (SHAP) value bar plot ranking the four key features by importance (fibrinogen > C-reactive protein-albumin-lymphocyte > albumin > pedal vessel calcification); B: SHAP summary (beeswarm) plot, where each dot represents one patient, color indicates feature value (yellow = high, blue = low), and the X-axis shows SHAP value; C-F: SHAP dependence plots for fibrinogen, pedal vessel calcification, C-reactive protein-albumin-lymphocyte, and albumin; blue dots indicate non-amputation and orange dots indicate amputation, and the horizontal dashed line marks SHAP value = 0. ALB: Albumin; CALLY: C-reactive protein-albumin-lymphocyte; FIB: Fibrinogen; PVC: Pedal vessel calcification; SHAP: SHapley Additive exPlanations.
- Citation: Yang ZJ, Zhao JY, Hu SC, Chen Y, Kang YF, Li J, Wang LC, Chen HM, Zhang ZY, Yang CZ, Zhu D. Explainable machine learning model for predicting minor amputation in diabetic foot ulcers. World J Diabetes 2026; 17(11): 124921
- URL: https://www.wjgnet.com/1948-9358/full/v17/i11/124921.htm
- DOI: https://dx.doi.org/10.4239/wjd.124921