
















Copyright: ©Author(s) 2026.
World J Diabetes. Nov 15, 2026; 17(11): 124921
Published online Nov 15, 2026. doi: 10.4239/wjd.124921
Published online Nov 15, 2026. doi: 10.4239/wjd.124921
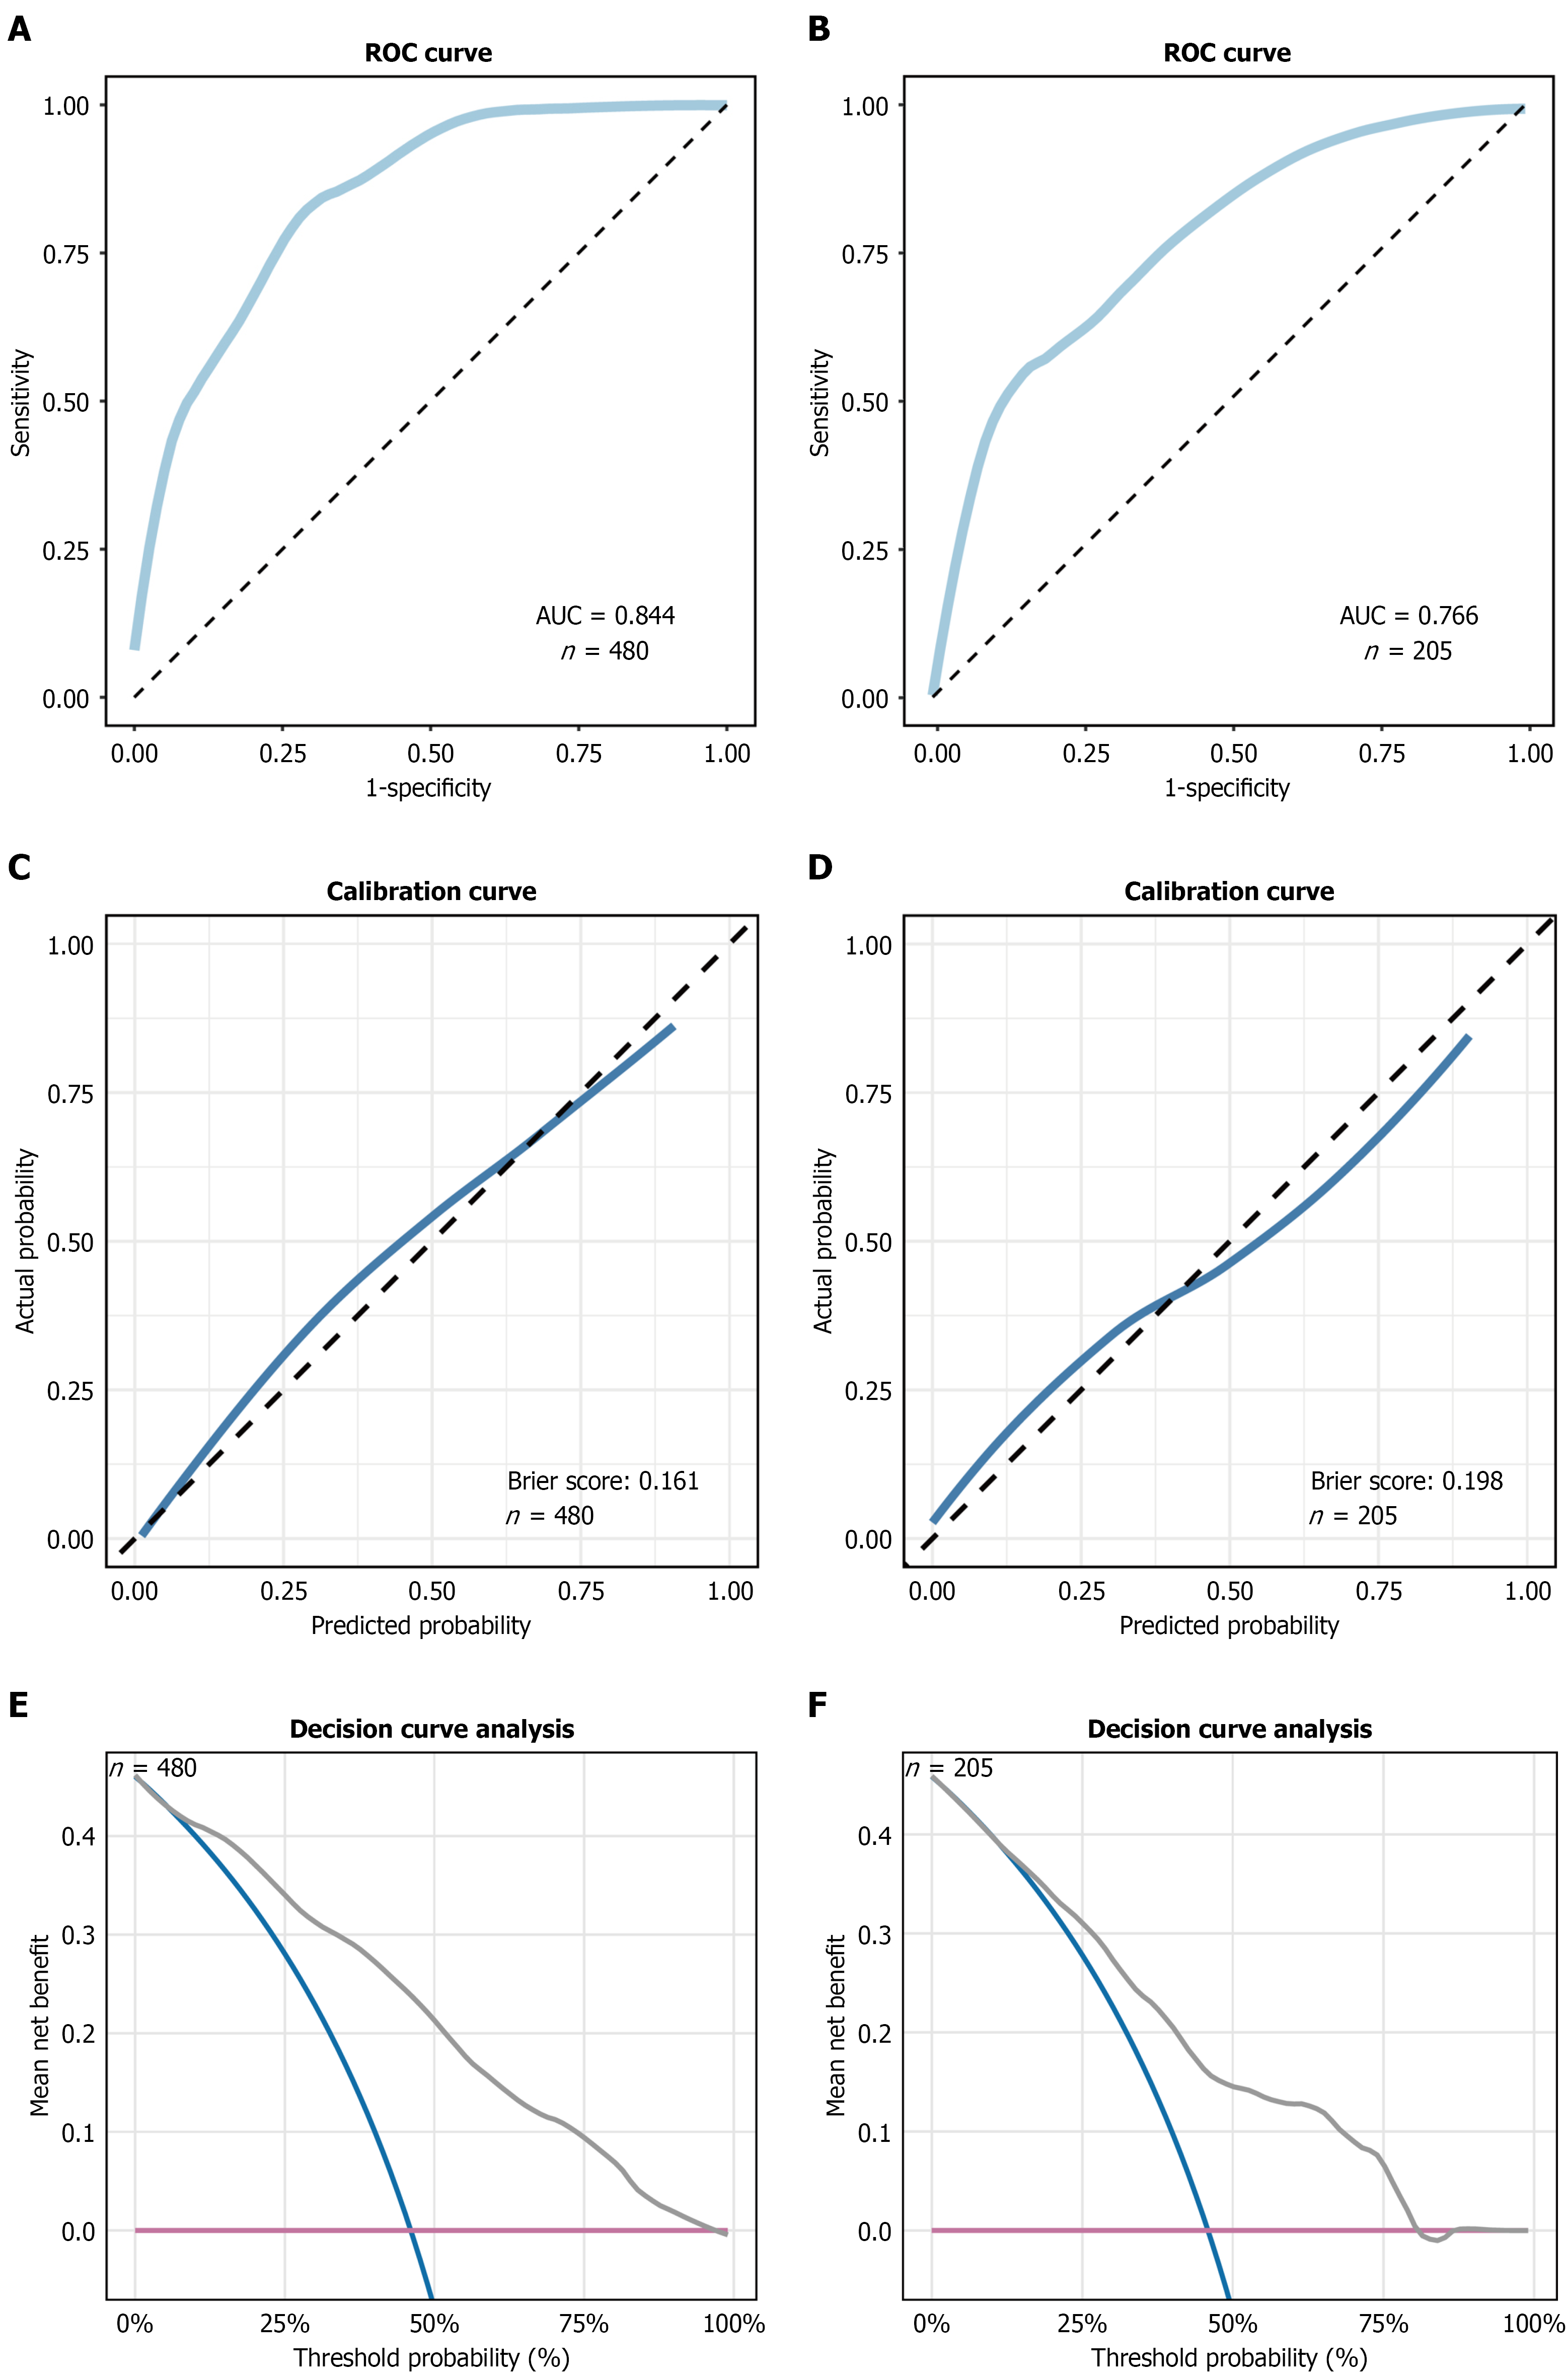
Figure 4 Validation and evaluation of the random forest model.
A and B: Receiver operating characteristic curves for the training set (n = 480; area under the receiver operating characteristic curve =0.844) and validation set (n = 205; area under the receiver operating characteristic curve = 0.766), respectively; C and D: Calibration curves for the training set (Brier score = 0.161) and validation set (Brier score = 0.198), respectively; the dashed diagonal line represents ideal calibration; E and F: Decision curve analysis for the training set and validation set, respectively. The Y-axis denotes mean net benefit, and the X-axis denotes threshold probability (%). AUC: Area under the receiver operating characteristic curve; ROC: Receiver operating characteristic.
- Citation: Yang ZJ, Zhao JY, Hu SC, Chen Y, Kang YF, Li J, Wang LC, Chen HM, Zhang ZY, Yang CZ, Zhu D. Explainable machine learning model for predicting minor amputation in diabetic foot ulcers. World J Diabetes 2026; 17(11): 124921
- URL: https://www.wjgnet.com/1948-9358/full/v17/i11/124921.htm
- DOI: https://dx.doi.org/10.4239/wjd.124921