
















Copyright: ©Author(s) 2026.
World J Diabetes. Nov 15, 2026; 17(11): 124921
Published online Nov 15, 2026. doi: 10.4239/wjd.124921
Published online Nov 15, 2026. doi: 10.4239/wjd.124921
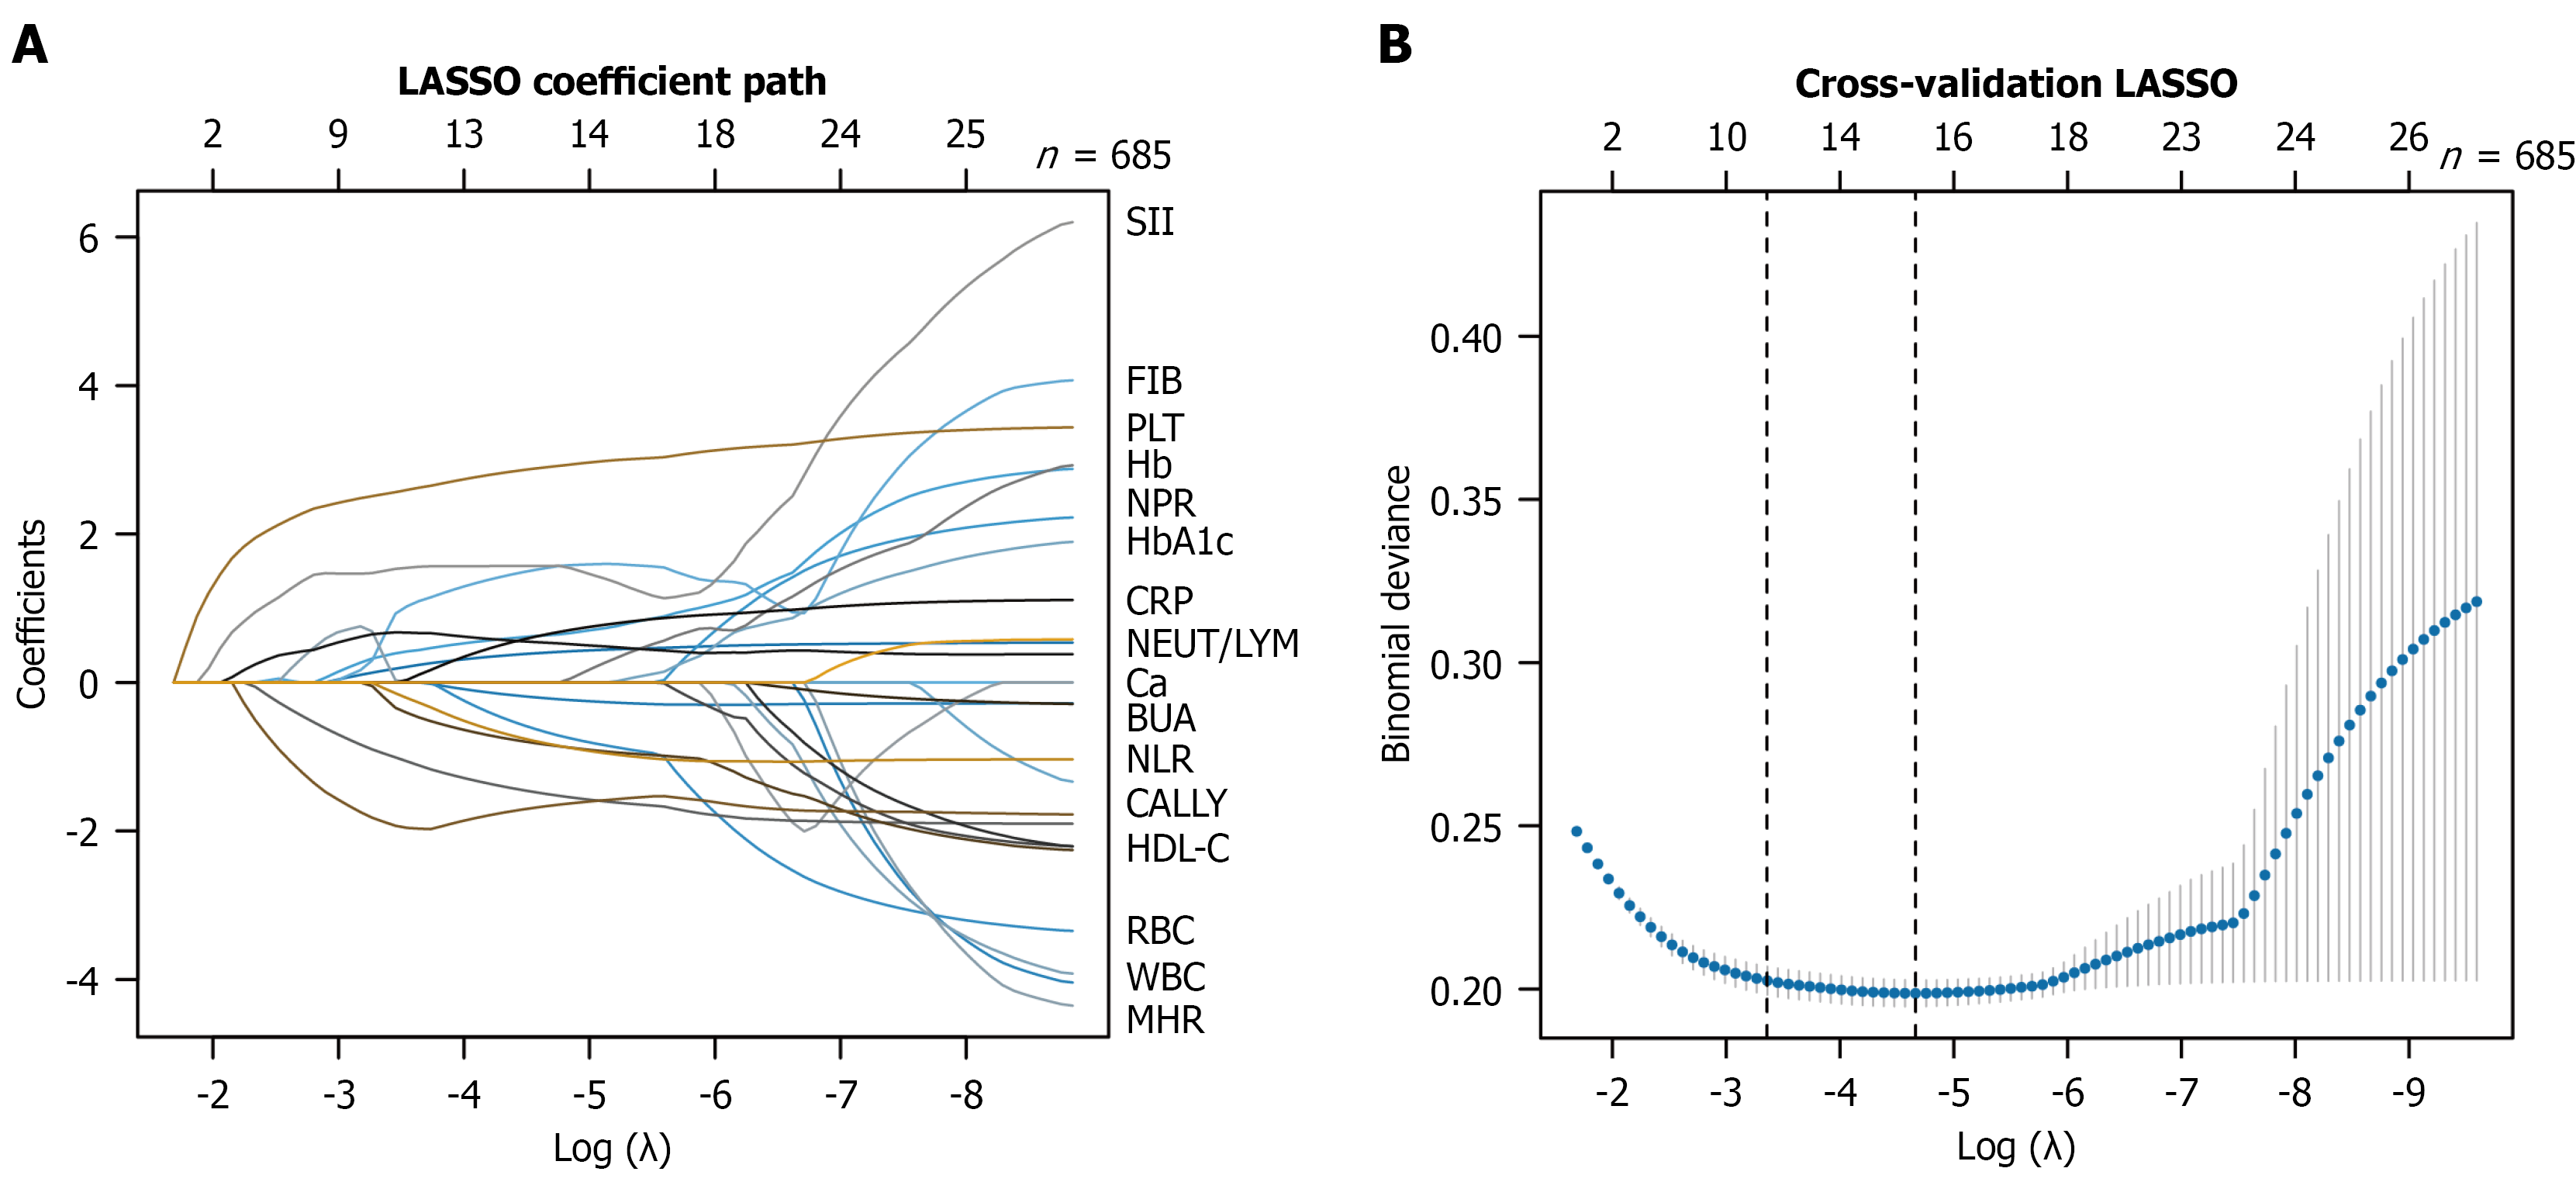
Figure 2 Least absolute shrinkage and selection operator coefficient path plot and cross-validation curve for feature selection.
A: Coefficient path plot showing variable trajectories against the log(λ) sequence; each colored line represents one variable, with variable names labeled at the right margin; B: Cross-validation curve showing binomial deviance vs log(λ); the left vertical dashed line indicates the minimum deviance (λmin), and the right dashed line indicates the 1-standard-error criterion (λ1se). LASSO: Least absolute shrinkage and selection operator; SII: Systemic immune-inflammation index; FIB: Fibrinogen; PLT: Platelet count; Hb: Hemoglobin; NPR: Neutrophil-platelet ratio; HbA1c: Hemoglobin A1c; CRP: C-reactive protein; NEUT: Neutrophil count; LYM: Lymphocyte count; Ca: Serum calcium; BUA: Blood uric acid; NLR: Neutrophil-lymphocyte ratio; CALLY: C-reactive protein-albumin-lymphocyte; HDL-C: High-density lipoprotein cholesterol; RBC: Red blood cell count; WBC: White blood cell count; MHR: Monocyte-high-density lipoprotein cholesterol ratio.
- Citation: Yang ZJ, Zhao JY, Hu SC, Chen Y, Kang YF, Li J, Wang LC, Chen HM, Zhang ZY, Yang CZ, Zhu D. Explainable machine learning model for predicting minor amputation in diabetic foot ulcers. World J Diabetes 2026; 17(11): 124921
- URL: https://www.wjgnet.com/1948-9358/full/v17/i11/124921.htm
- DOI: https://dx.doi.org/10.4239/wjd.124921