
















Copyright: ©Author(s) 2026.
World J Diabetes. Nov 15, 2026; 17(11): 124921
Published online Nov 15, 2026. doi: 10.4239/wjd.124921
Published online Nov 15, 2026. doi: 10.4239/wjd.124921
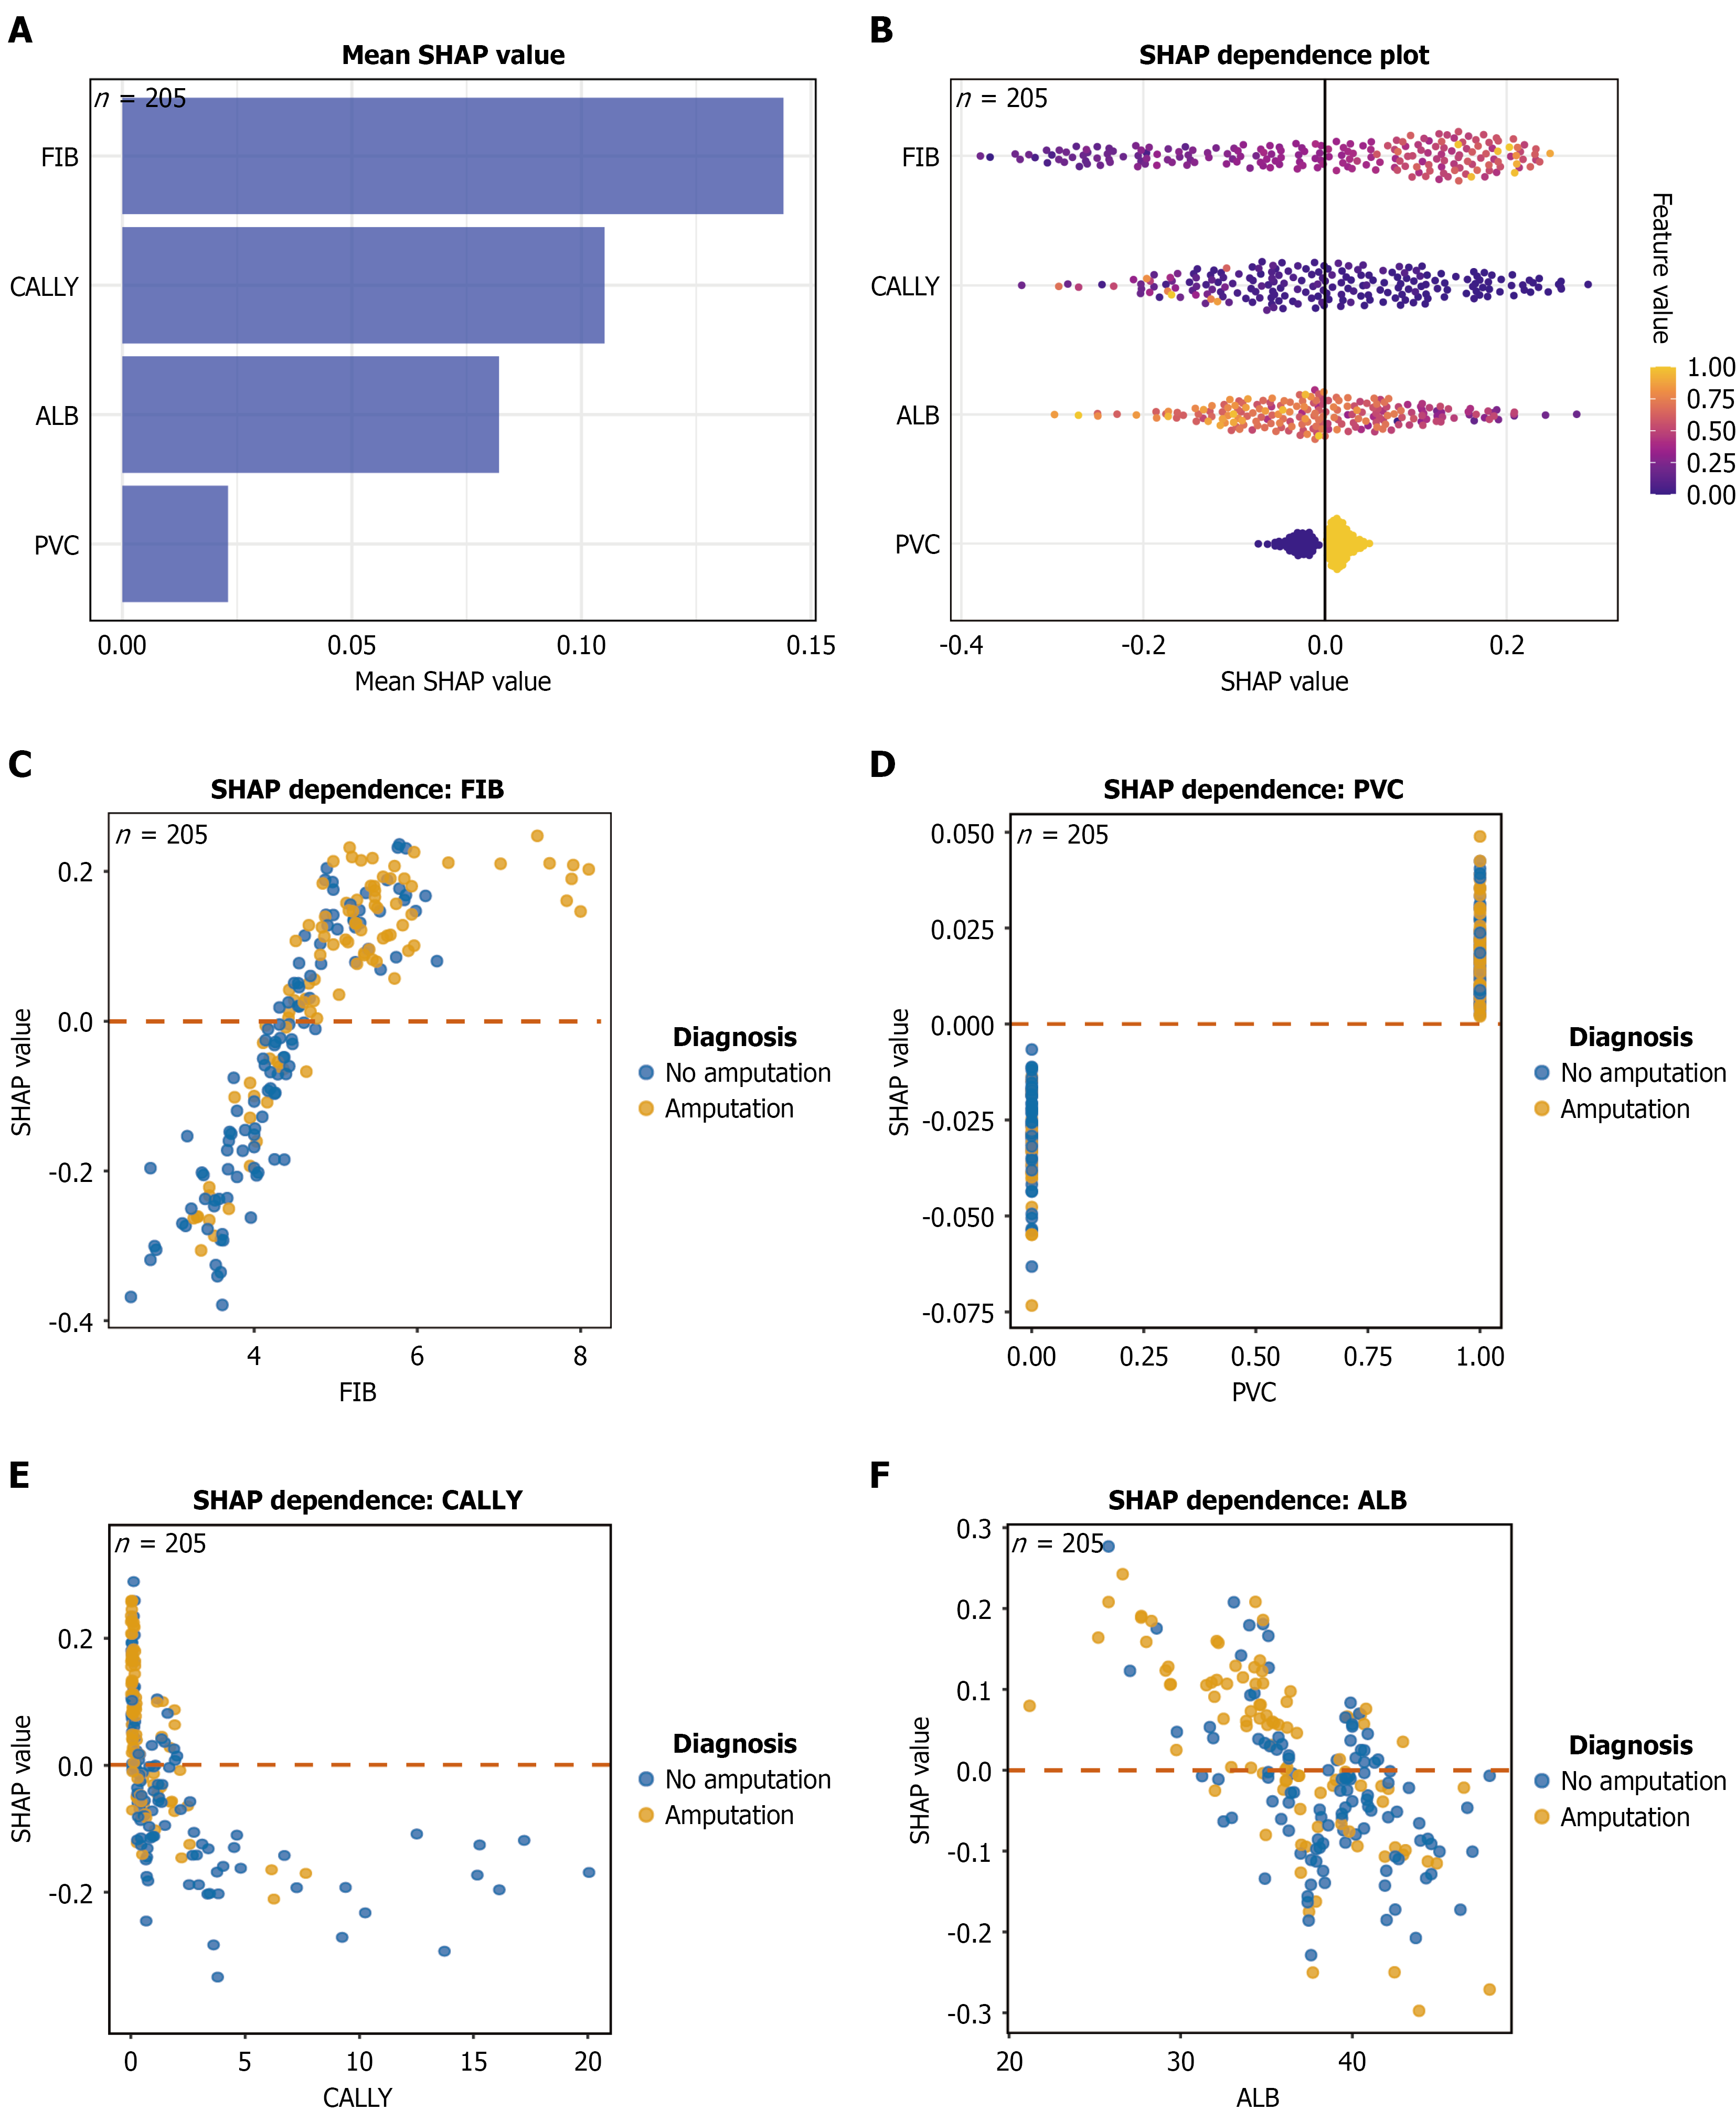
Figure 5 SHapley Additive exPlanations-based interpretation of the random forest model.
A: Mean SHapley Additive exPlanations (SHAP) value bar plot ranking the four key features by importance (fibrinogen > C-reactive protein-albumin-lymphocyte > albumin > pedal vessel calcification); B: SHAP summary (beeswarm) plot, where each dot represents one patient, color indicates feature value (yellow = high, blue = low), and the X-axis shows SHAP value; C-F: SHAP dependence plots for fibrinogen, pedal vessel calcification, C-reactive protein-albumin-lymphocyte, and albumin; blue dots indicate non-amputation and orange dots indicate amputation, and the horizontal dashed line marks SHAP value = 0. ALB: Albumin; CALLY: C-reactive protein-albumin-lymphocyte; FIB: Fibrinogen; PVC: Pedal vessel calcification; SHAP: SHapley Additive exPlanations.
- Citation: Yang ZJ, Zhao JY, Hu SC, Chen Y, Kang YF, Li J, Wang LC, Chen HM, Zhang ZY, Yang CZ, Zhu D. Explainable machine learning model for predicting minor amputation in diabetic foot ulcers. World J Diabetes 2026; 17(11): 124921
- URL: https://www.wjgnet.com/1948-9358/full/v17/i11/124921.htm
- DOI: https://dx.doi.org/10.4239/wjd.124921