Copyright
©The Author(s) 2025.
World J Gastrointest Oncol. Aug 15, 2025; 17(8): 108887
Published online Aug 15, 2025. doi: 10.4251/wjgo.v17.i8.108887
Published online Aug 15, 2025. doi: 10.4251/wjgo.v17.i8.108887
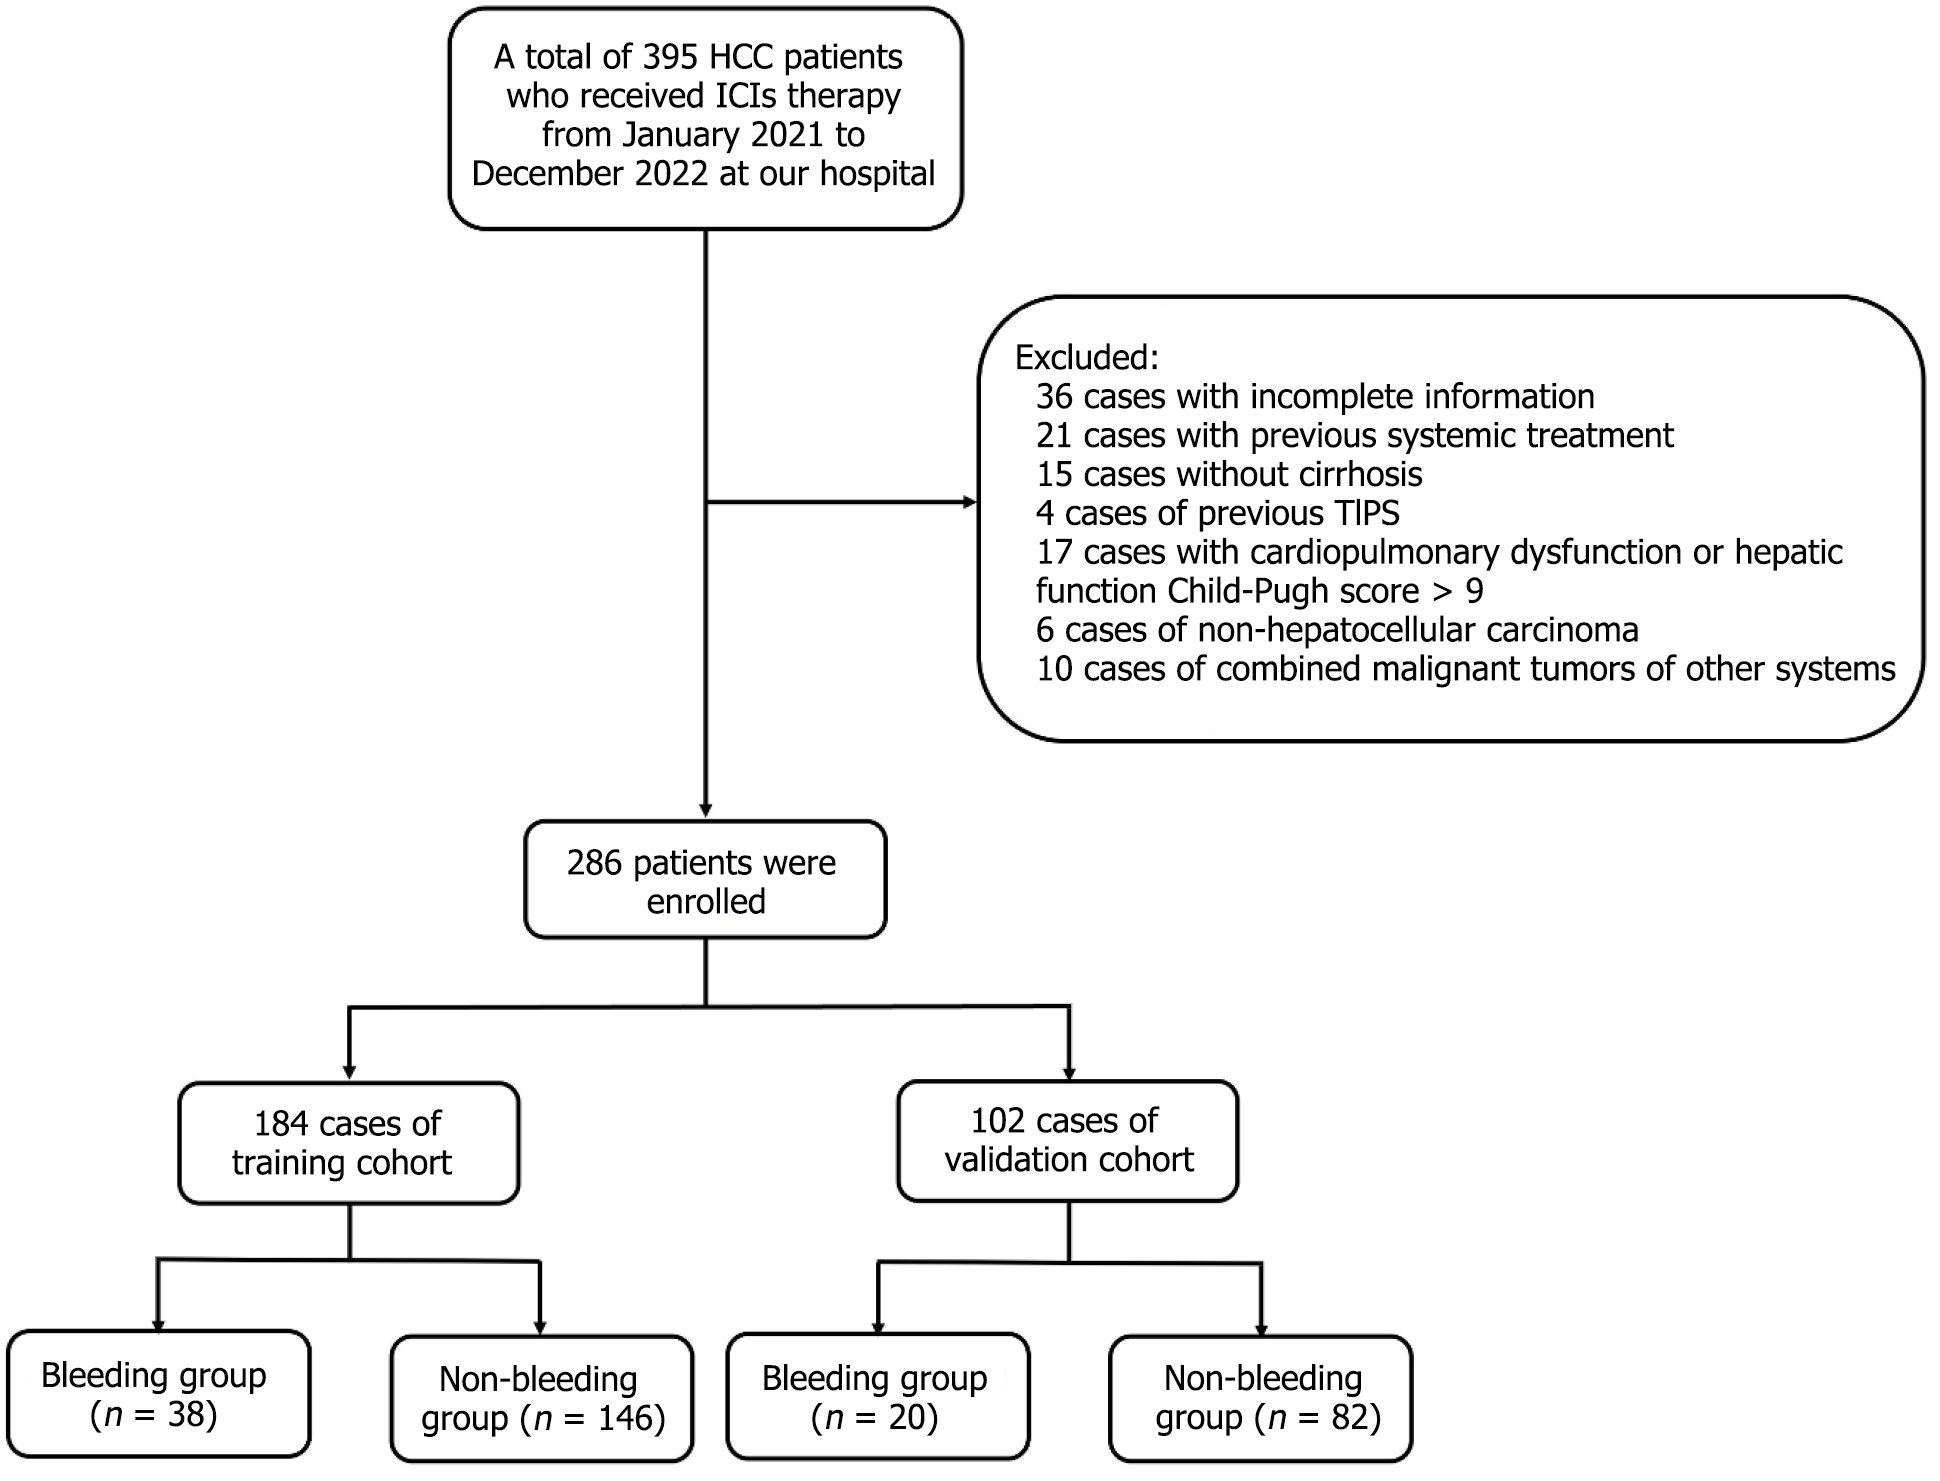
Figure 1 Retrospective selection process of patients.
A total of 395 patients with hepatocellular carcinoma (HCC) who received systemic therapy between January 2021 and December 2022 were initially screened. Patients were excluded due to non–HCC (n = 6), concurrent malignant tumors of other systems (n = 10), severe heart, lung, or liver disease (Child-Pugh C > 9) or kidney dysfunction (n = 17), absence of cirrhosis (n = 15), history of transjugular intrahepatic portosystemic shunt (n = 4), history of previous systemic therapy (n = 21), incomplete data (n = 36). The final cohort included 286 patients for analysis. ICIs: Immune checkpoint inhibitors; TIPS: Transjugular intrahepatic portosystemic shunt.
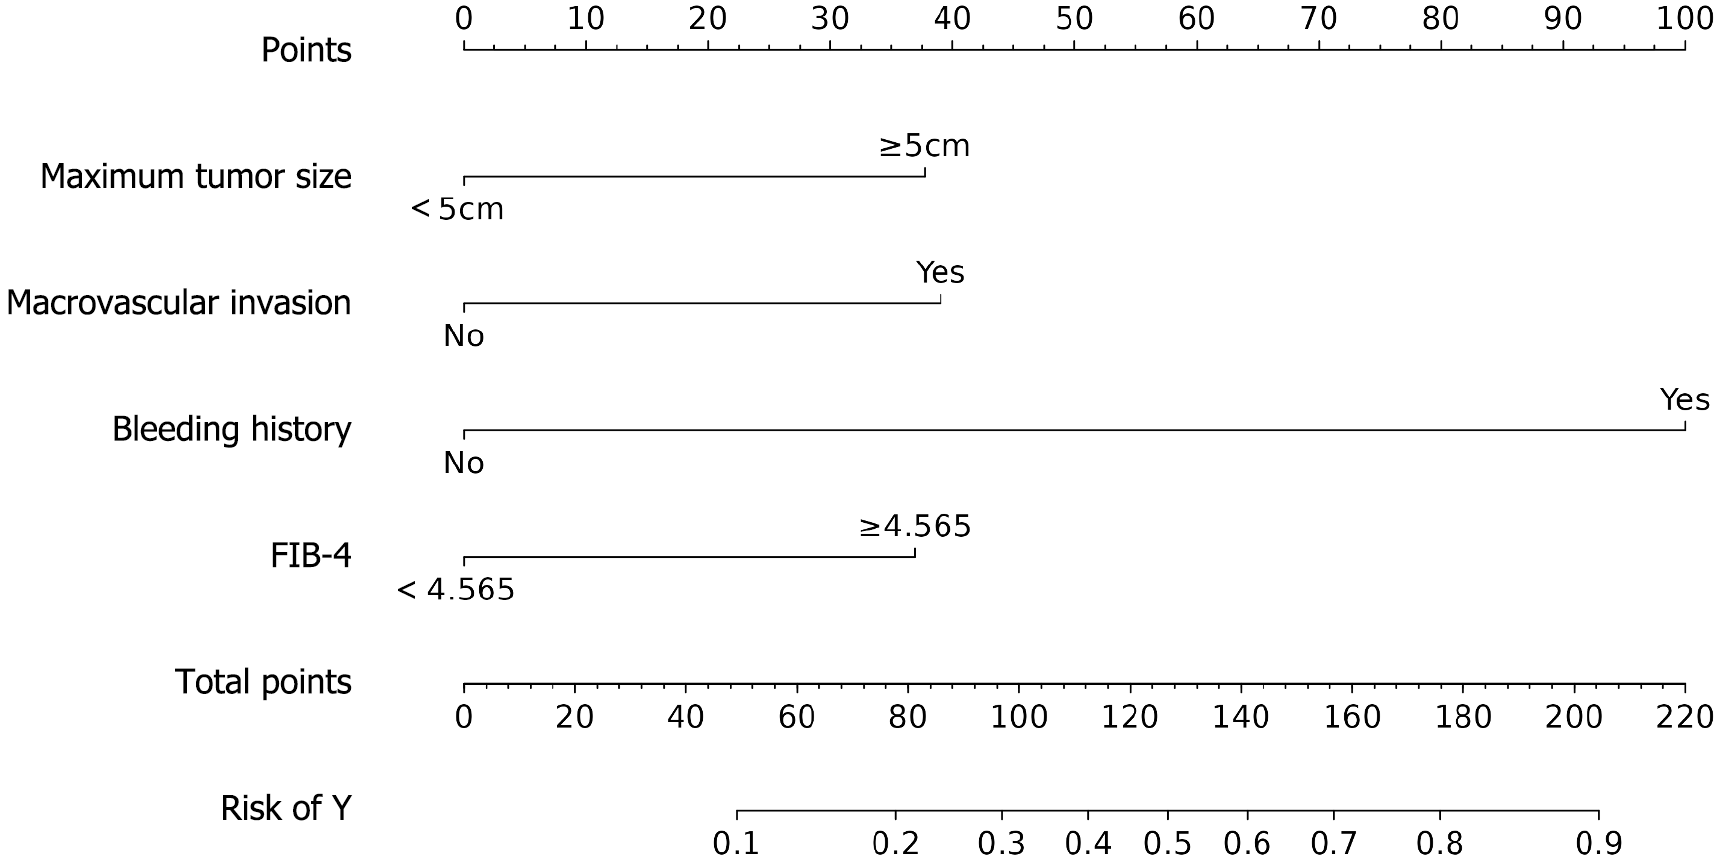
Figure 2 Nomogram of logistic regression affecting acute variceal bleeding.
A binary logistic regression model was constructed, which revealed that a maximum tumor diameter ≥ 5 cm, portal vein tumor thrombus, pretreatment bleeding history, and high FIB-4 grade were independent risk factors for bleeding (all P < 0.05). FIB-4: Fibrosis-4 index.
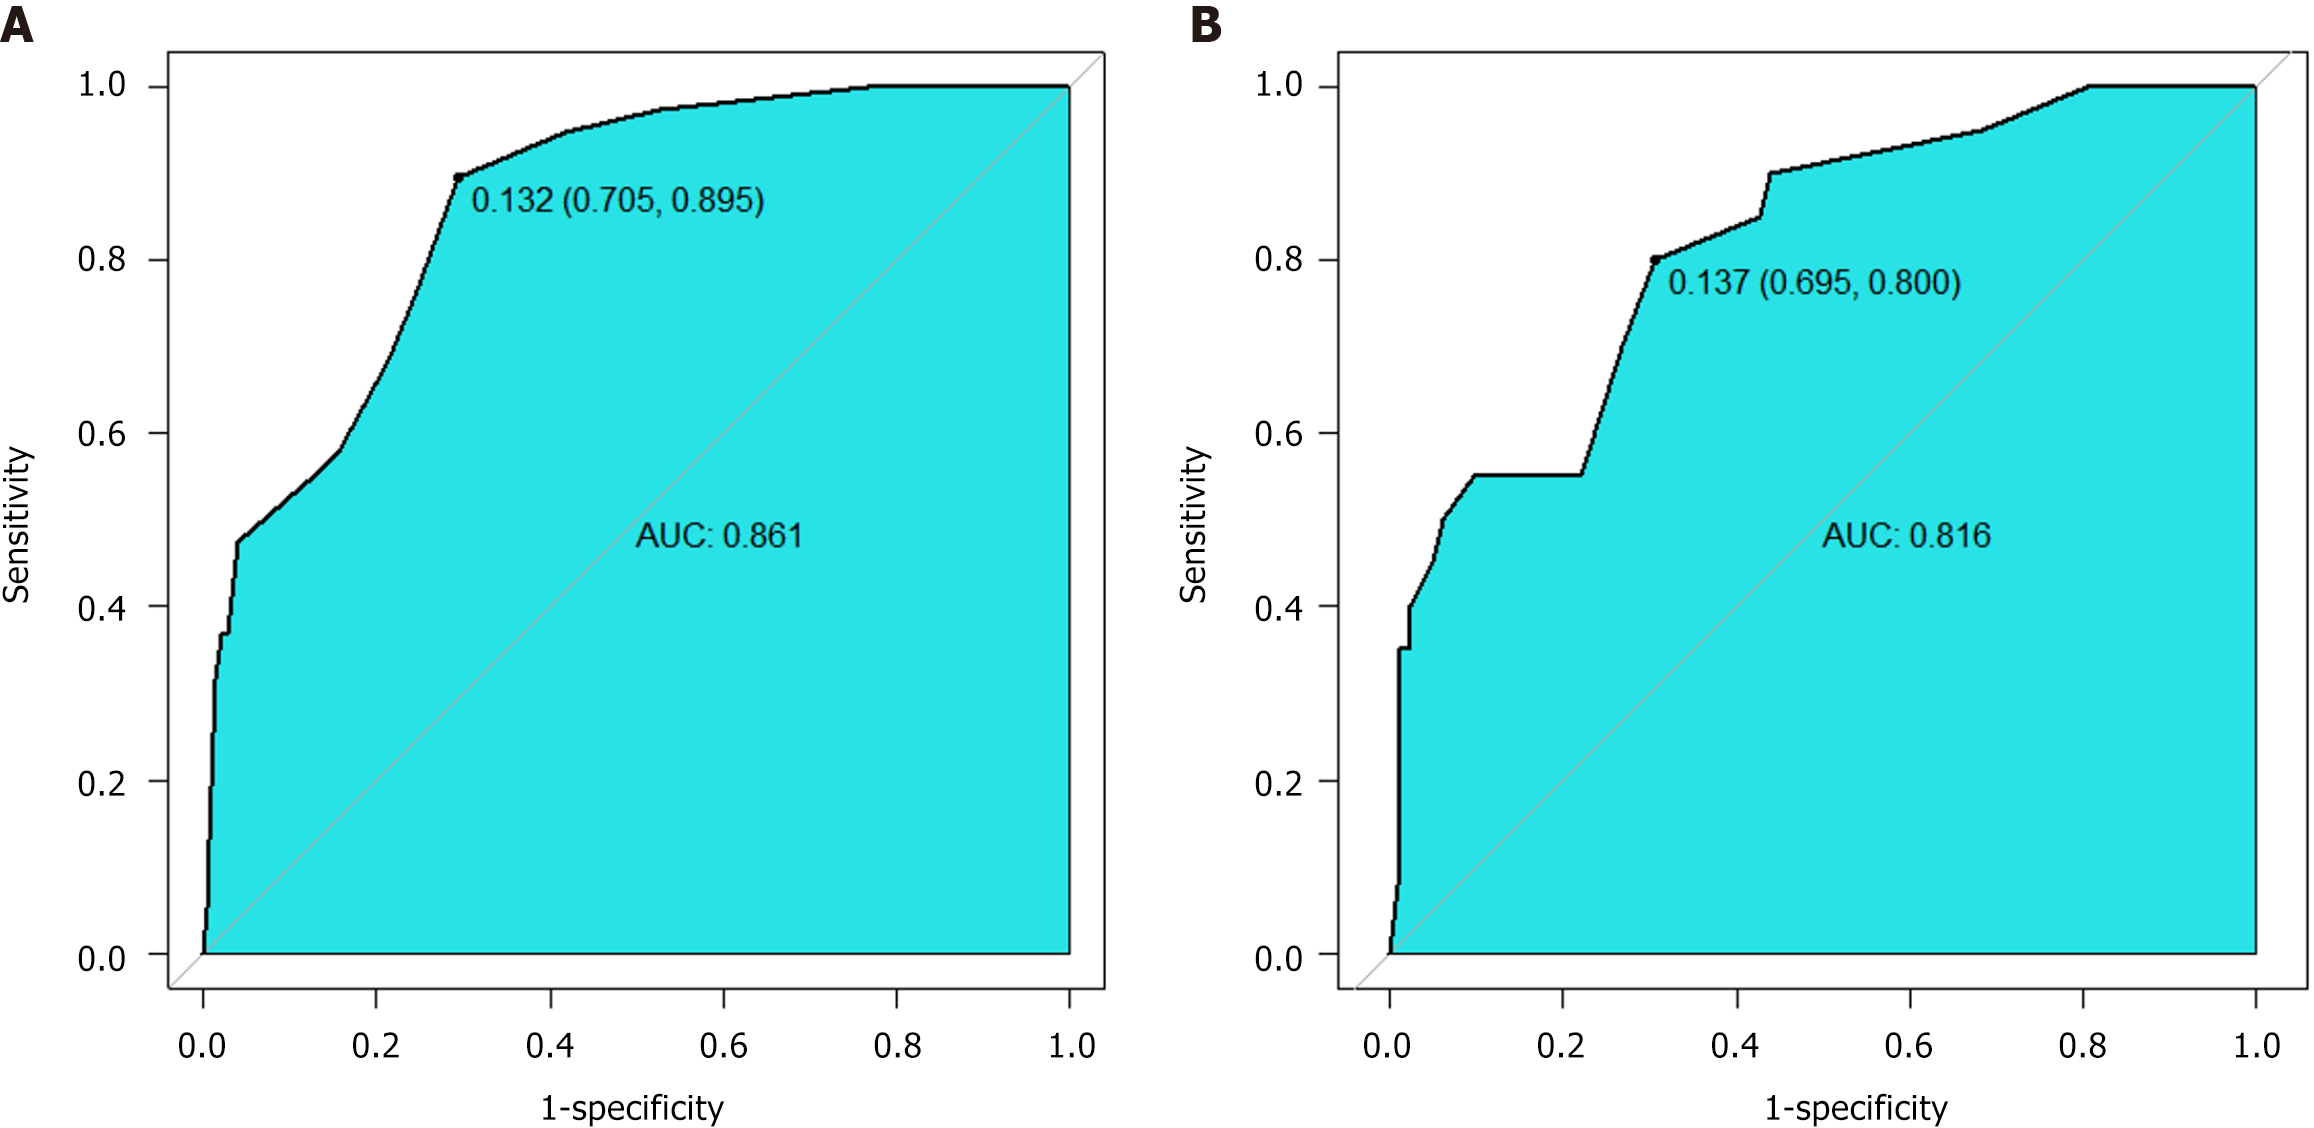
Figure 3 Receiver operating characteristic analysis of the model prediction for acute variceal bleeding.
A: Training cohort; B: Validation cohort. The area under the curve in training cohort and validation cohort were 0861 (95%CI: 0.802-0.920) and 0.816 (95%CI: 0.714-0.919) respectively. Optimal cutoff: 0.132 (sensitivity 70.5%, specificity 89.5%). AUC: Area under the curve.
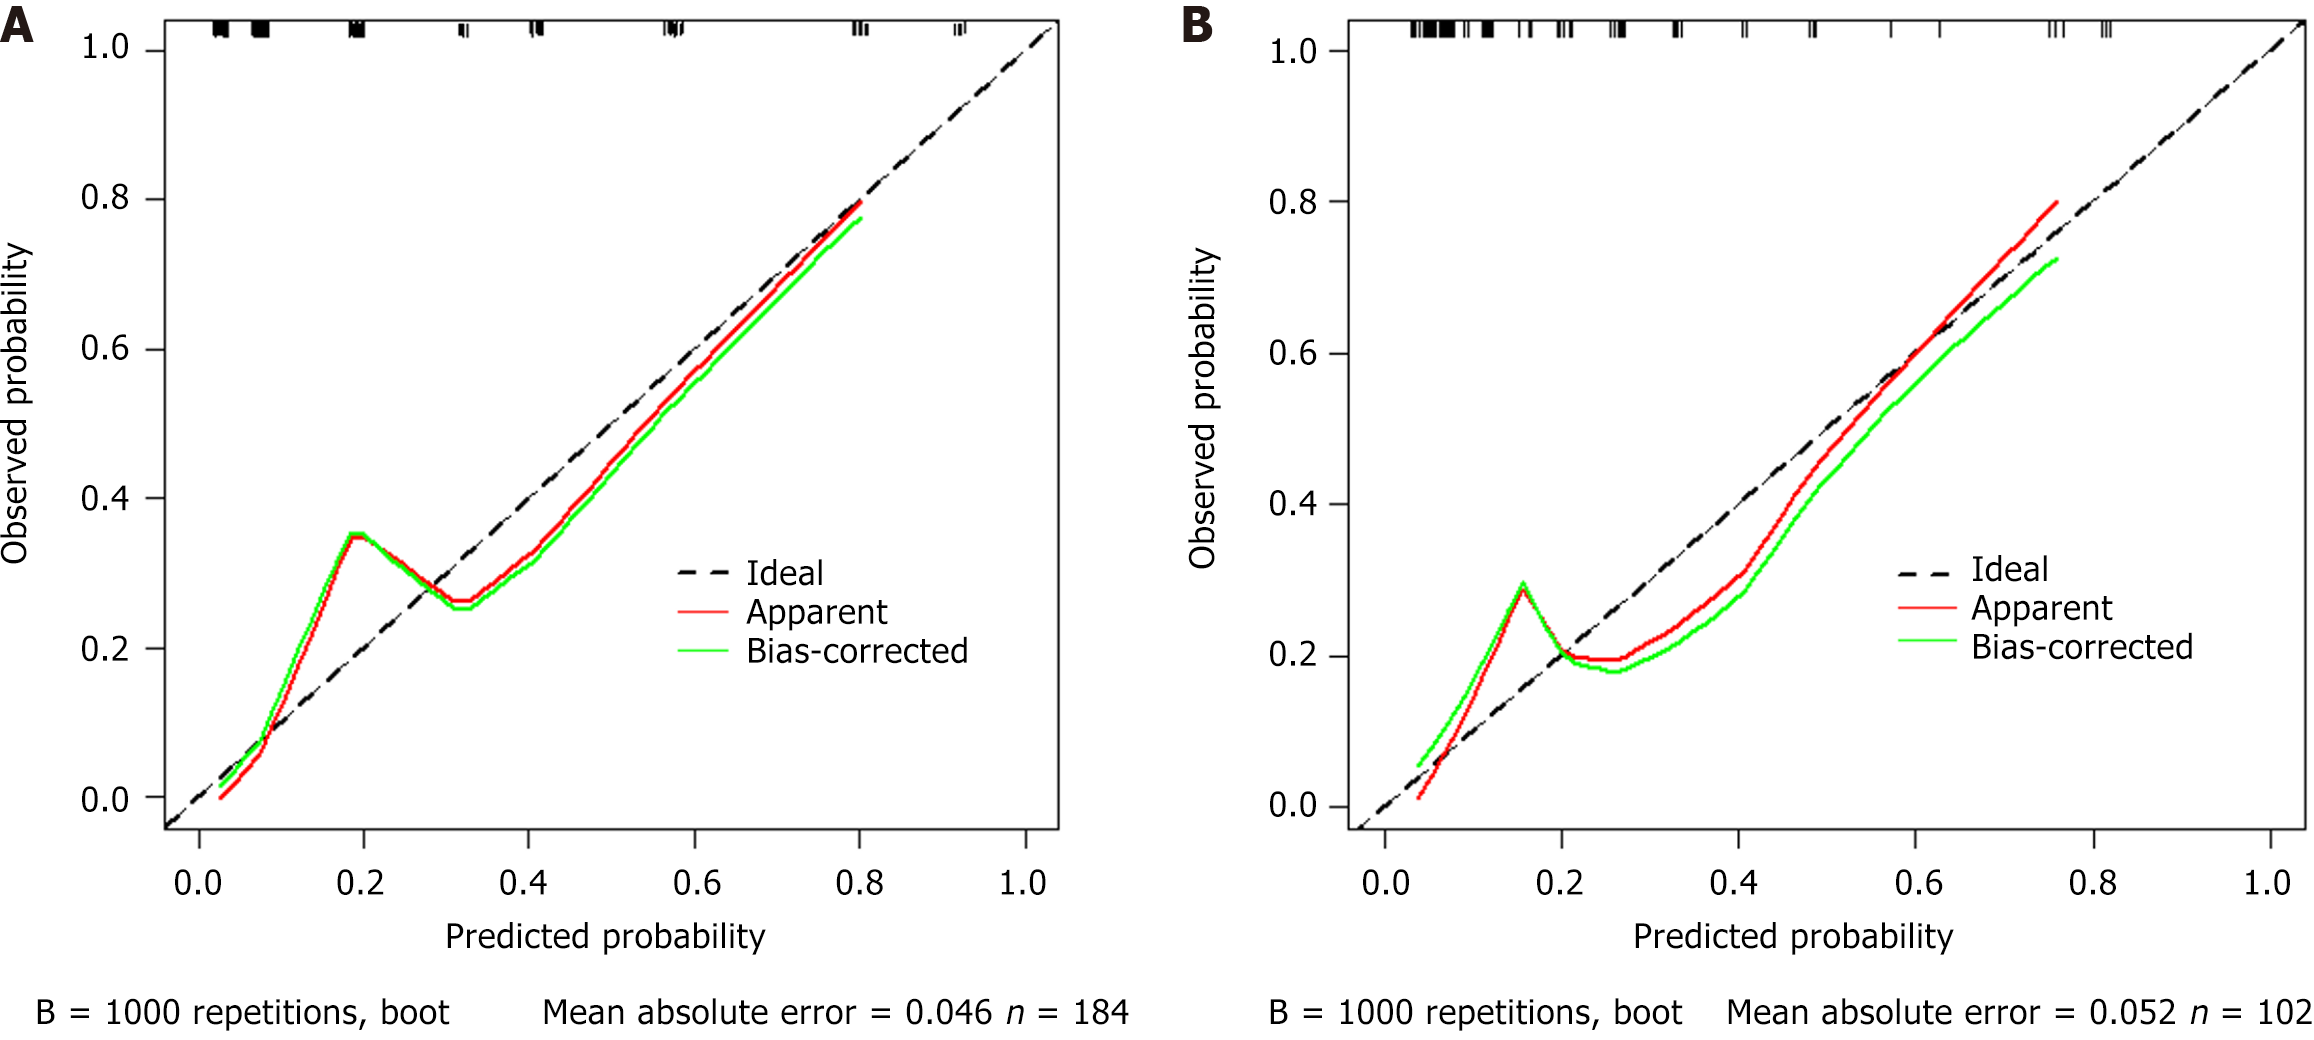
Figure 4 Calibration curve analysis of the model prediction for acute variceal bleeding.
A: Training cohort; B: Validation cohort. Internal validation with 1000 bootstrap replicates showed good model fit (Hosmer-Lemeshow P = 0.067) and discrimination (C-statistic 0.861). External validation maintained calibration stability (P = 0.161), indicating excellent calibration performance and readiness for clinical implementation.
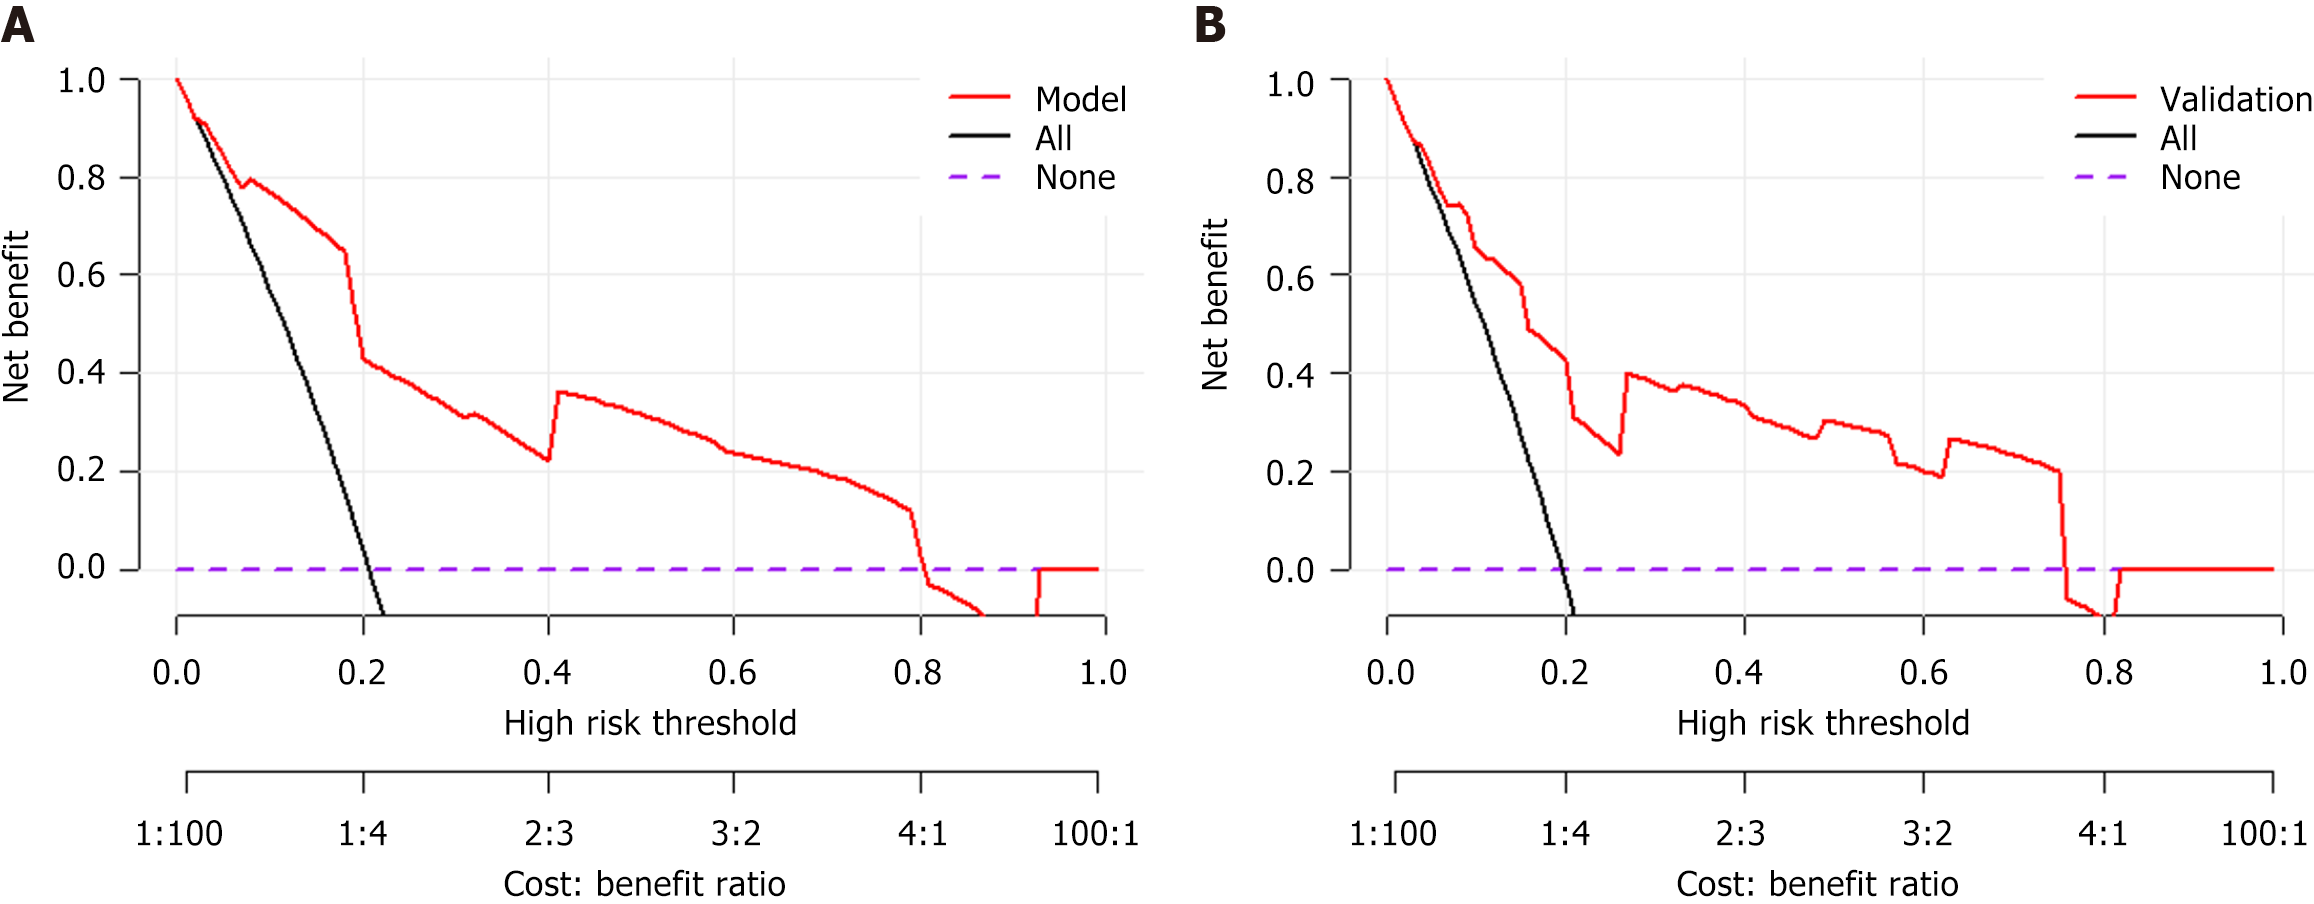
Figure 5 Decision curve analysis of the model prediction for acute variceal bleeding.
A: Training cohort; B: Validation cohort. Decision curve analysis (DCA) was performed to evaluate clinical utility by quantifying net benefit across threshold probabilities (0%-100%). The 'None' strategy (all patients are classified as negative) and 'All' strategy (all patients are classified as positive) served as references. The DCA demonstrated clinical utility across threshold probabilities 0%-80%, with net benefit superiority over 'treat none' strategy (reference line at y = 0). The DCA results confirm the model's clinical utility, with superior net benefit compared to alternative strategies.
- Citation: Zhang X, Song LM, Zheng YP, Qian BX, Liang J, Wang FM. Risk prediction of acute variceal bleeding in hepatocellular carcinoma patients undergoing systemic therapy based on immune checkpoint inhibitors. World J Gastrointest Oncol 2025; 17(8): 108887
- URL: https://www.wjgnet.com/1948-5204/full/v17/i8/108887.htm
- DOI: https://dx.doi.org/10.4251/wjgo.v17.i8.108887


