Copyright
©The Author(s) 2025.
World J Gastrointest Oncol. Aug 15, 2025; 17(8): 108887
Published online Aug 15, 2025. doi: 10.4251/wjgo.v17.i8.108887
Published online Aug 15, 2025. doi: 10.4251/wjgo.v17.i8.108887
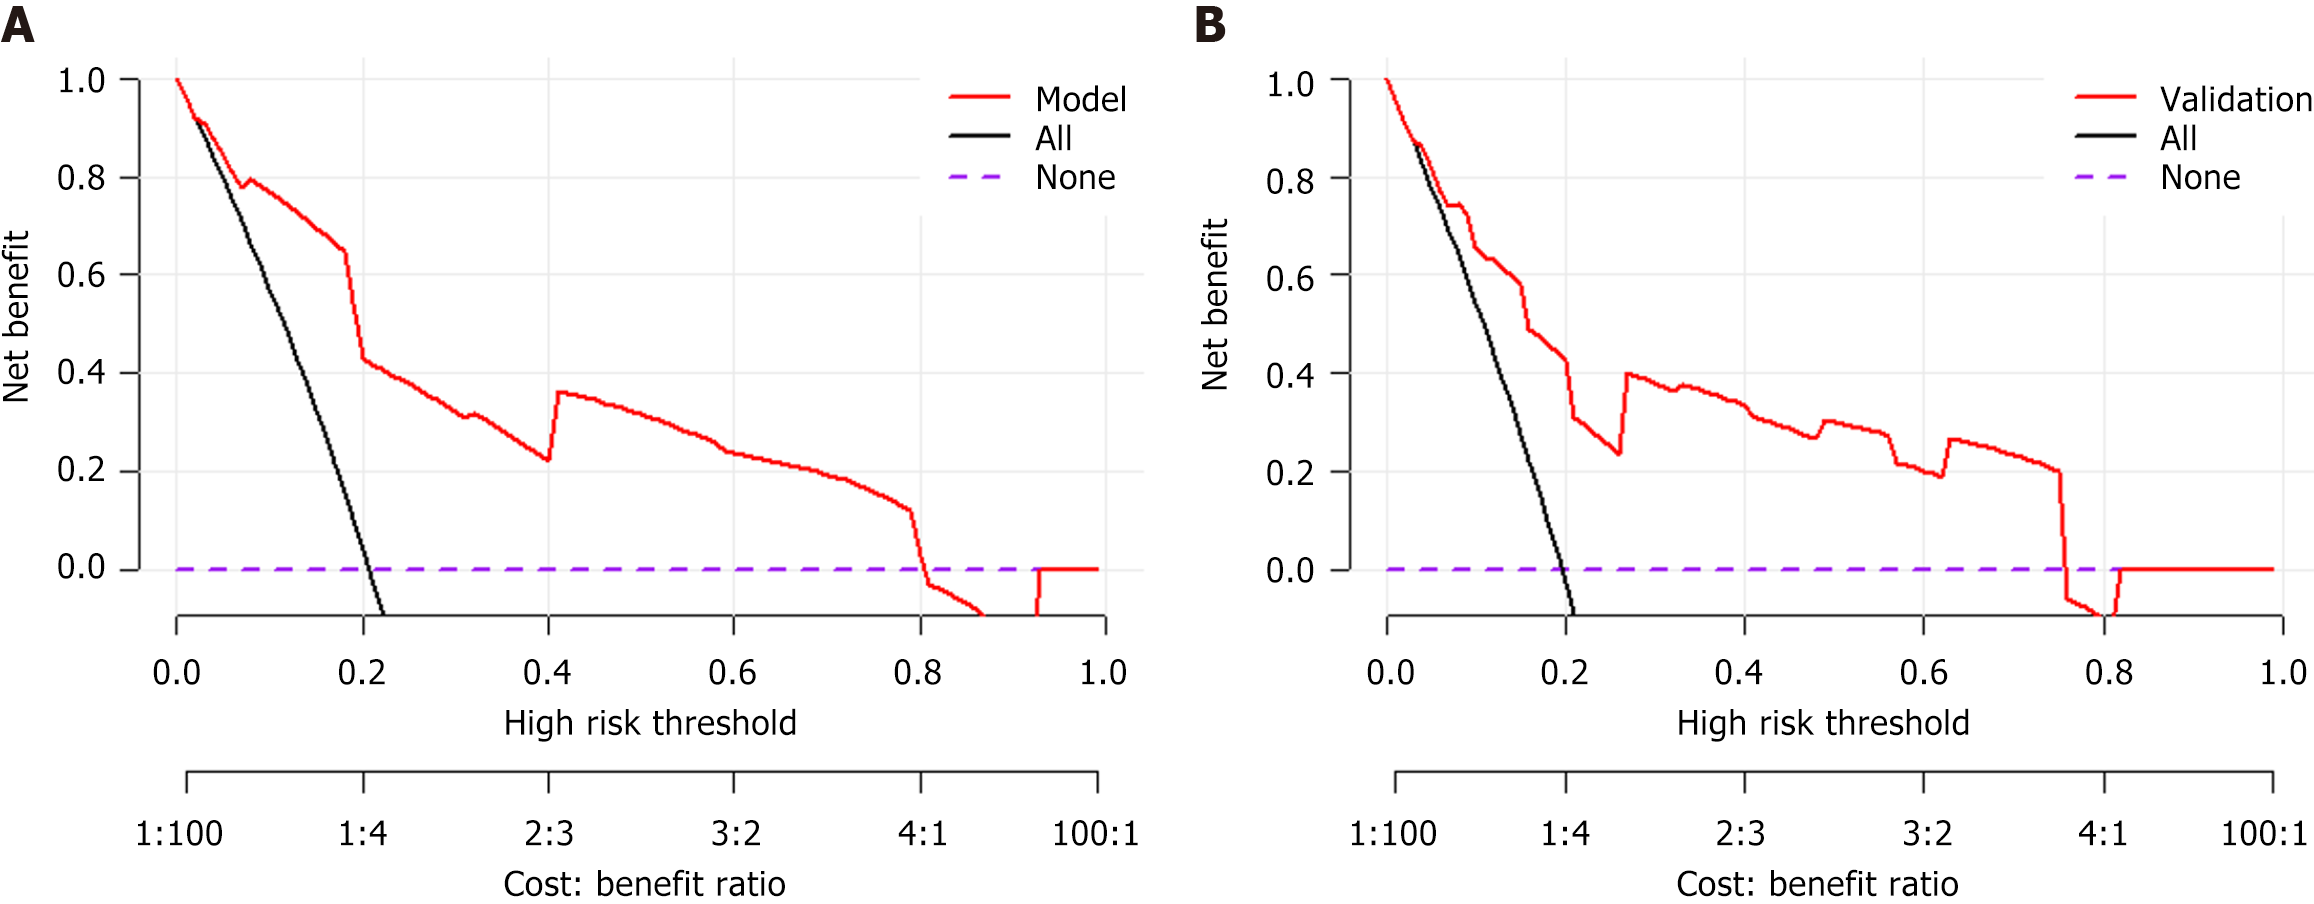
Figure 5 Decision curve analysis of the model prediction for acute variceal bleeding.
A: Training cohort; B: Validation cohort. Decision curve analysis (DCA) was performed to evaluate clinical utility by quantifying net benefit across threshold probabilities (0%-100%). The 'None' strategy (all patients are classified as negative) and 'All' strategy (all patients are classified as positive) served as references. The DCA demonstrated clinical utility across threshold probabilities 0%-80%, with net benefit superiority over 'treat none' strategy (reference line at y = 0). The DCA results confirm the model's clinical utility, with superior net benefit compared to alternative strategies.
- Citation: Zhang X, Song LM, Zheng YP, Qian BX, Liang J, Wang FM. Risk prediction of acute variceal bleeding in hepatocellular carcinoma patients undergoing systemic therapy based on immune checkpoint inhibitors. World J Gastrointest Oncol 2025; 17(8): 108887
- URL: https://www.wjgnet.com/1948-5204/full/v17/i8/108887.htm
- DOI: https://dx.doi.org/10.4251/wjgo.v17.i8.108887


