Copyright
©The Author(s) 2025.
World J Gastrointest Oncol. May 15, 2025; 17(5): 103594
Published online May 15, 2025. doi: 10.4251/wjgo.v17.i5.103594
Published online May 15, 2025. doi: 10.4251/wjgo.v17.i5.103594
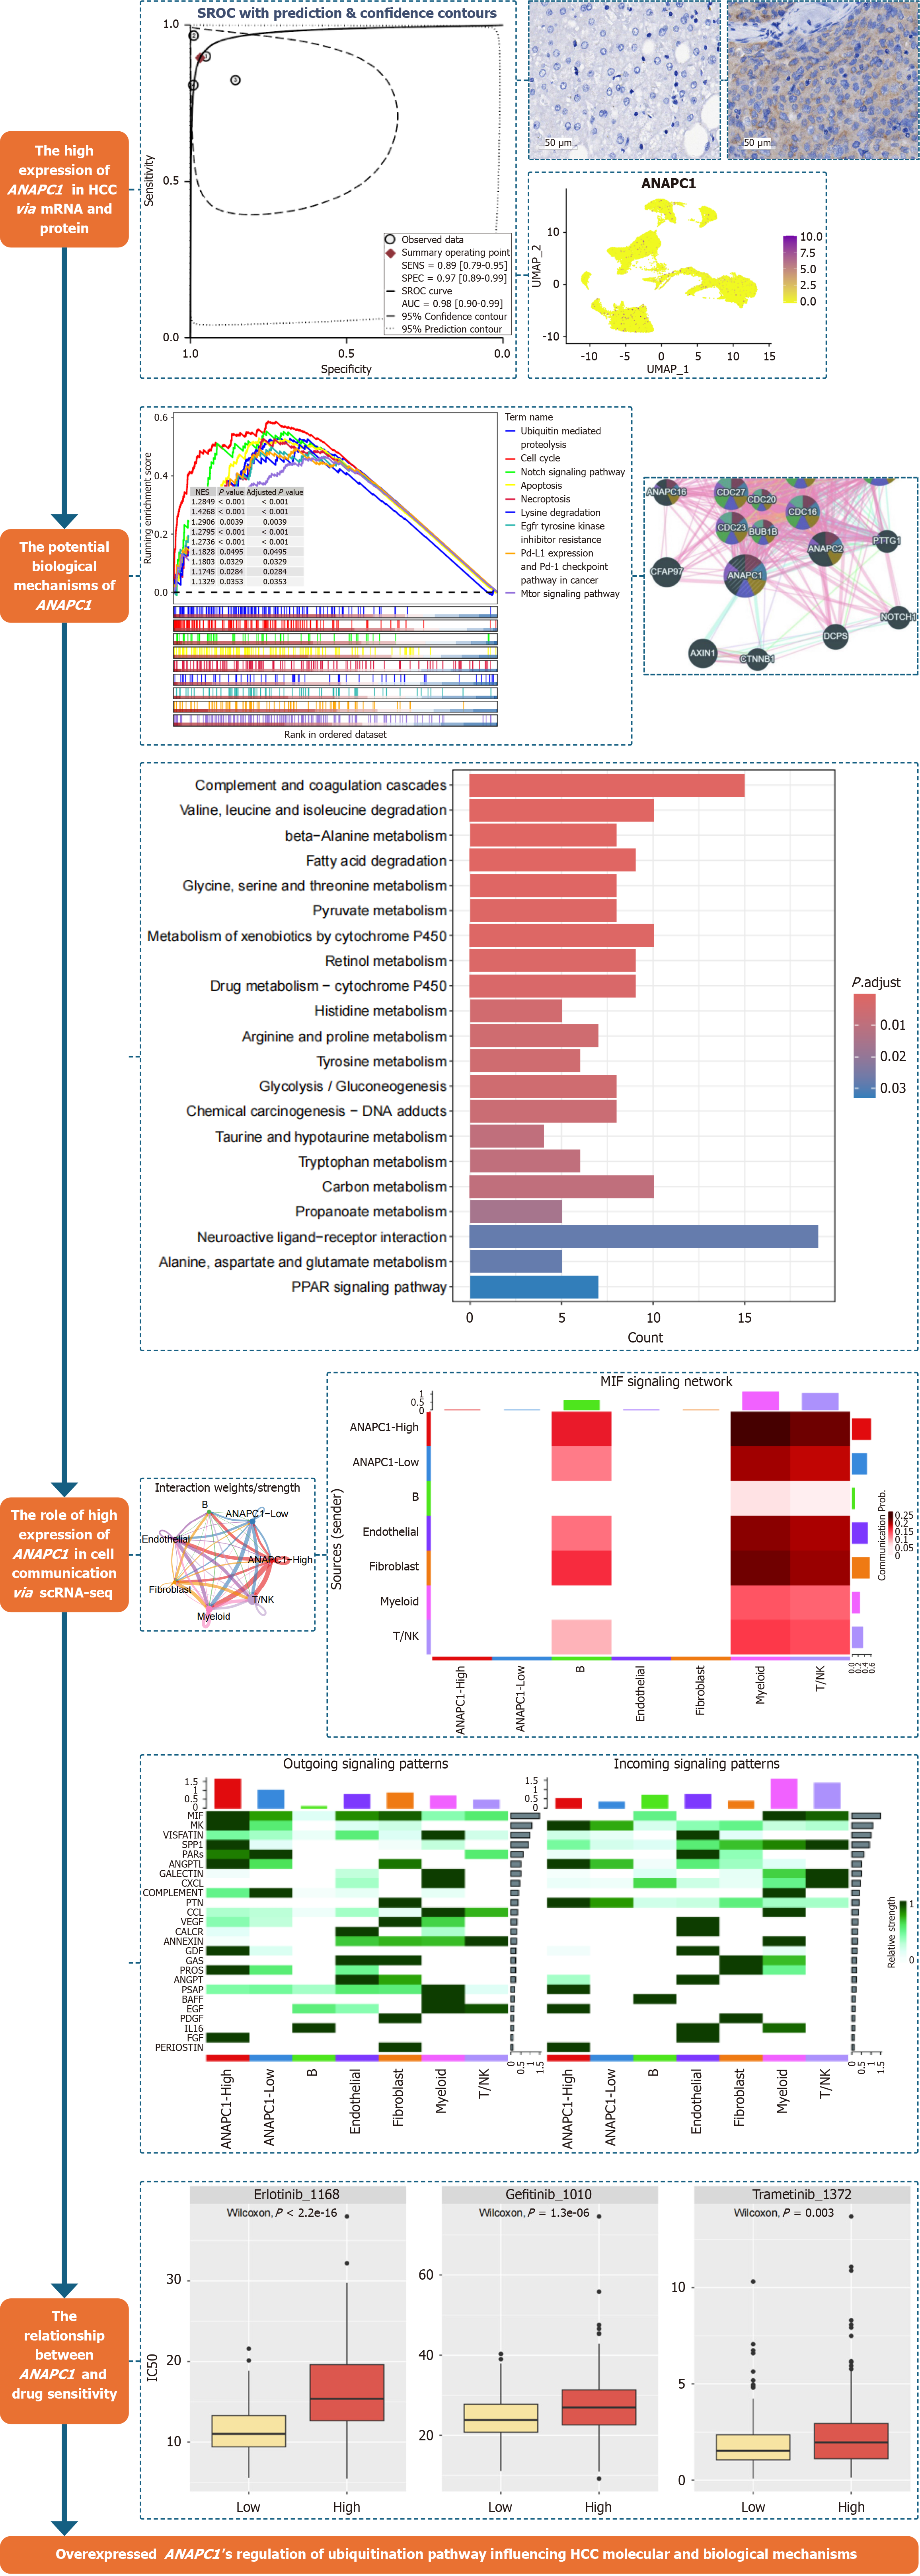
Figure 1 The main analysis flow chart of this study.
HCC: Hepatocellular carcinoma; mRNA: Messenger RNA; scRNA-seq: Single-cell RNA sequencing; SROC: Synthetic receiver operating characteristic; UMAP: Uniform manifold approximation and projection; NK: Natural killer; MIF: Migration inhibitory factor; MK: Midkine; VISFATIN: Visfatin; SPP1: Secreted phosphoprotein 1; PARs: Protease-activated receptors; ANGPTL: Angiopoietin-like protein; GALECTIN: Galactoside-binding lectin; CXCL: Chemokine (C-X-C motif) ligand; COMPLEMENT: Complement system proteins; PTN: Pleiotrophin; CCL: Chemokine (C-C motif) ligand; VEGF: Vascular endothelial growth factor; CALCR: Calcitonin receptor; ANNEXIN: Annexin; GDF: Growth differentiation factor; GAS: Growth arrest-specific 6; PROS: Protein S; ANGPT: Angiopoietin; PSAP: Prosaposin; BAFF: B cell activating factor; EGF: Epidermal growth factor; PDGF: Platelet-derived growth factor; IL16: Interleukin 16; FGF: Fibroblast growth factor; PERIOSTIN: Periostin.
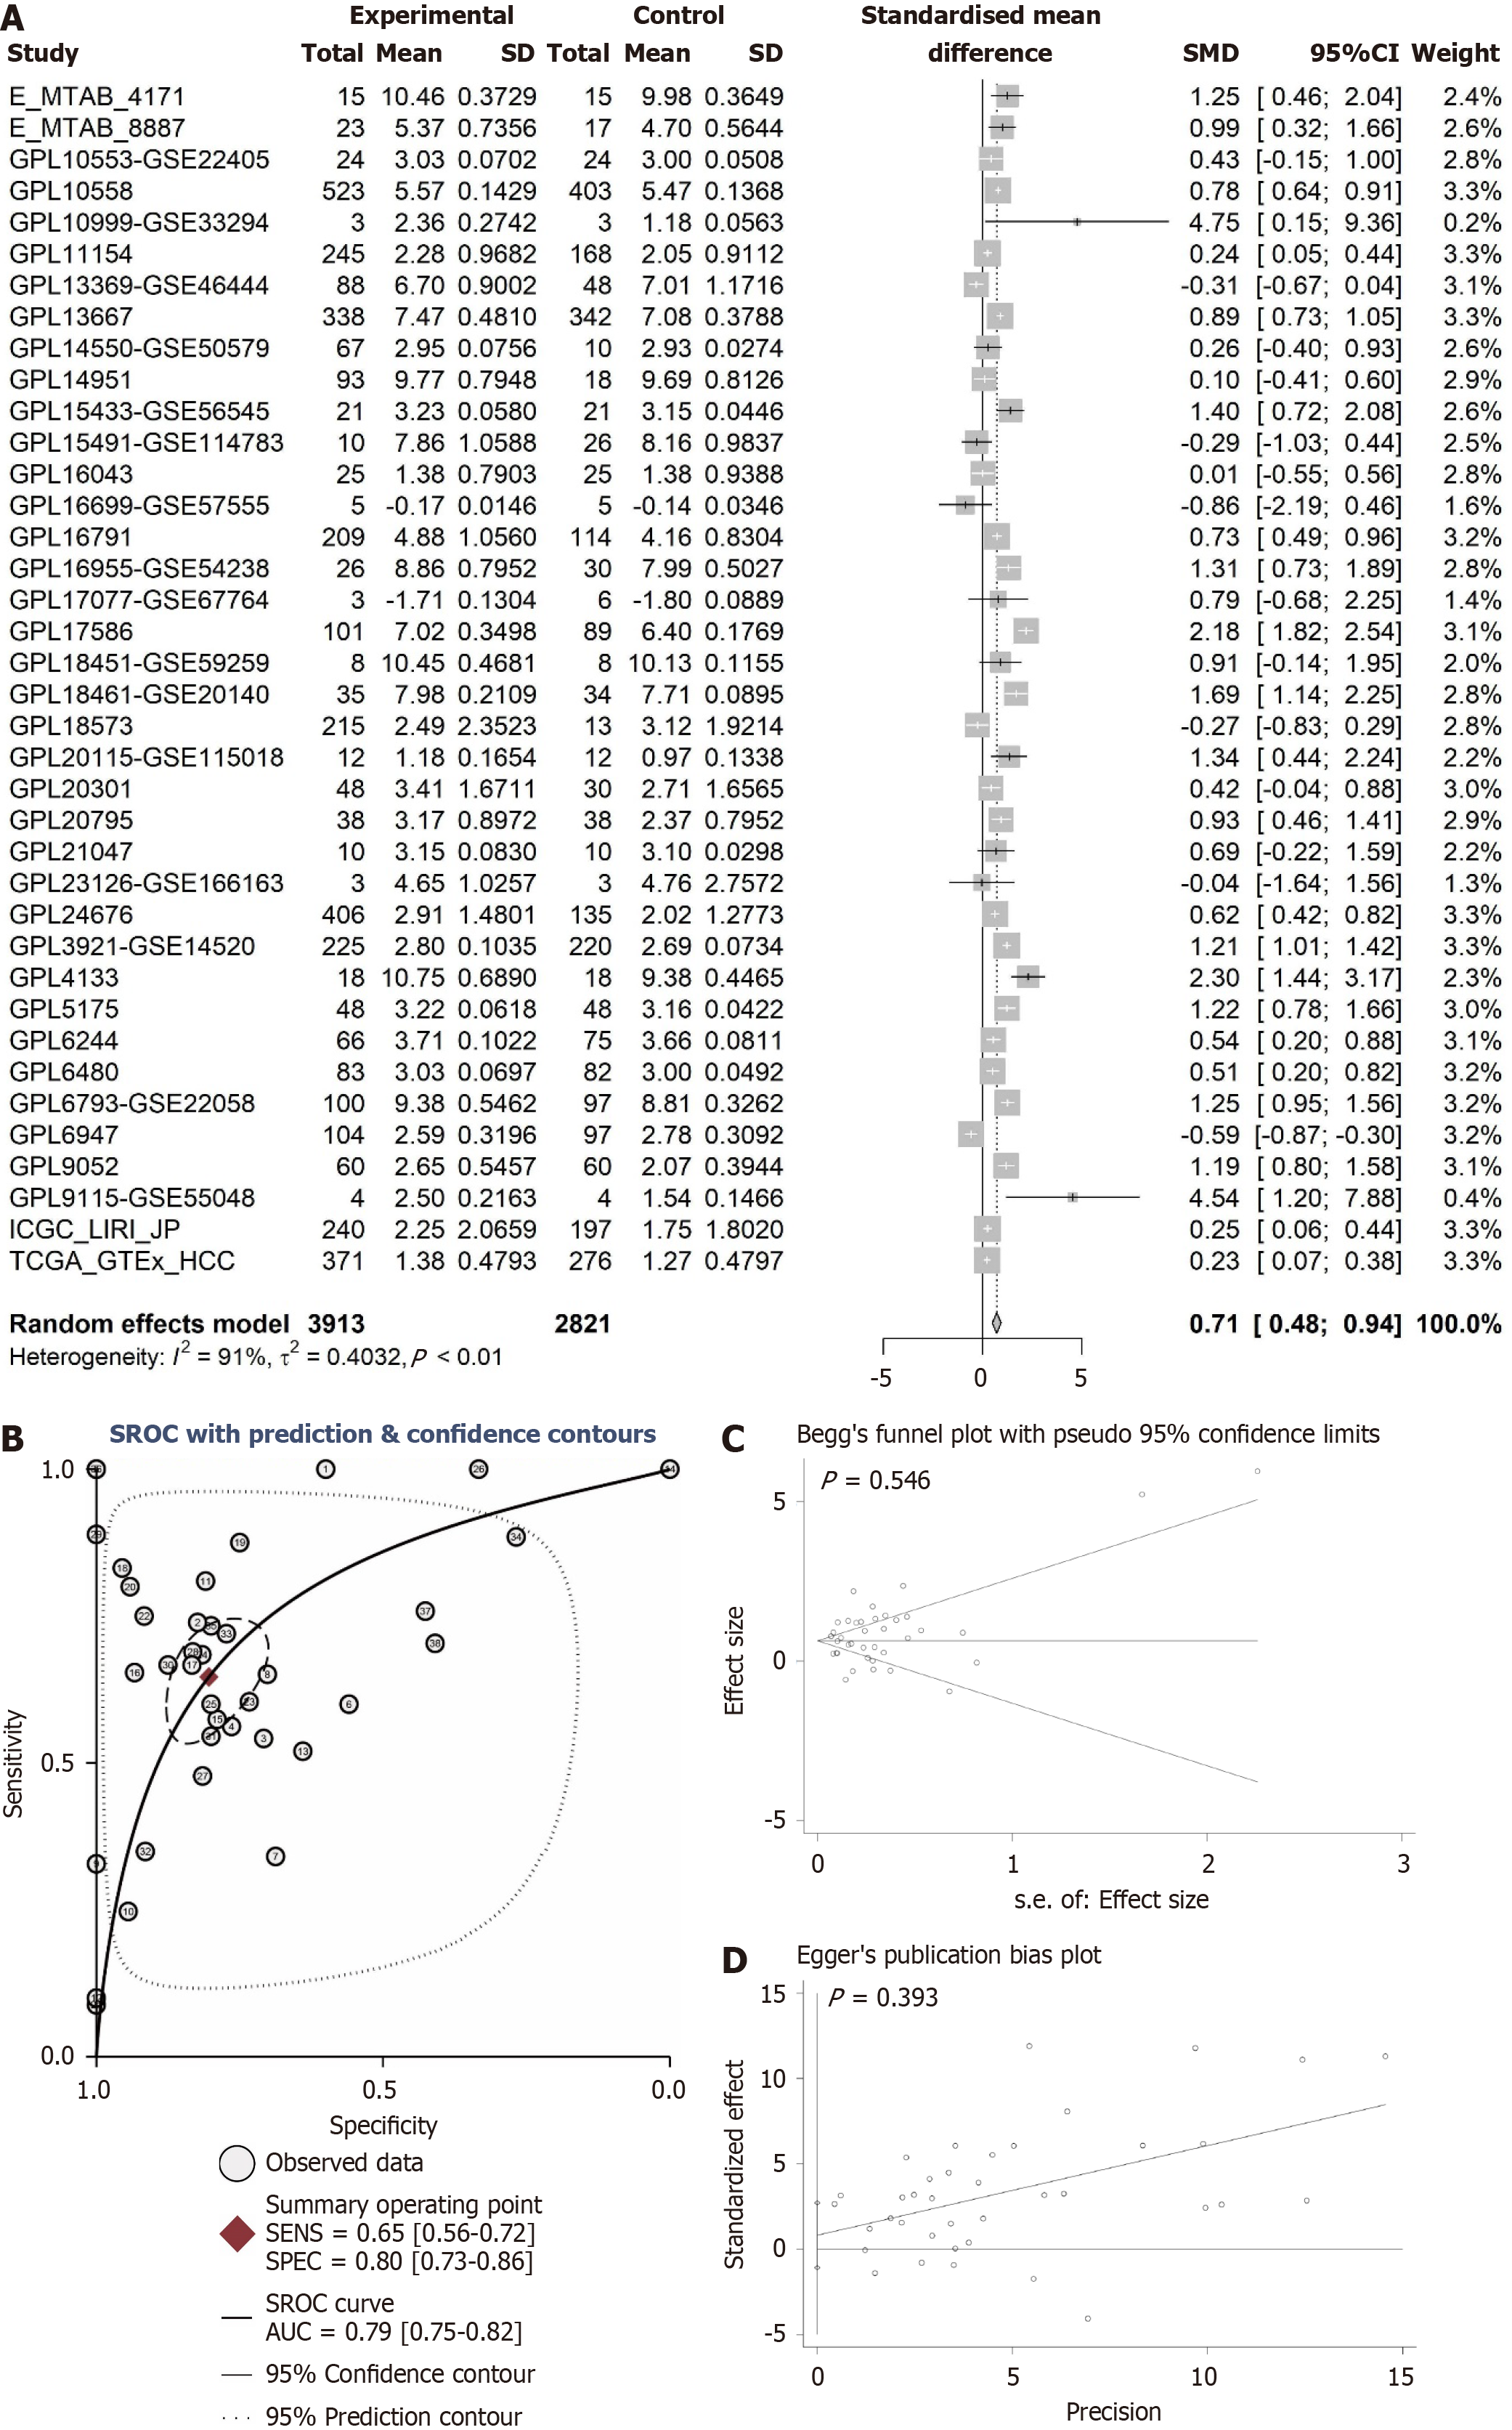
Figure 2 Comprehensive analysis of ANAPC1 messenger RNA expression in hepatocellular carcinoma.
A: Forest plot of integrated ANAPC1 messenger RNA (mRNA) expression from 38 platforms; B: Summary receiver operating characteristic curve; C: Begg’s test; D: Egger’s test. Calculated using the integration method, a higher area under the curve indicates a more pronounced difference in ANAPC1 mRNA expression between non-hepatocellular carcinoma and hepatocellular carcinoma tissues. CI: Confidence interval; MTAB: Matrix table; GPL: Gene platform; ICGC: International cancer genome consortium; TCGA: The cancer genome atlas; HCC: Hepatocellular carcinoma; SENS: Sensitivity; SPEC: Specificity; SROC: Synthetic receiver operating characteristic; AUC: Area under the curve.
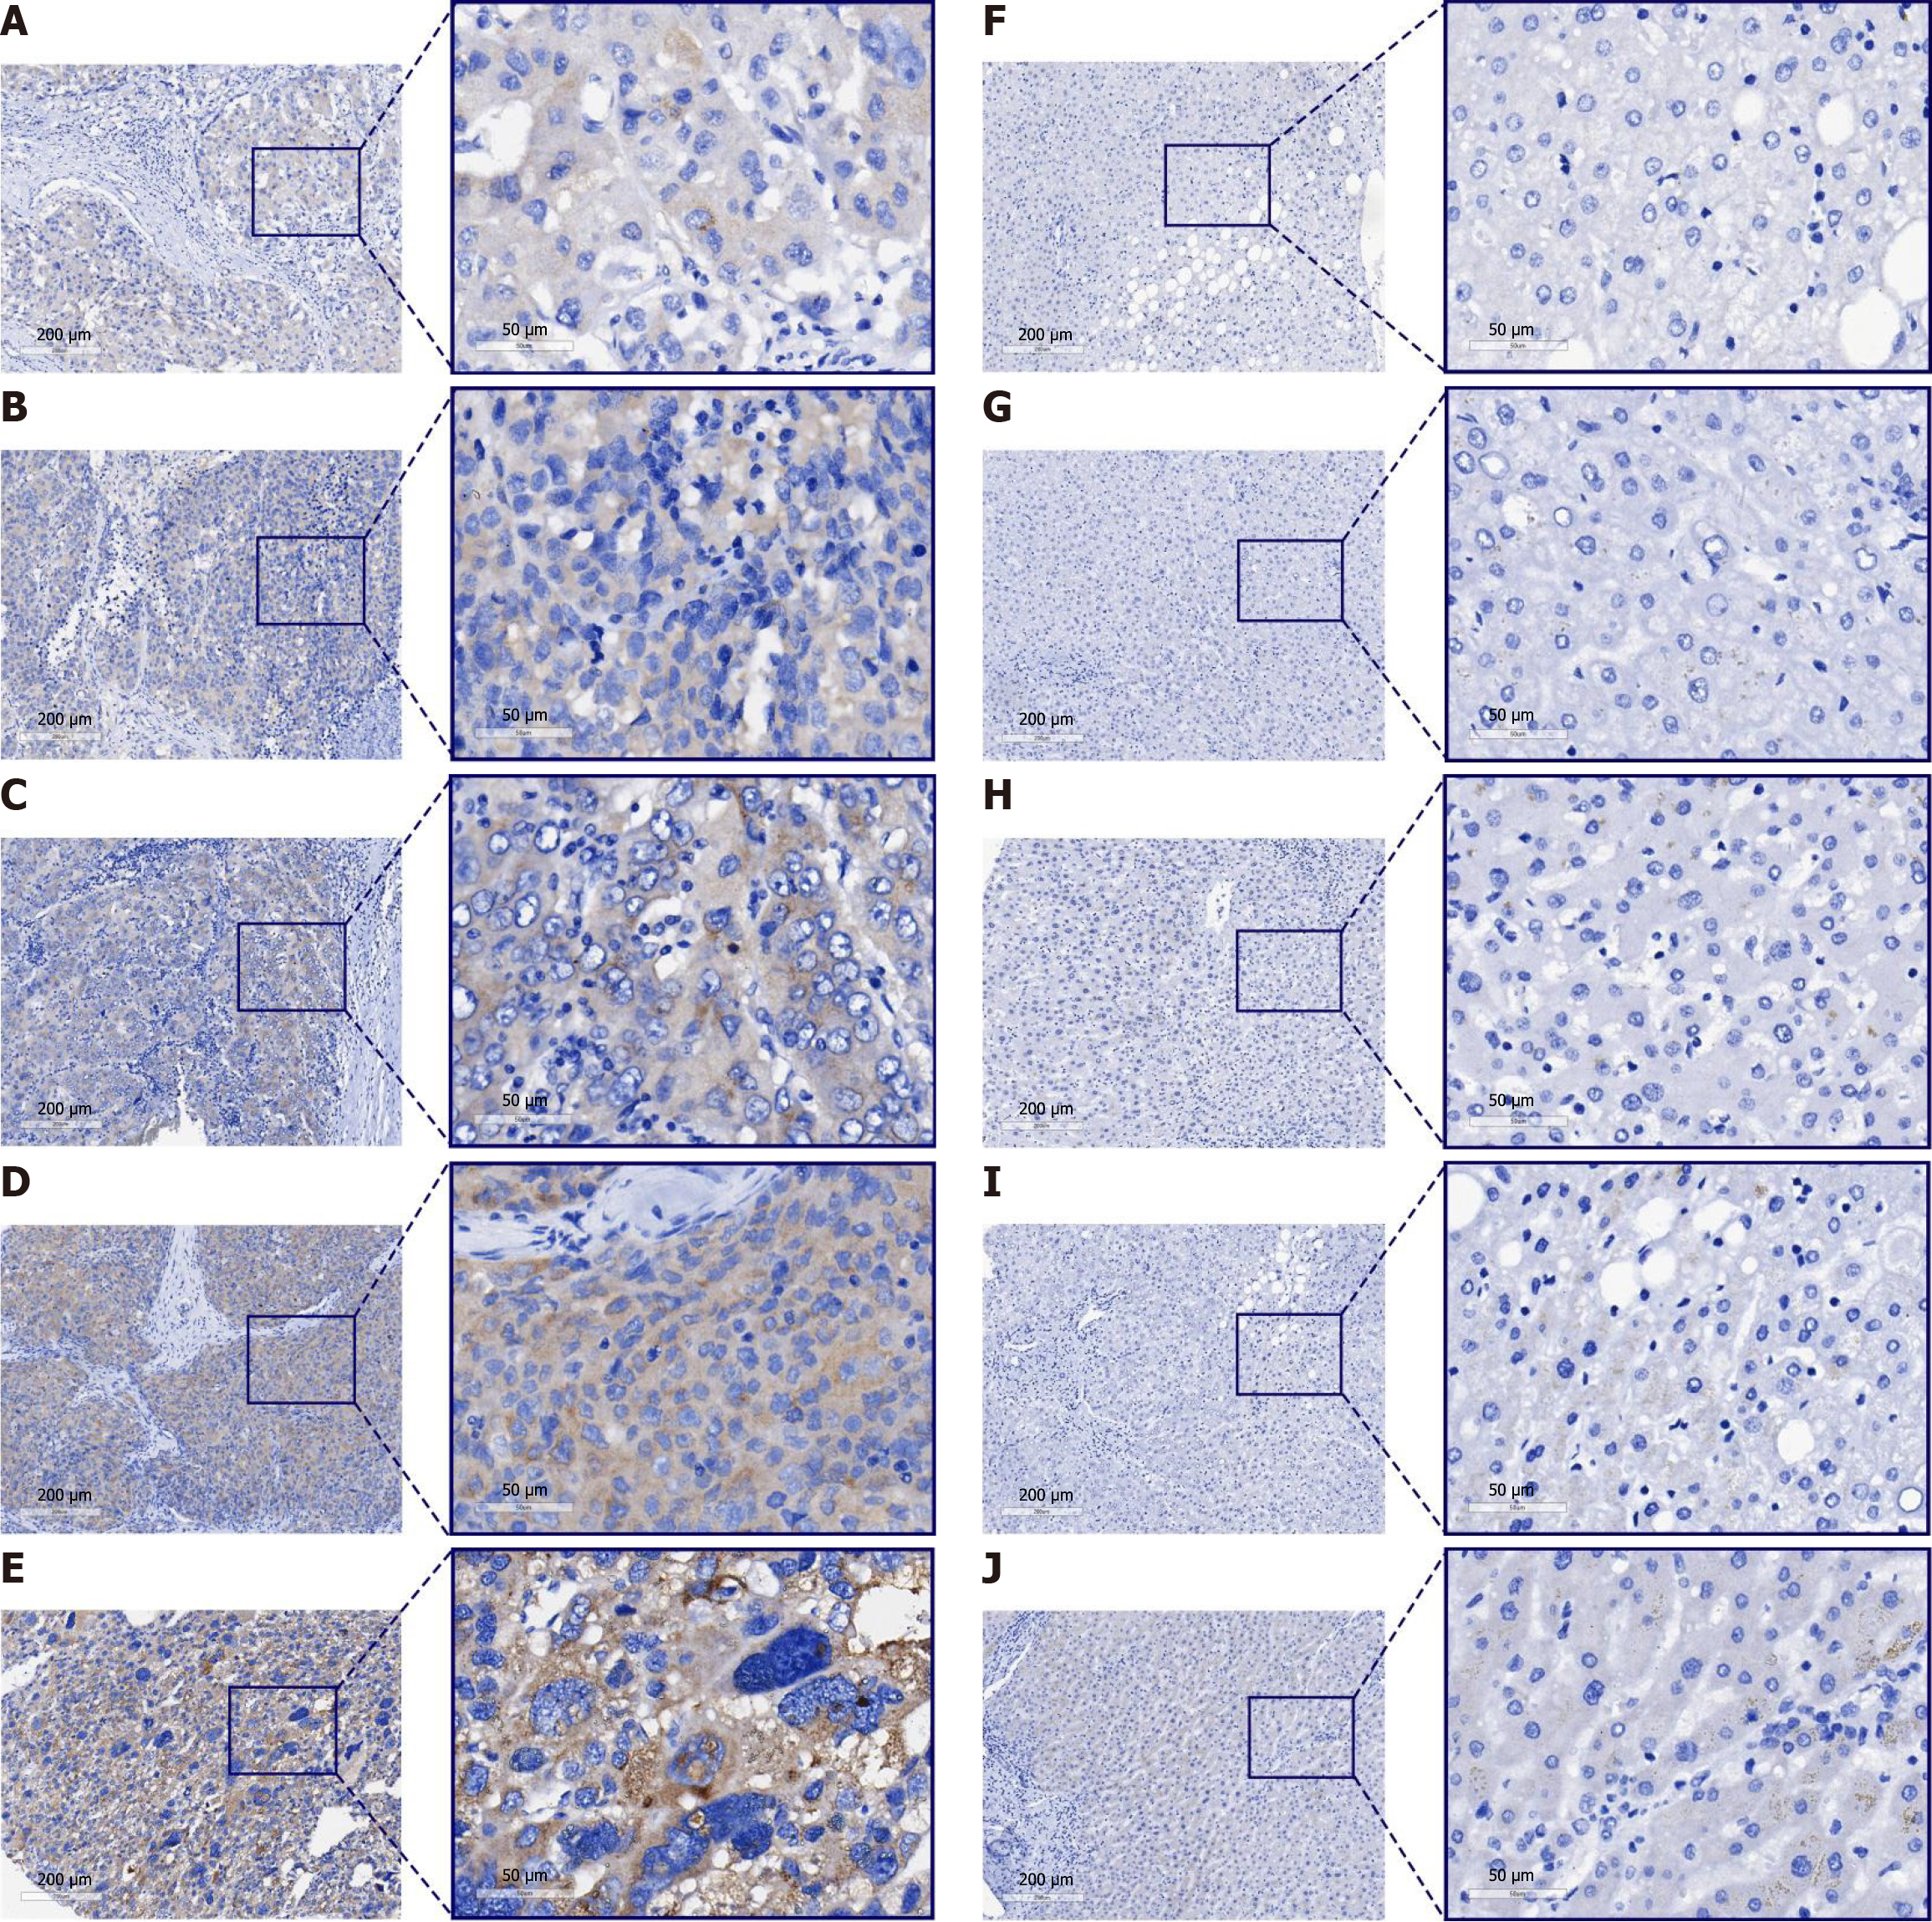
Figure 3 Immunohistochemistry staining of non-hepatocellular carcinoma and hepatocellular carcinoma samples.
A-E: Hepatocellular carcinoma samples; F-J: Non-hepatocellular carcinoma samples.
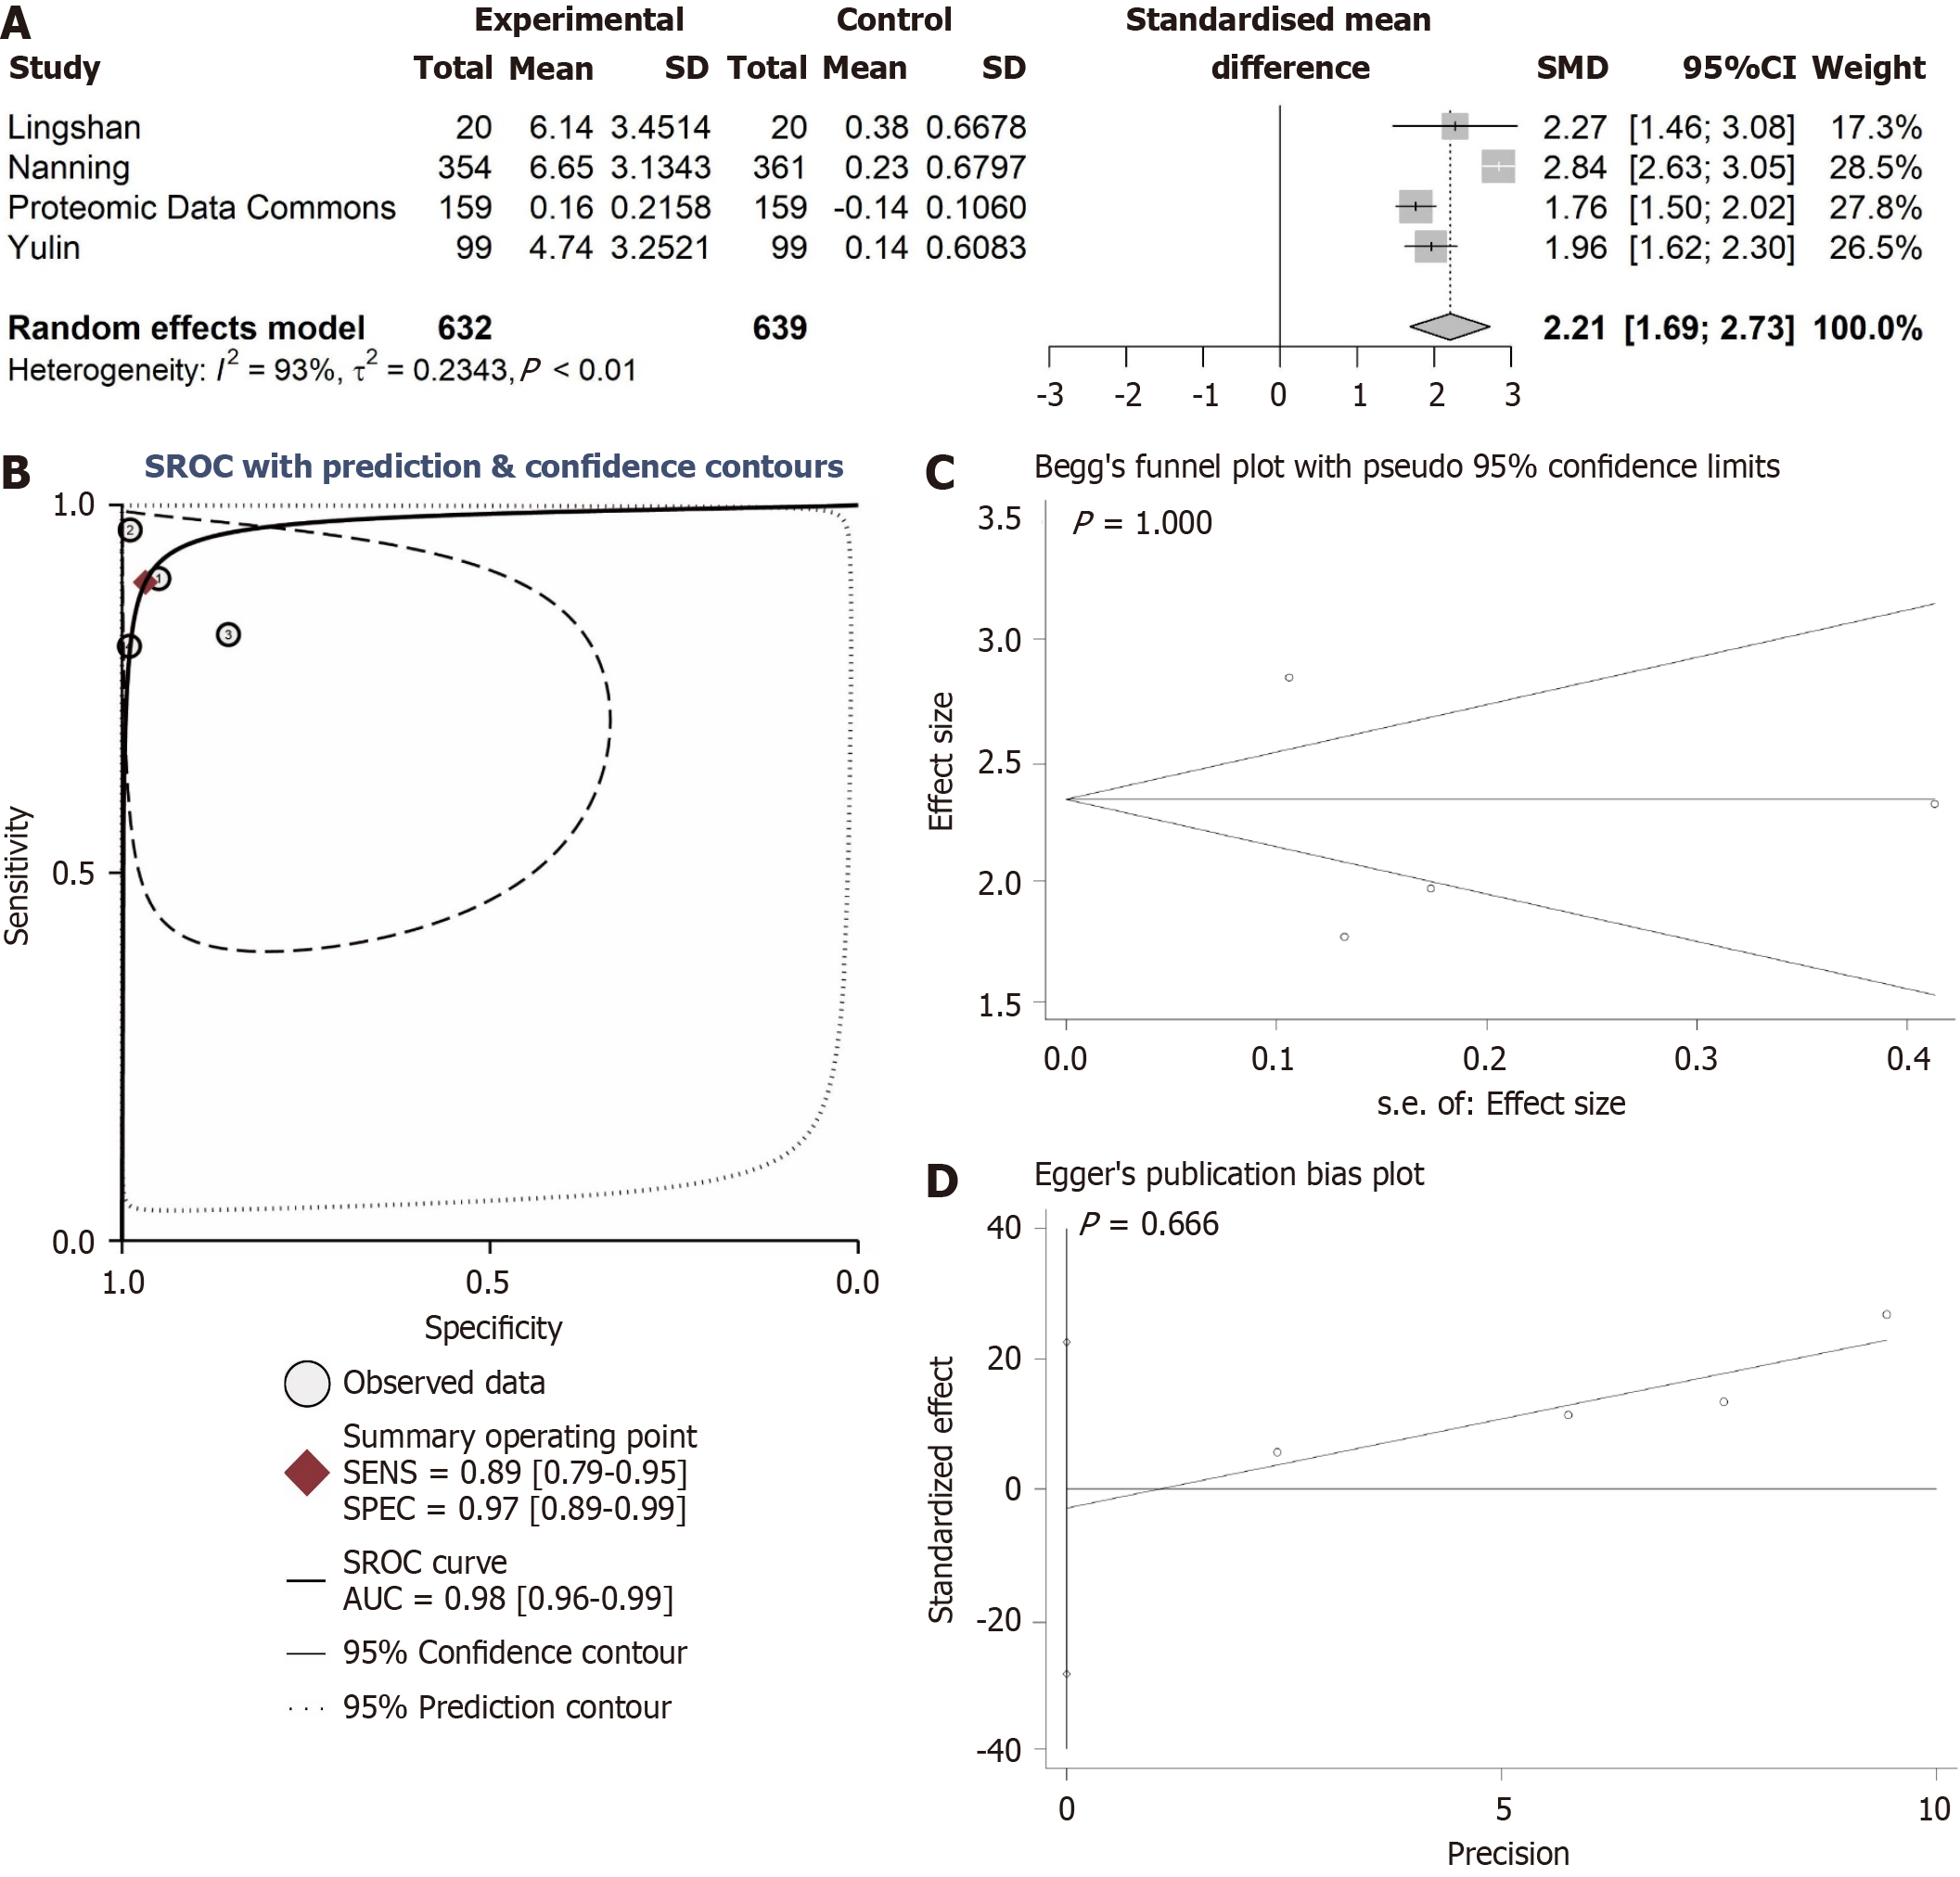
Figure 4 Comprehensive analysis of ANAPC1 protein expression.
A: Forest plot of ANAPC1 protein comprehensive expression; B: Summary receiver operating characteristic curve; C: Begg’s test; D: Egger’s test. Calculated using the integration method, a higher area under the curve indicates a more distinct difference in ANAPC1 protein expression between non-hepatocellular carcinoma and hepatocellular carcinoma tissues. CI: Confidence interval; SENS: Sensitivity; SPEC: Specificity; SROC: Synthetic receiver operating characteristic; AUC: Area under the curve.
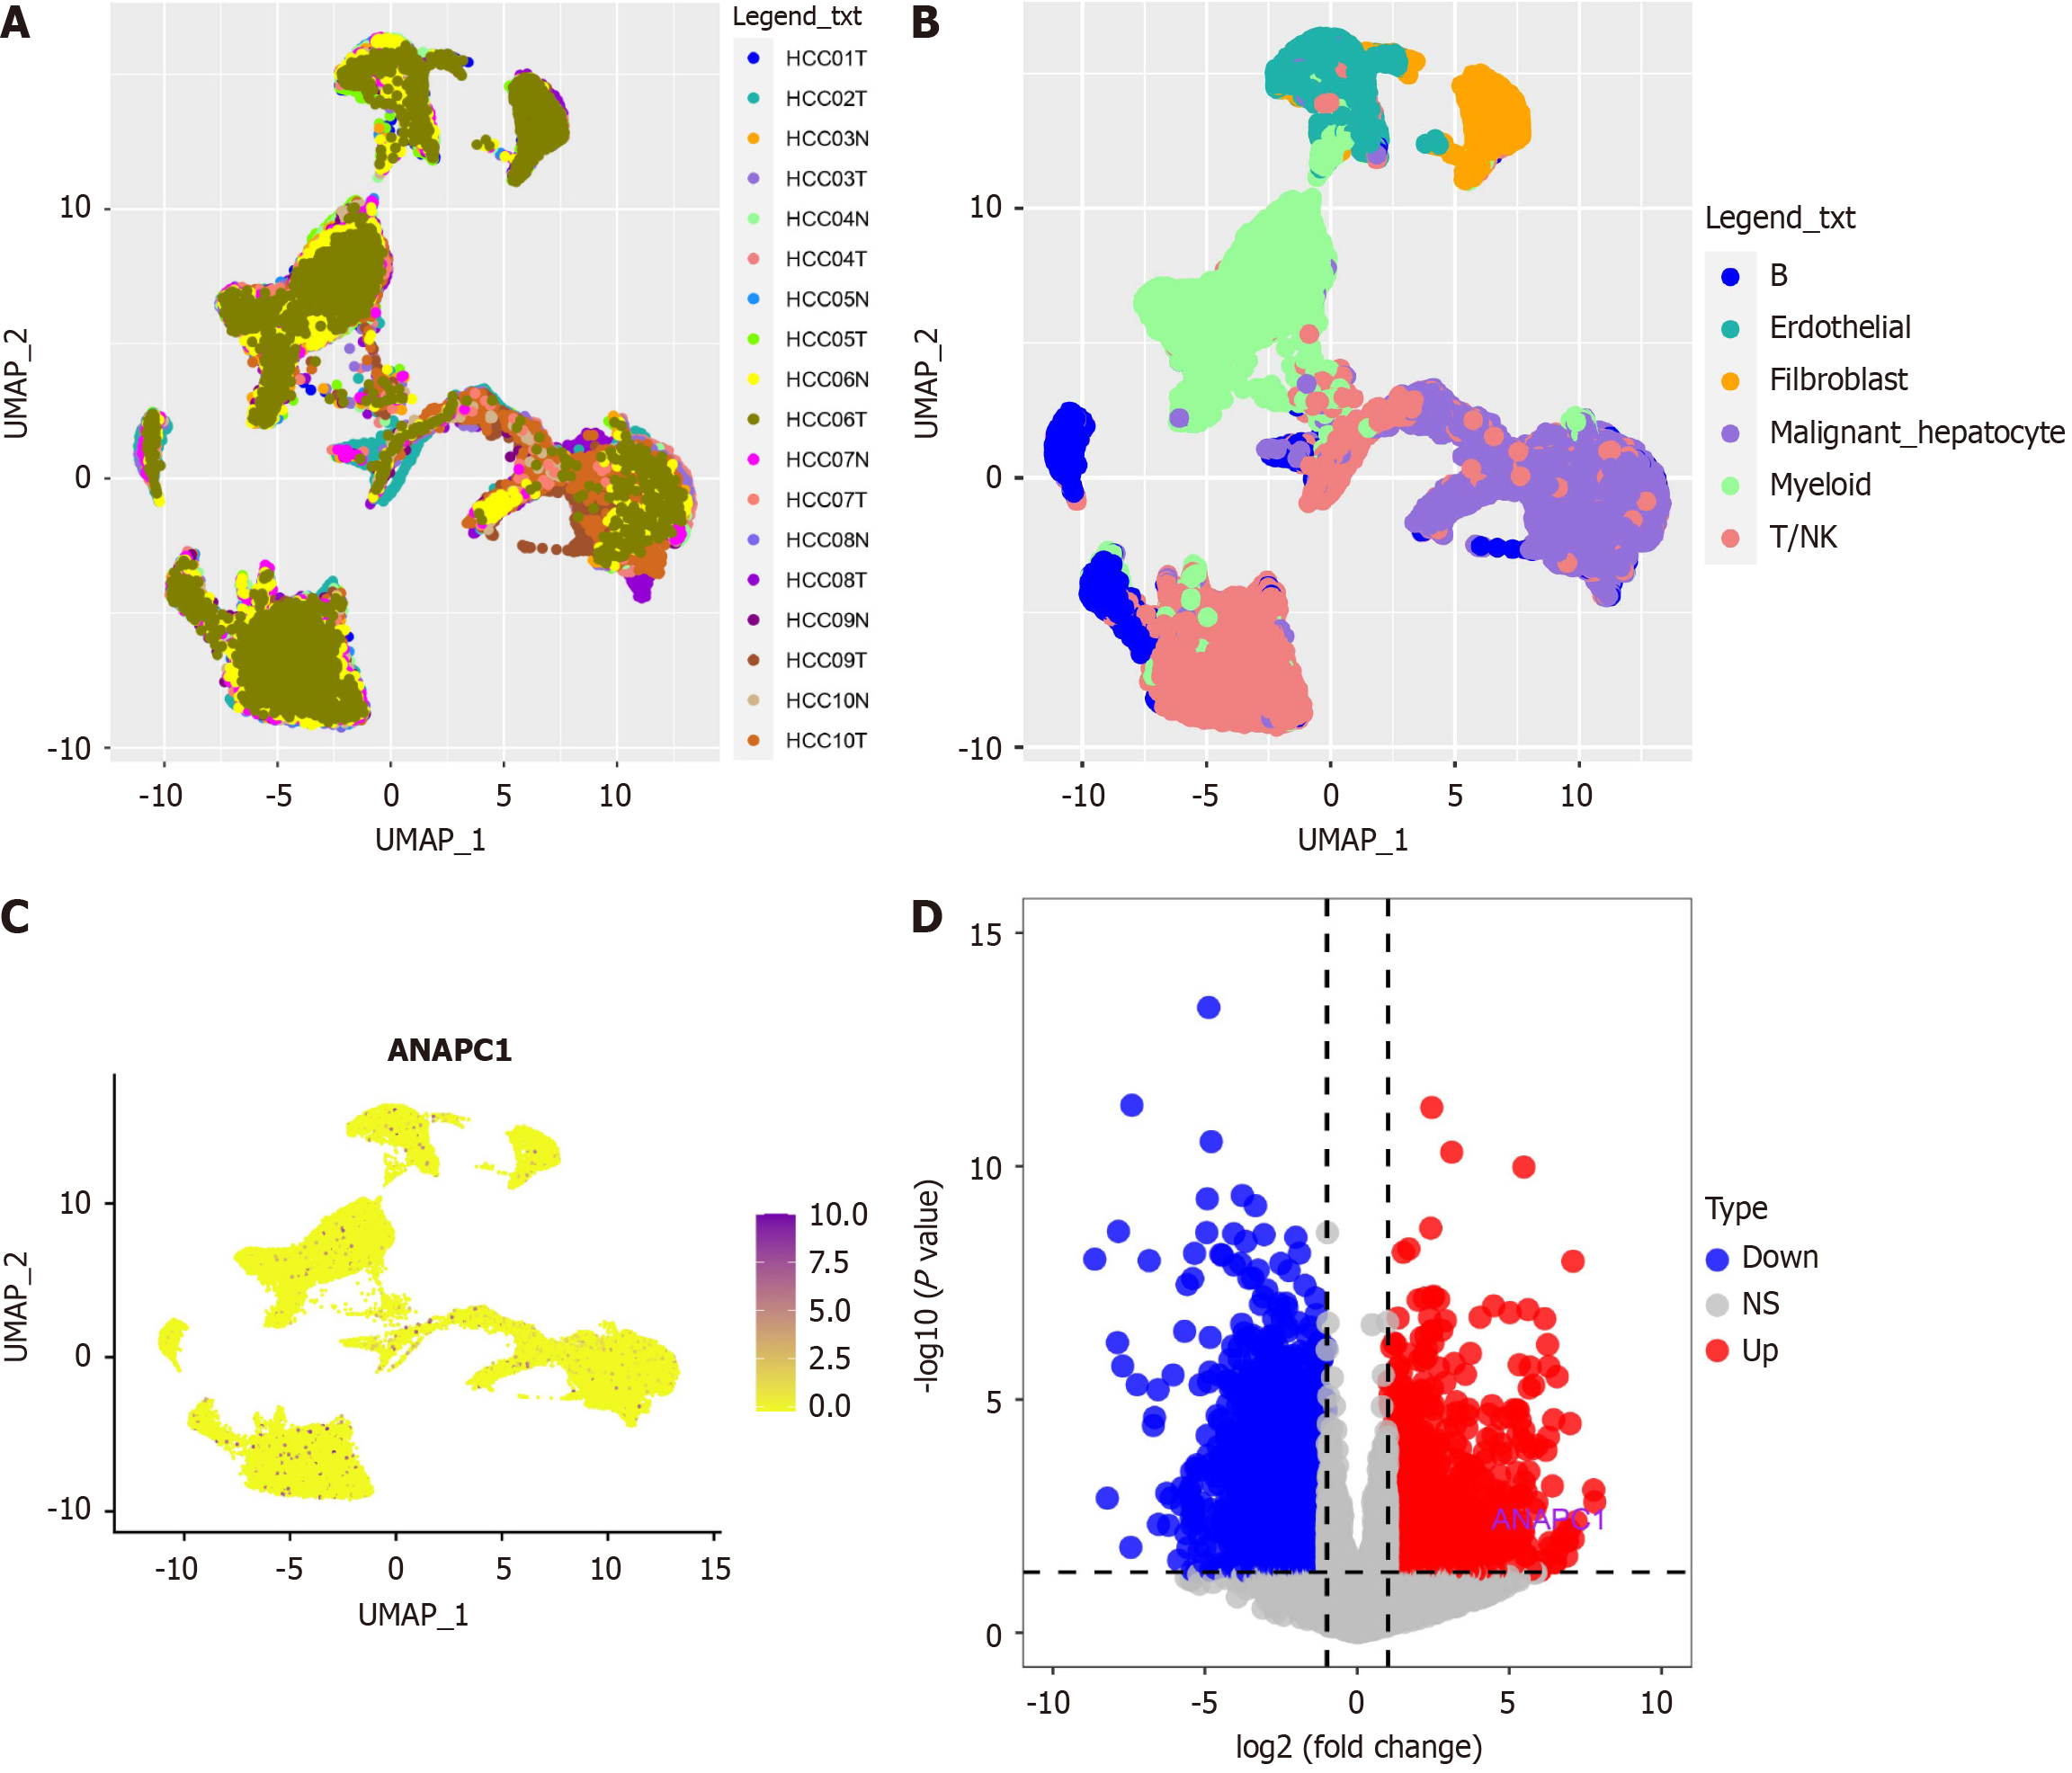
Figure 5 ANAPC1 expression profiling in single-cell RNA sequencing.
A: Sample distribution plot from GSE14694; B: Cell type distribution plot; C: ANAPC1 expression levels across different cell types; D: Volcano plot. UMAP: Uniform manifold approximation and projection; HCC: Hepatocellular carcinoma; NK: Natural killer.
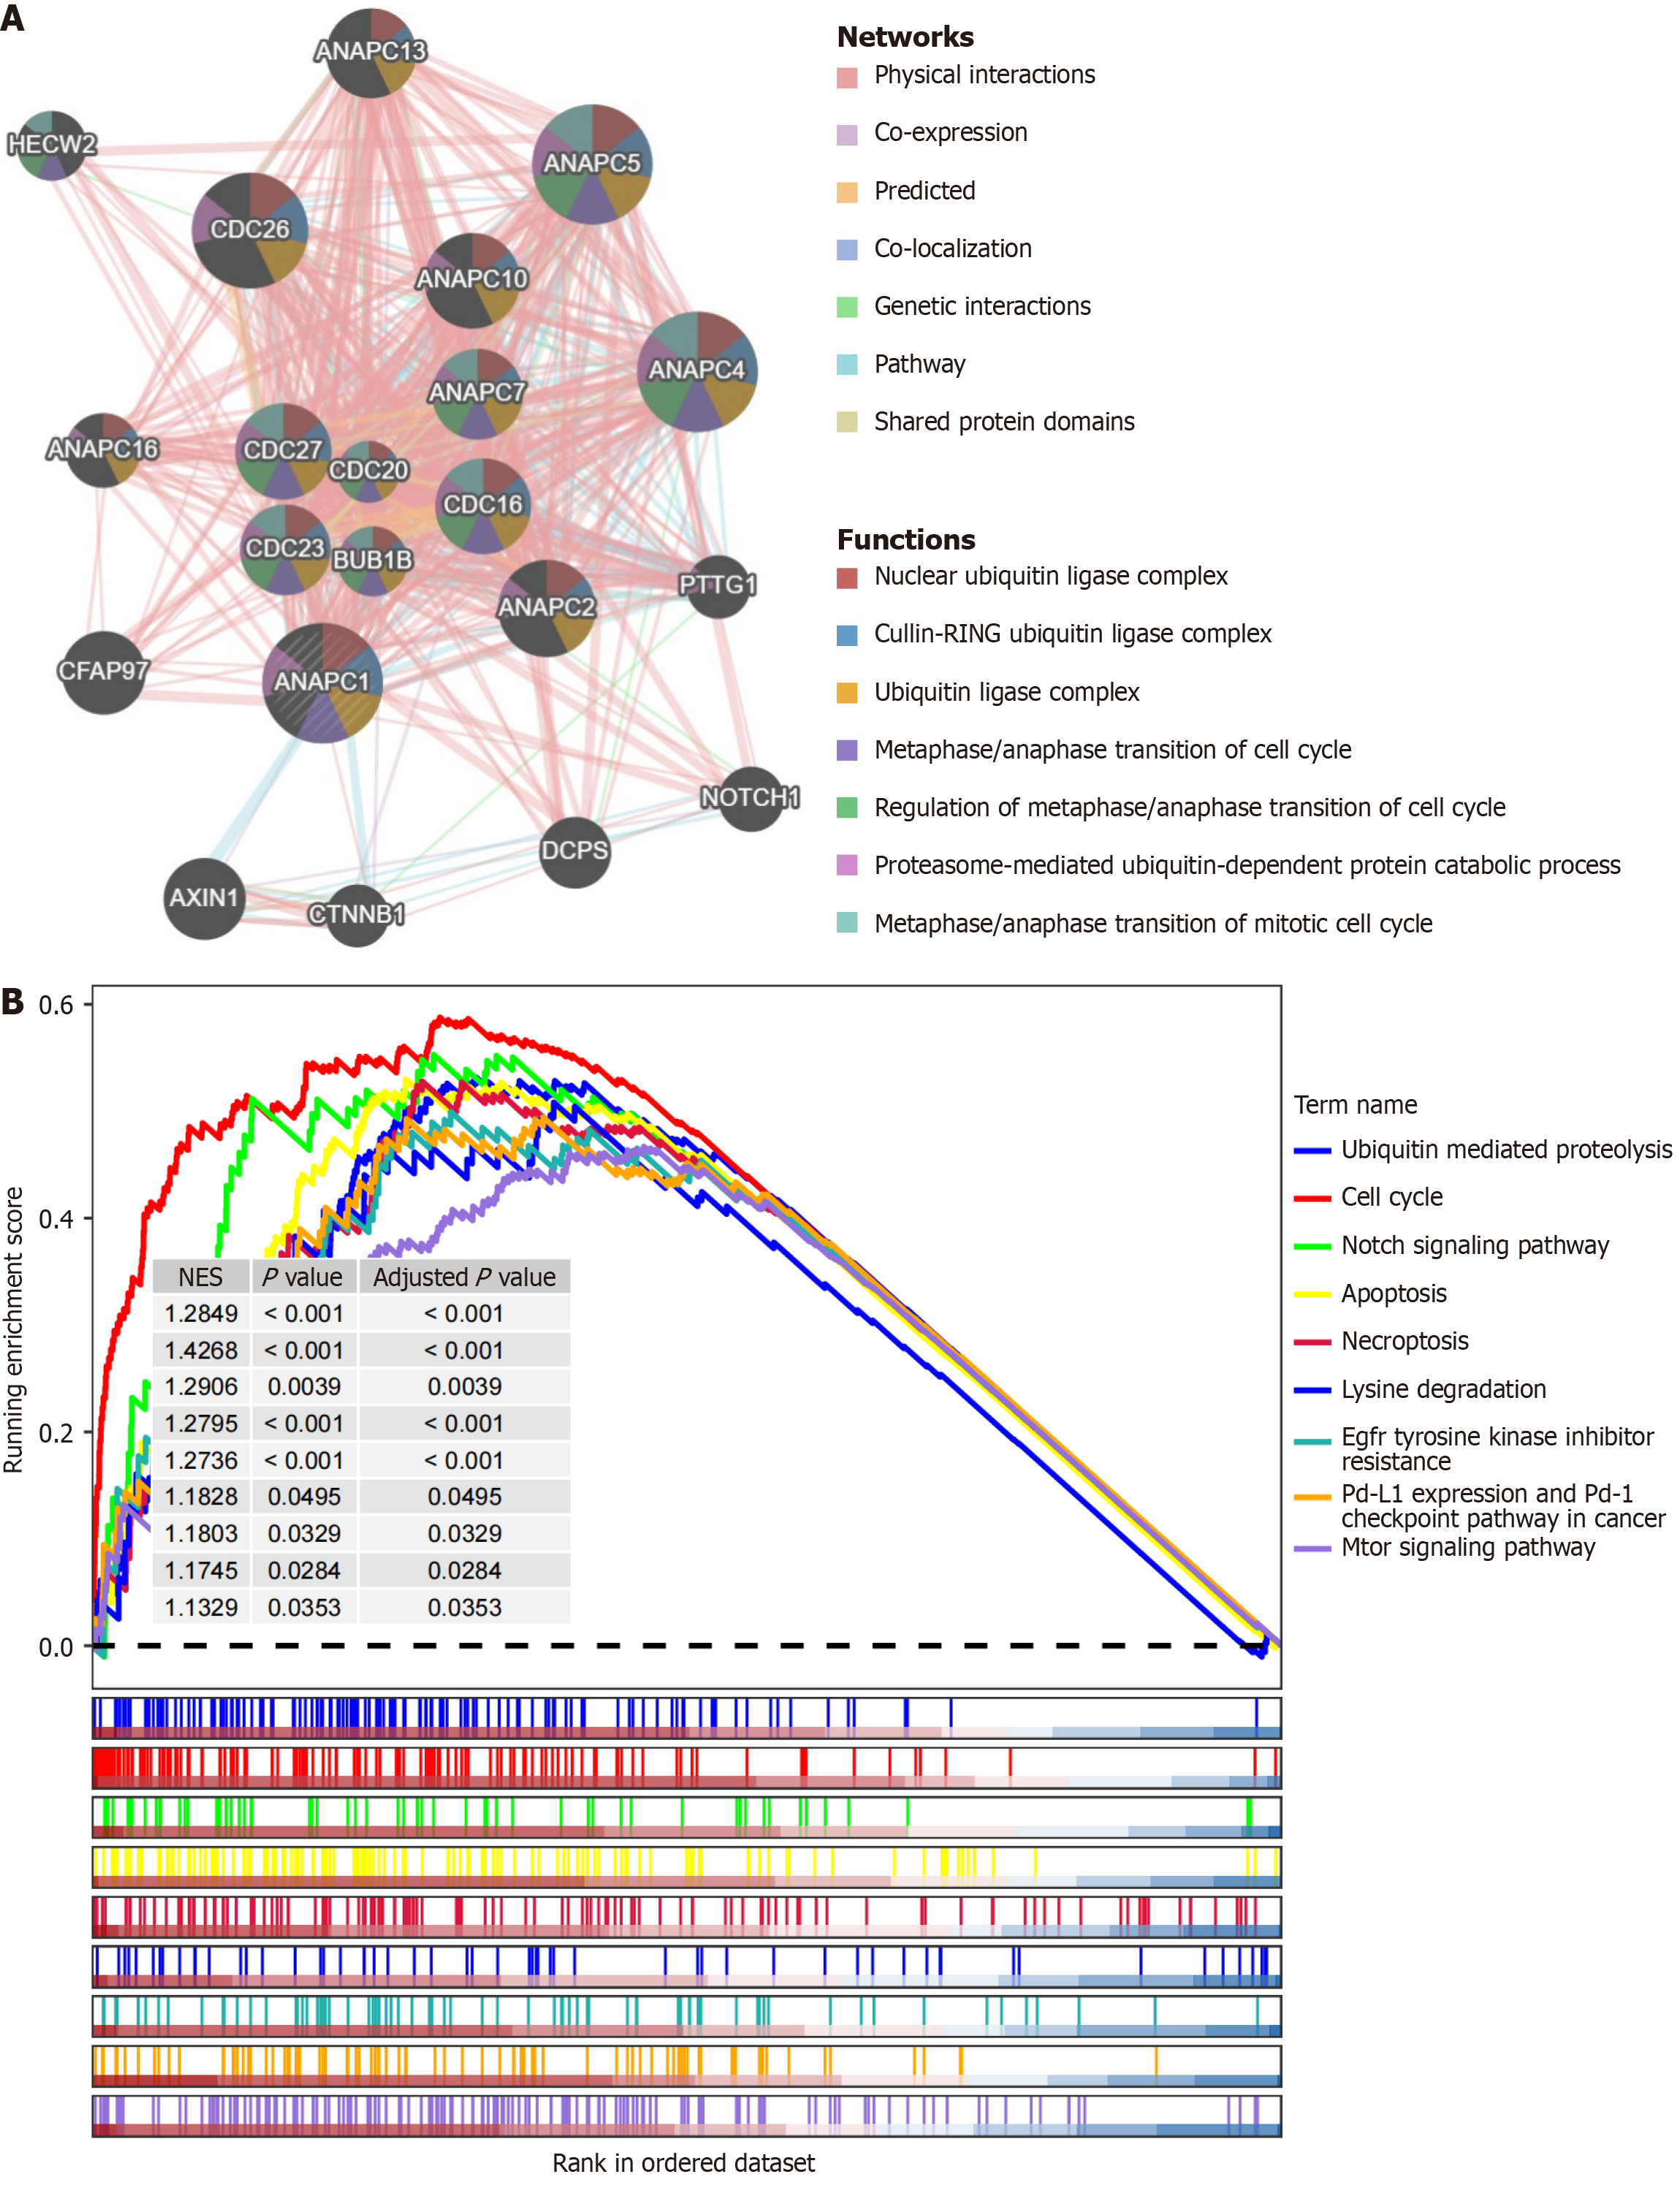
Figure 6 Preliminary exploration of the molecular function of ANAPC1.
A: GeneMANIA analysis; B: Gene set enrichment analysis. NES: Normalized enrichment score; Pd-1: Programmed cell death protein 1; Pd-L1: Programmed death-ligand 1.
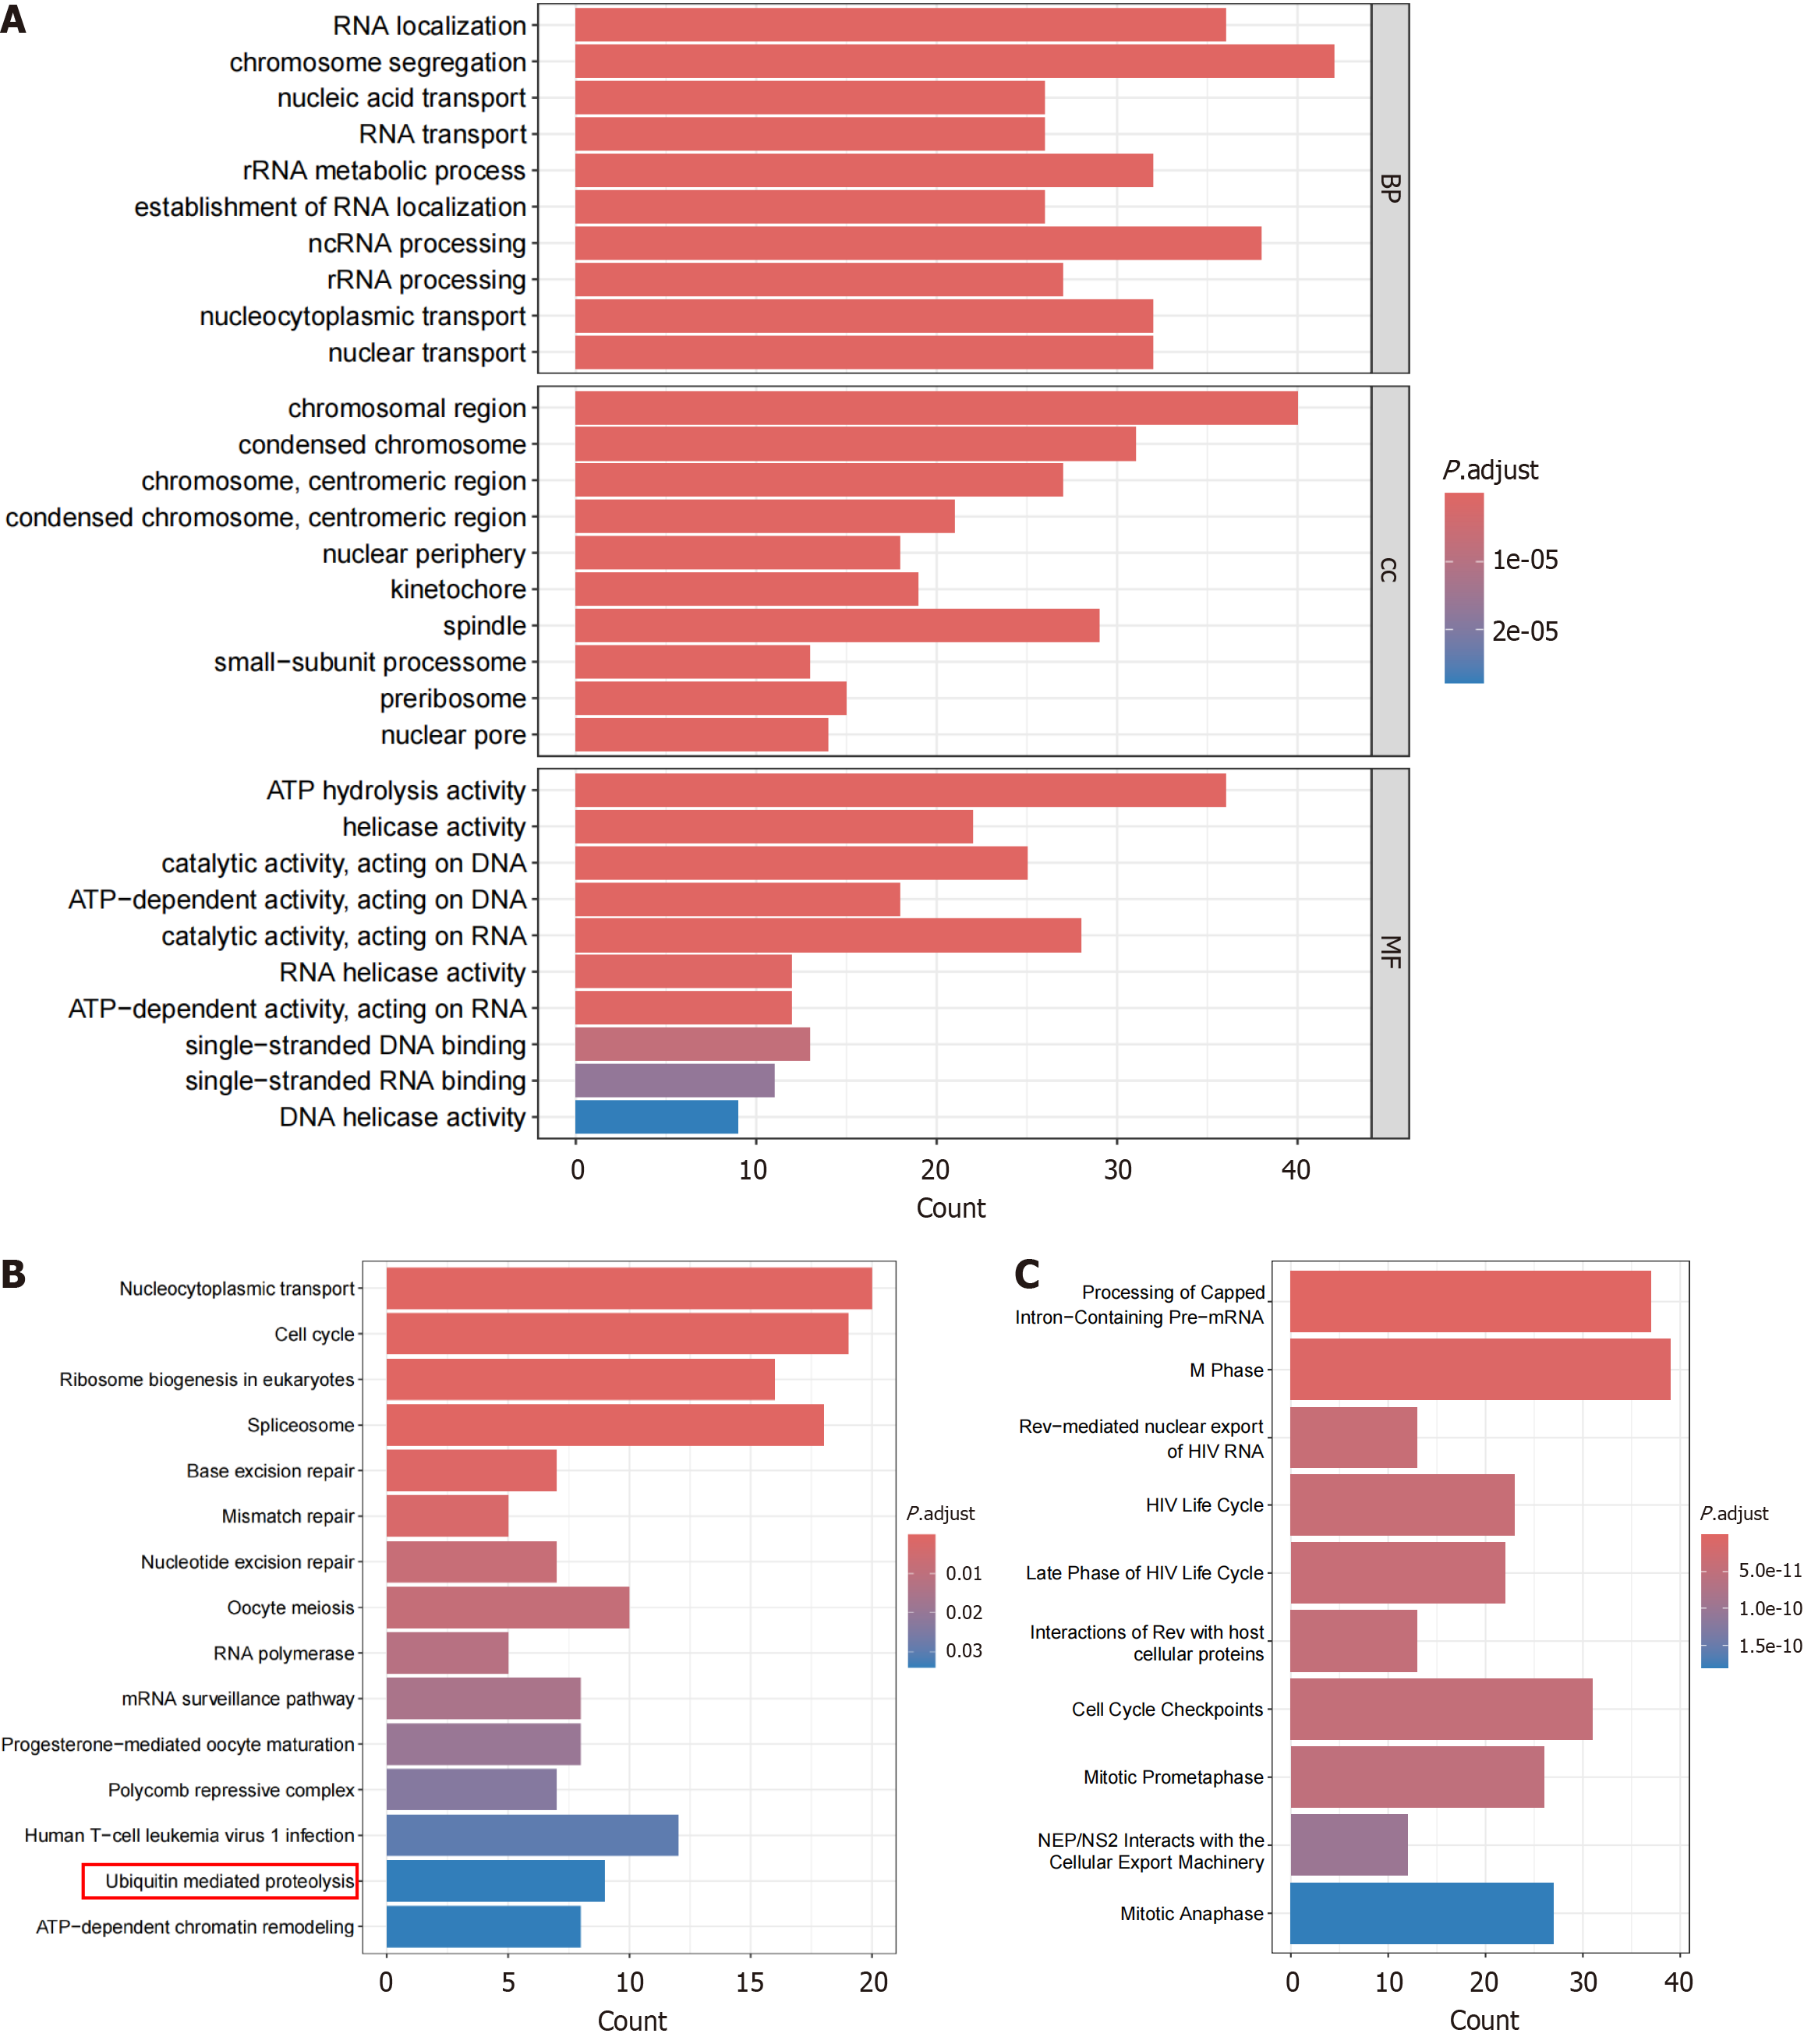
Figure 7 Enrichment analysis of highly expressed positive correlation genes related to ANAPC1.
A: Gene ontology; B: Kyoto encyclopedia of genes and genomes; C: Reactome. rRNA: Ribosomal RNA; ncRNA: Non-coding RNA; ATP: Adenosine triphosphate; HIV: Human immunodeficiency virus; NEP/NS2: Nuclear export protein/non-structural protein 2.
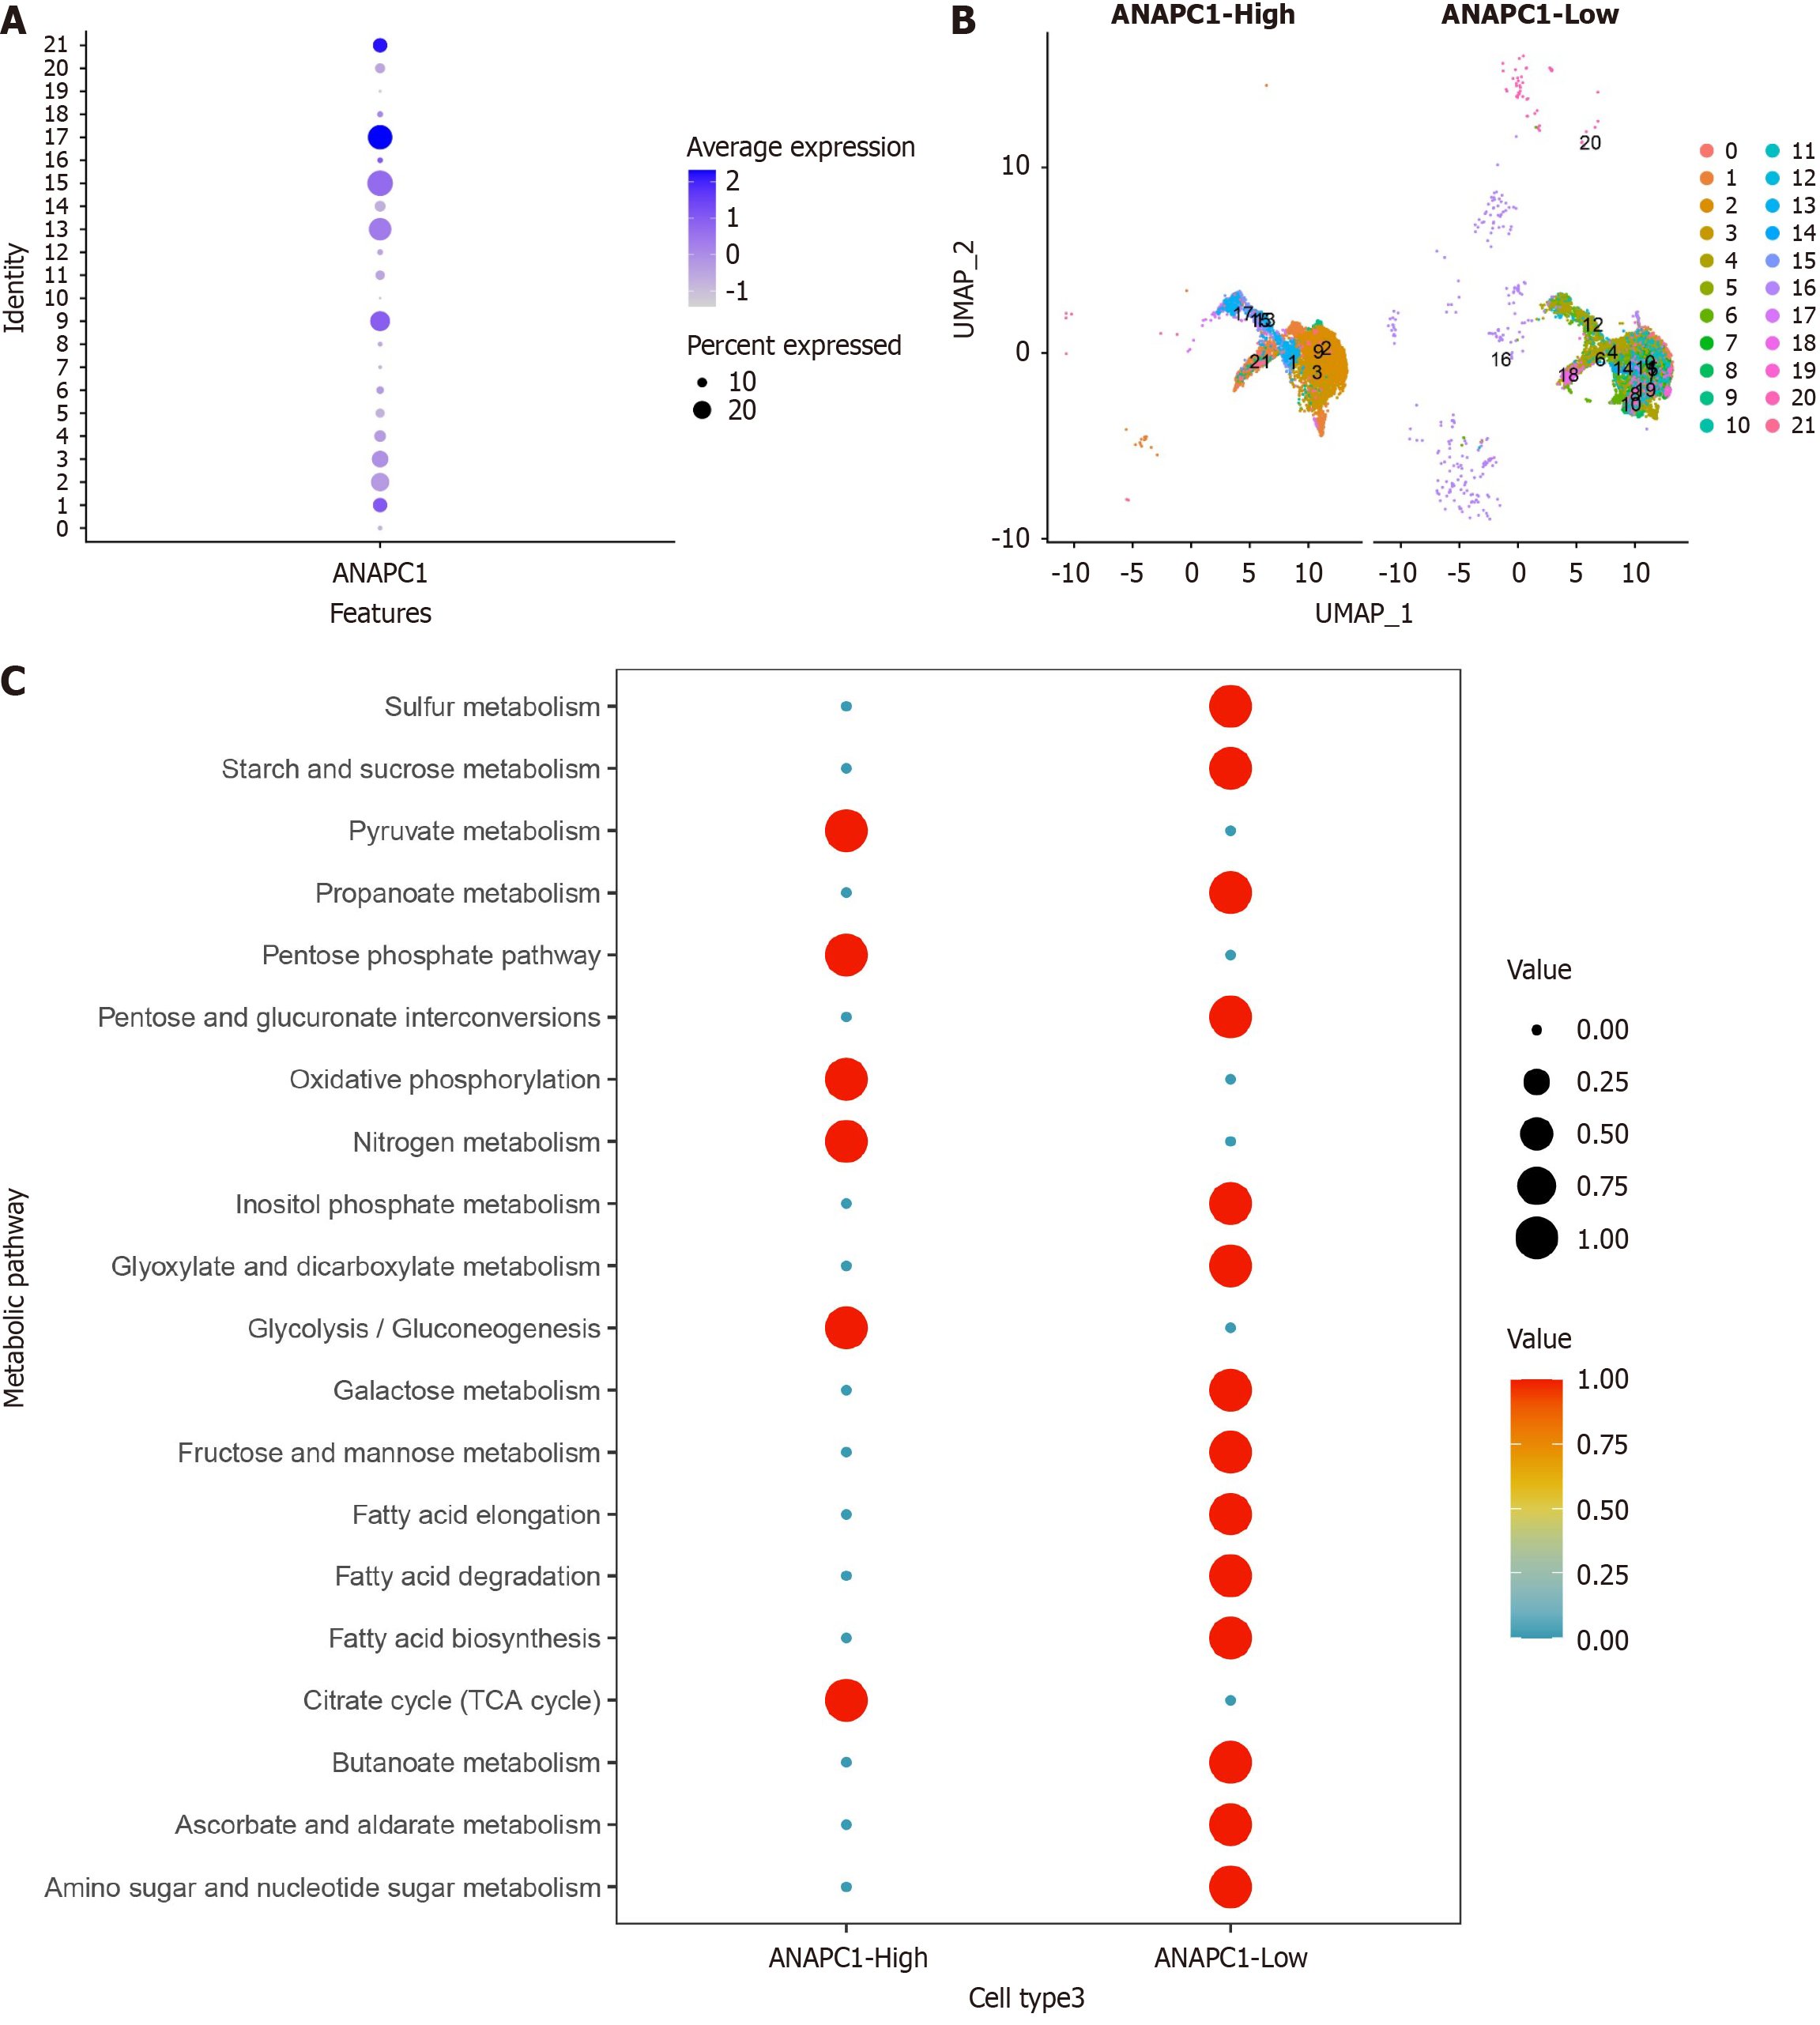
Figure 8 Analysis of ANAPC1 metabolic levels in single-cell RNA sequencing.
A: Expression levels of ANAPC1 in various clusters of malignant hepatocytes; B: Cluster distribution map of high and low ANAPC1 expression groups; C: Metabolic level analysis of high and low ANAPC1 expression groups. UMAP: Uniform manifold approximation and projection; TCA: Tricarboxylic acid cycle.
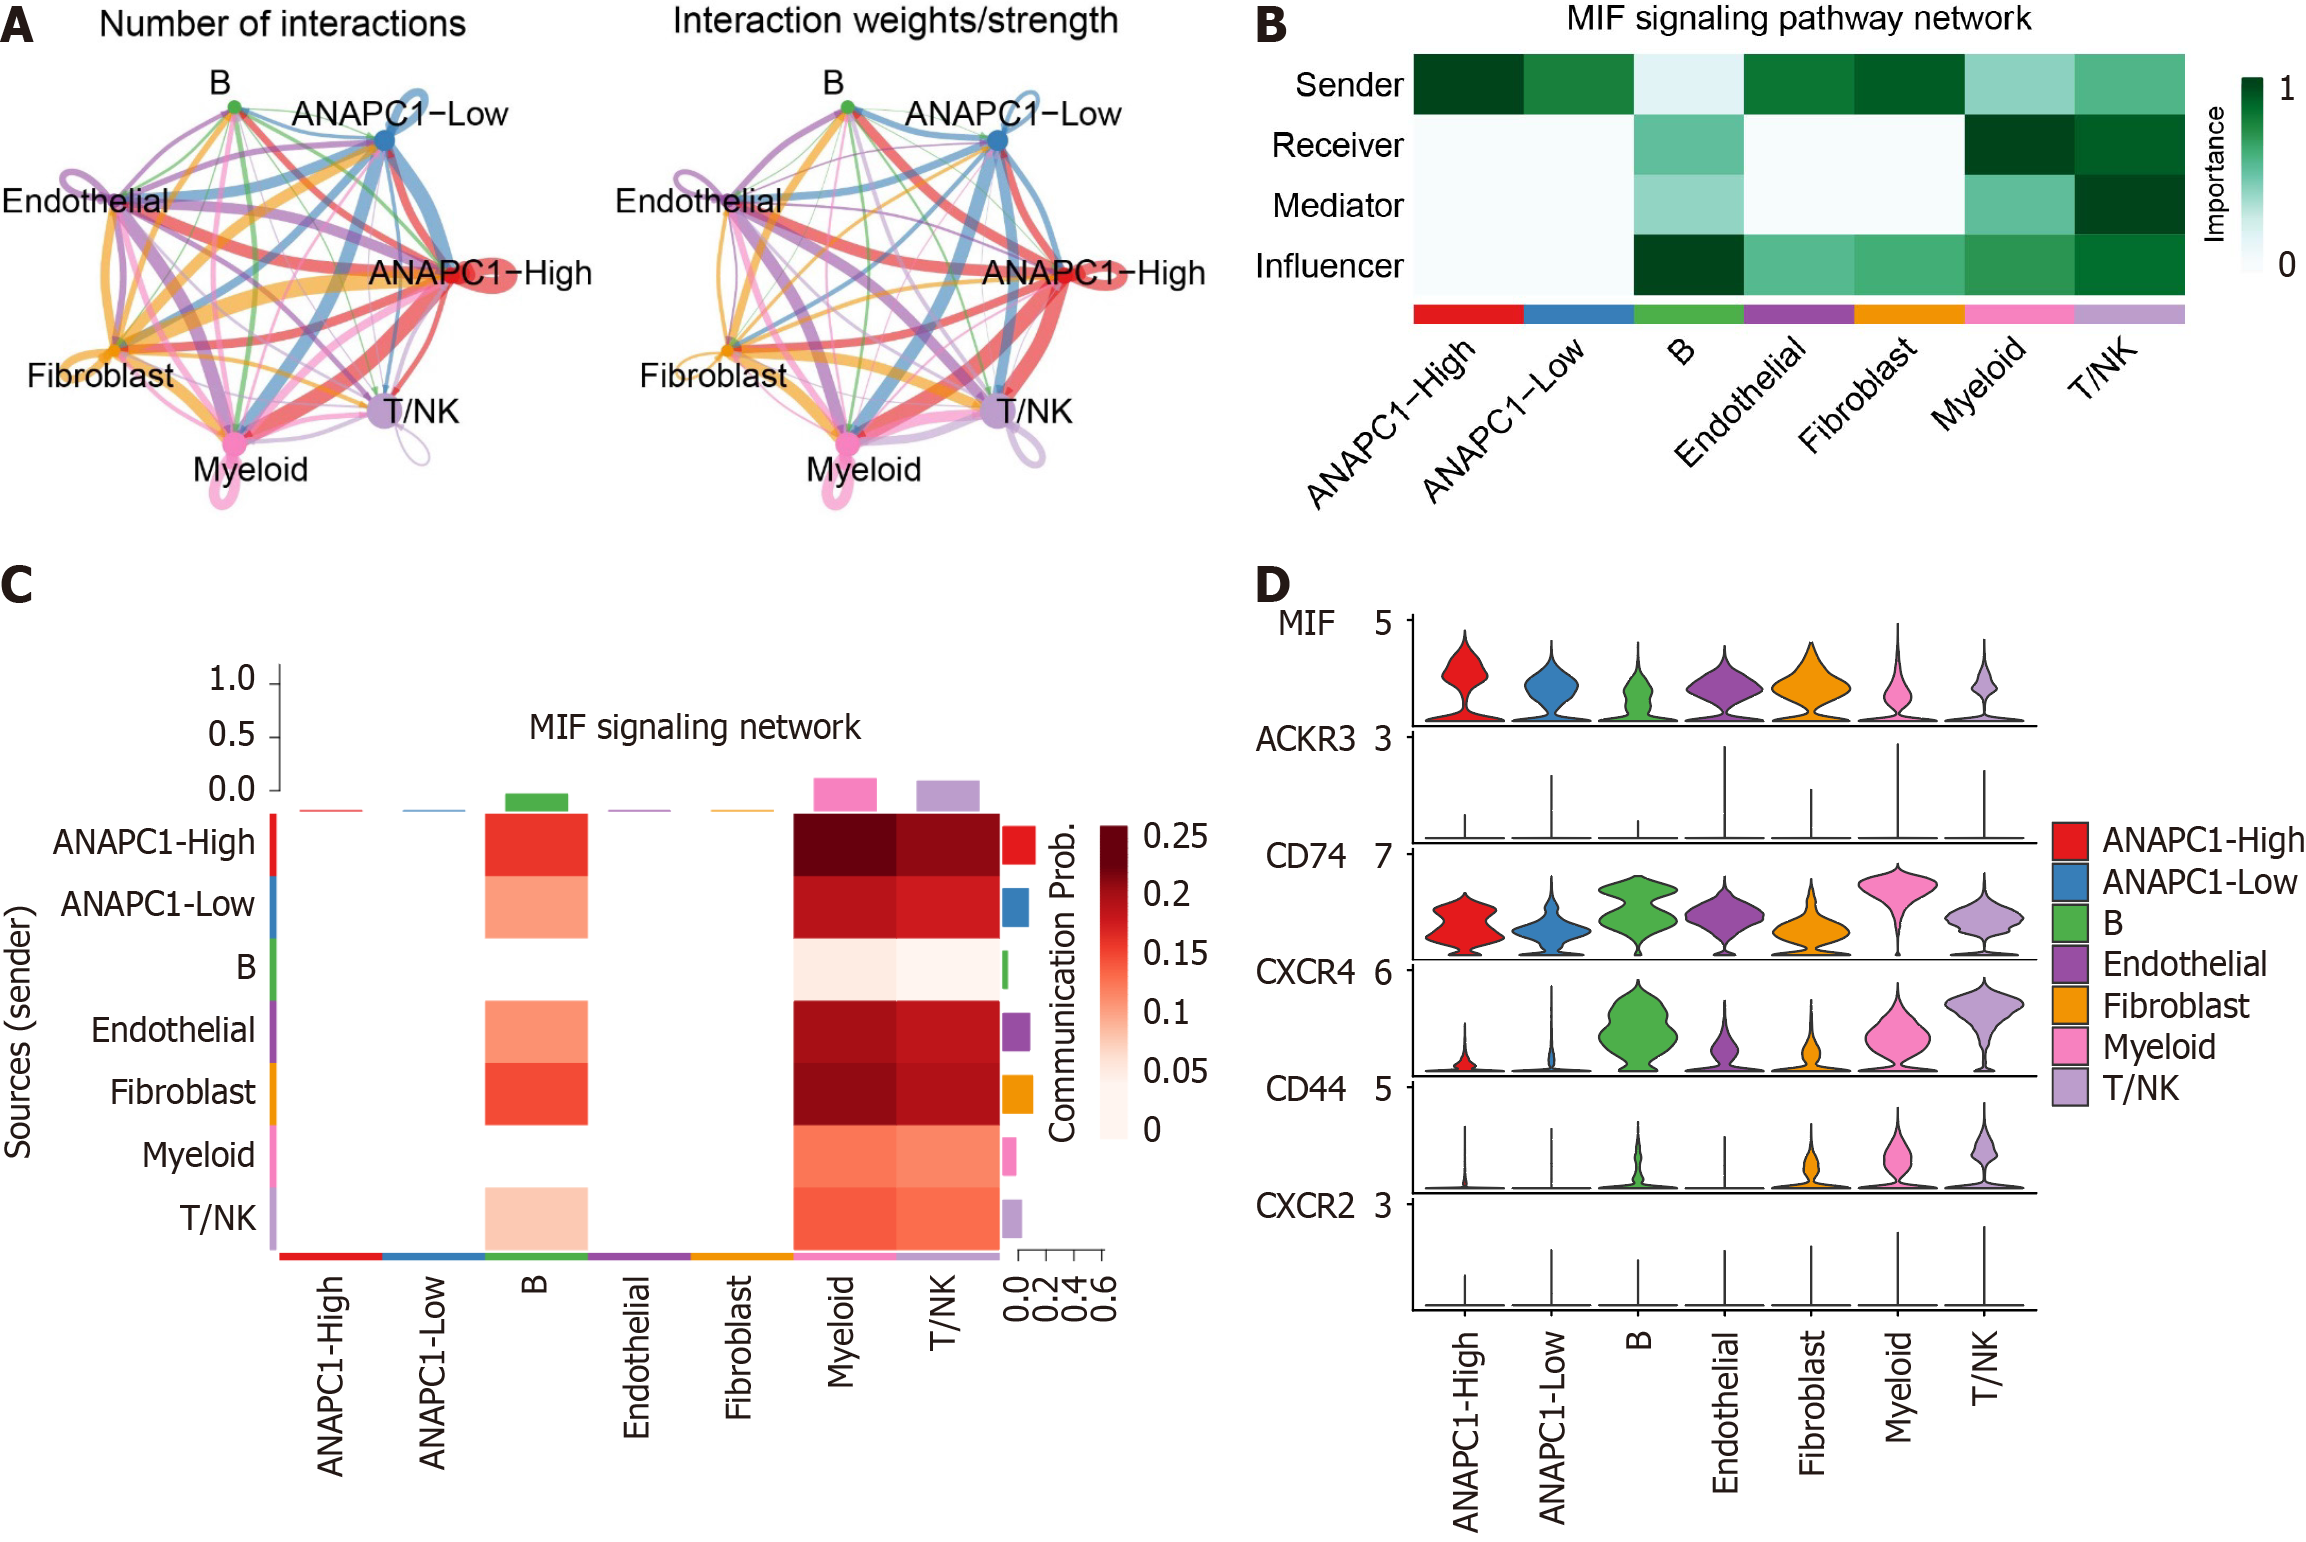
Figure 9 Regulation of high ANAPC1 expression in cell communication, particularly in the migration inhibitory factor pathway.
A: Weights/strengths of cell-cell interactions; B: Signaling roles of different cell clusters in the Midkine signaling pathway; C: Heatmap of cell types involved in the migration inhibitory factor pathway; D: Distribution of signal transduction genes participating in the Midkine signaling pathway. NK: Natural killer; MIF: Migration inhibitory factor; CXCR: C-X-C chemokine receptor; CD: Cluster of differentiation.
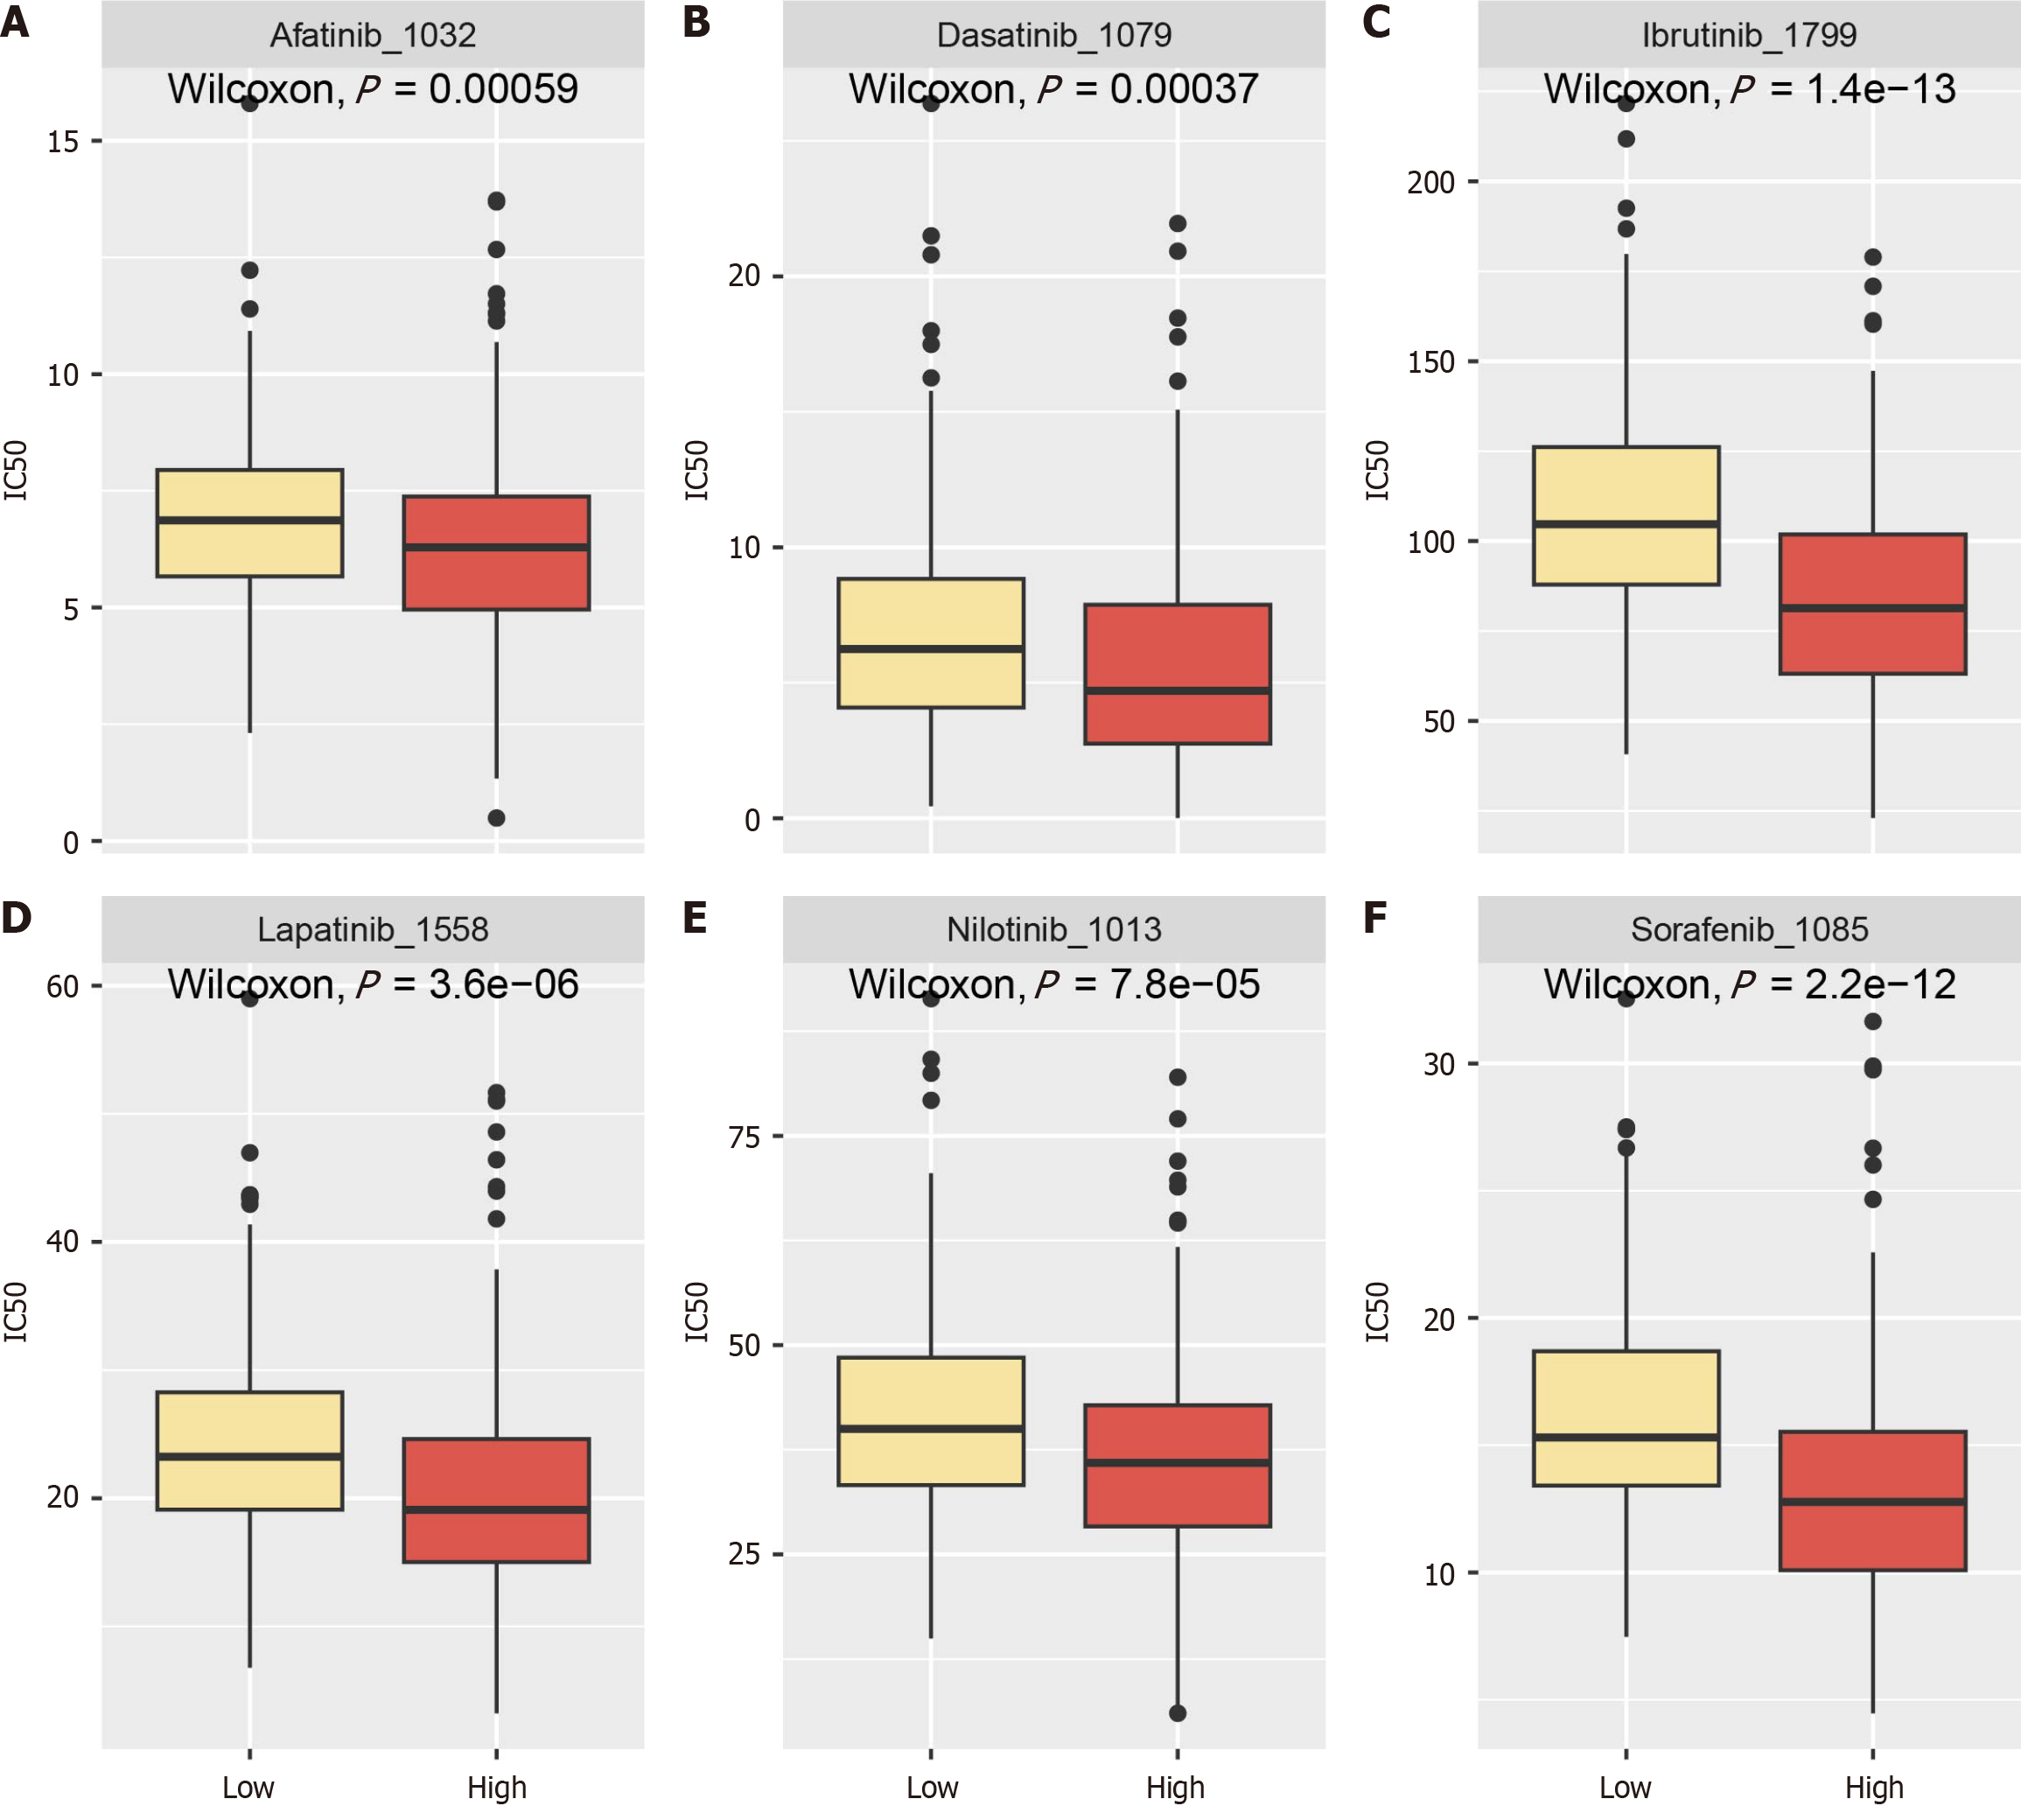
Figure 10 Relationship between ANAPC1 expression levels and tyrosine kinase inhibitors drug effects.
A: Sorafenib; B: Dasatinib; C: Ibrutinib; D: Lapatinib; E: Nilotinib; F: Afatinib. Ic50: Half maximal inhibitory concentration.
- Citation: Tang YX, Wu WZ, Zhou SS, Zeng DT, Zheng GC, He RQ, Qin DY, Huang WY, Chen JT, Dang YW, Tang YL, Chi BT, Zhan YT, Chen G. Exploring the potential function of high expression of ANAPC1 in regulating ubiquitination in hepatocellular carcinoma. World J Gastrointest Oncol 2025; 17(5): 103594
- URL: https://www.wjgnet.com/1948-5204/full/v17/i5/103594.htm
- DOI: https://dx.doi.org/10.4251/wjgo.v17.i5.103594


